
Data Driven Placemaking

Inactive Publication Date: 2014-10-30
SILVERMAN DAVID +2
View PDF3 Cites 25 Cited by
  • Summary
  • Abstract
  • Description
  • Claims
  • Application Information

AI Technical Summary

Benefits of technology

The patent text describes a tool called DDP that helps designers and decision makers take into account all the factors that affect the placemaking process. DDP can bring together data related to the problem and information about the specific context in which it will be used. By using DDP, designers can measure and analyze every factor that contributes to the success of an urban space. This encourages a holistic approach to planning, which takes into account a wide range of data points. DDP helps bridge the gap between information and knowledge by aggregating, validating, curating, transforming, and visualizing Variables in context. As the volume of data grows, DDP helps ensure that designers have access to the best information to create better spaces.

Problems solved by technology

Yet, stakeholders (including architects, designers, developers, governments, local communities, and other stakeholders) still lack appropriate tools for the efficient design, comparison, and assessment of spaces that are ultimately vibrant, safe, healthy, engaging, and productive—i.e., “successful.” Such successful spaces can serve as engines for economic growth and humanistic endeavor.
Conversely, poorly-planned and improperly-implemented “placemaking” may impose immediate and long-run costs to stakeholders, and to society at large; as spaces become underused, blighted, and depopulated.
As such, “failed” urban regions can become vacuums for commerce, nexuses for criminality, and foci of environmental deterioration.
Often, externalities and problems created by poor urban planning decisions grow more intractable, and more expensive to address, with the passage of time.
The resulting explicit and embedded costs to business owners, property owners, taxpayers, and municipal governments are significant.
This disappointing result in large measure attributable to an unmet need for evidence-based, data-driven methodologies relating theory to practice, and ideation to experience.
Such a need arises because the factors that should be considered when designing a new urban neighborhood, or redeveloping an existing one, are often so numerous that it is impossible to expect designers and decisionmakers to take every relevant factor into account.
Many such factors are thus left unattended or necessarily ignored given time constraints and other attentional limitations.
It should be noted, that many implemented plans are never seen by their designers due to the long amount of time and a myriad of factors that impact master plans.
Furthermore, there remain widespread disagreements about what can and should be done to create successful urban spaces.

Method used


Image

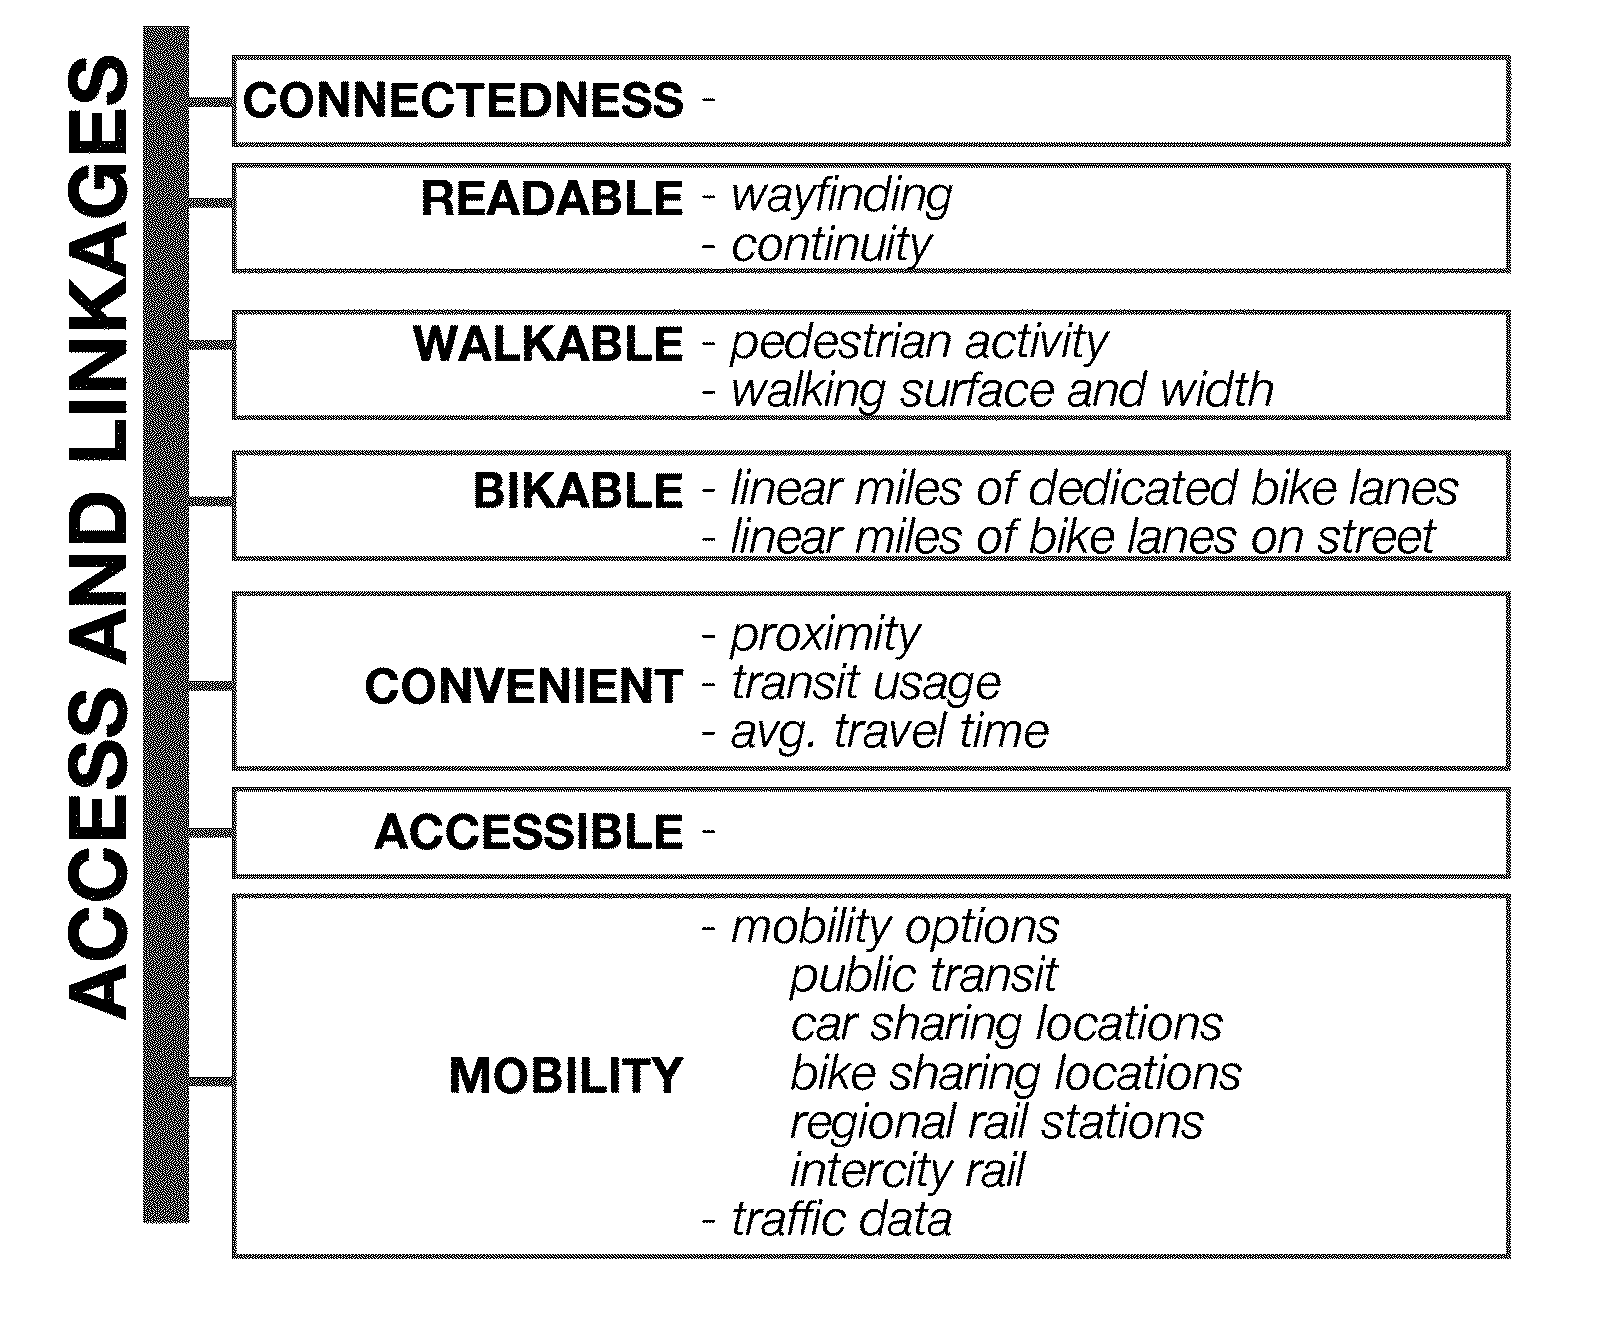
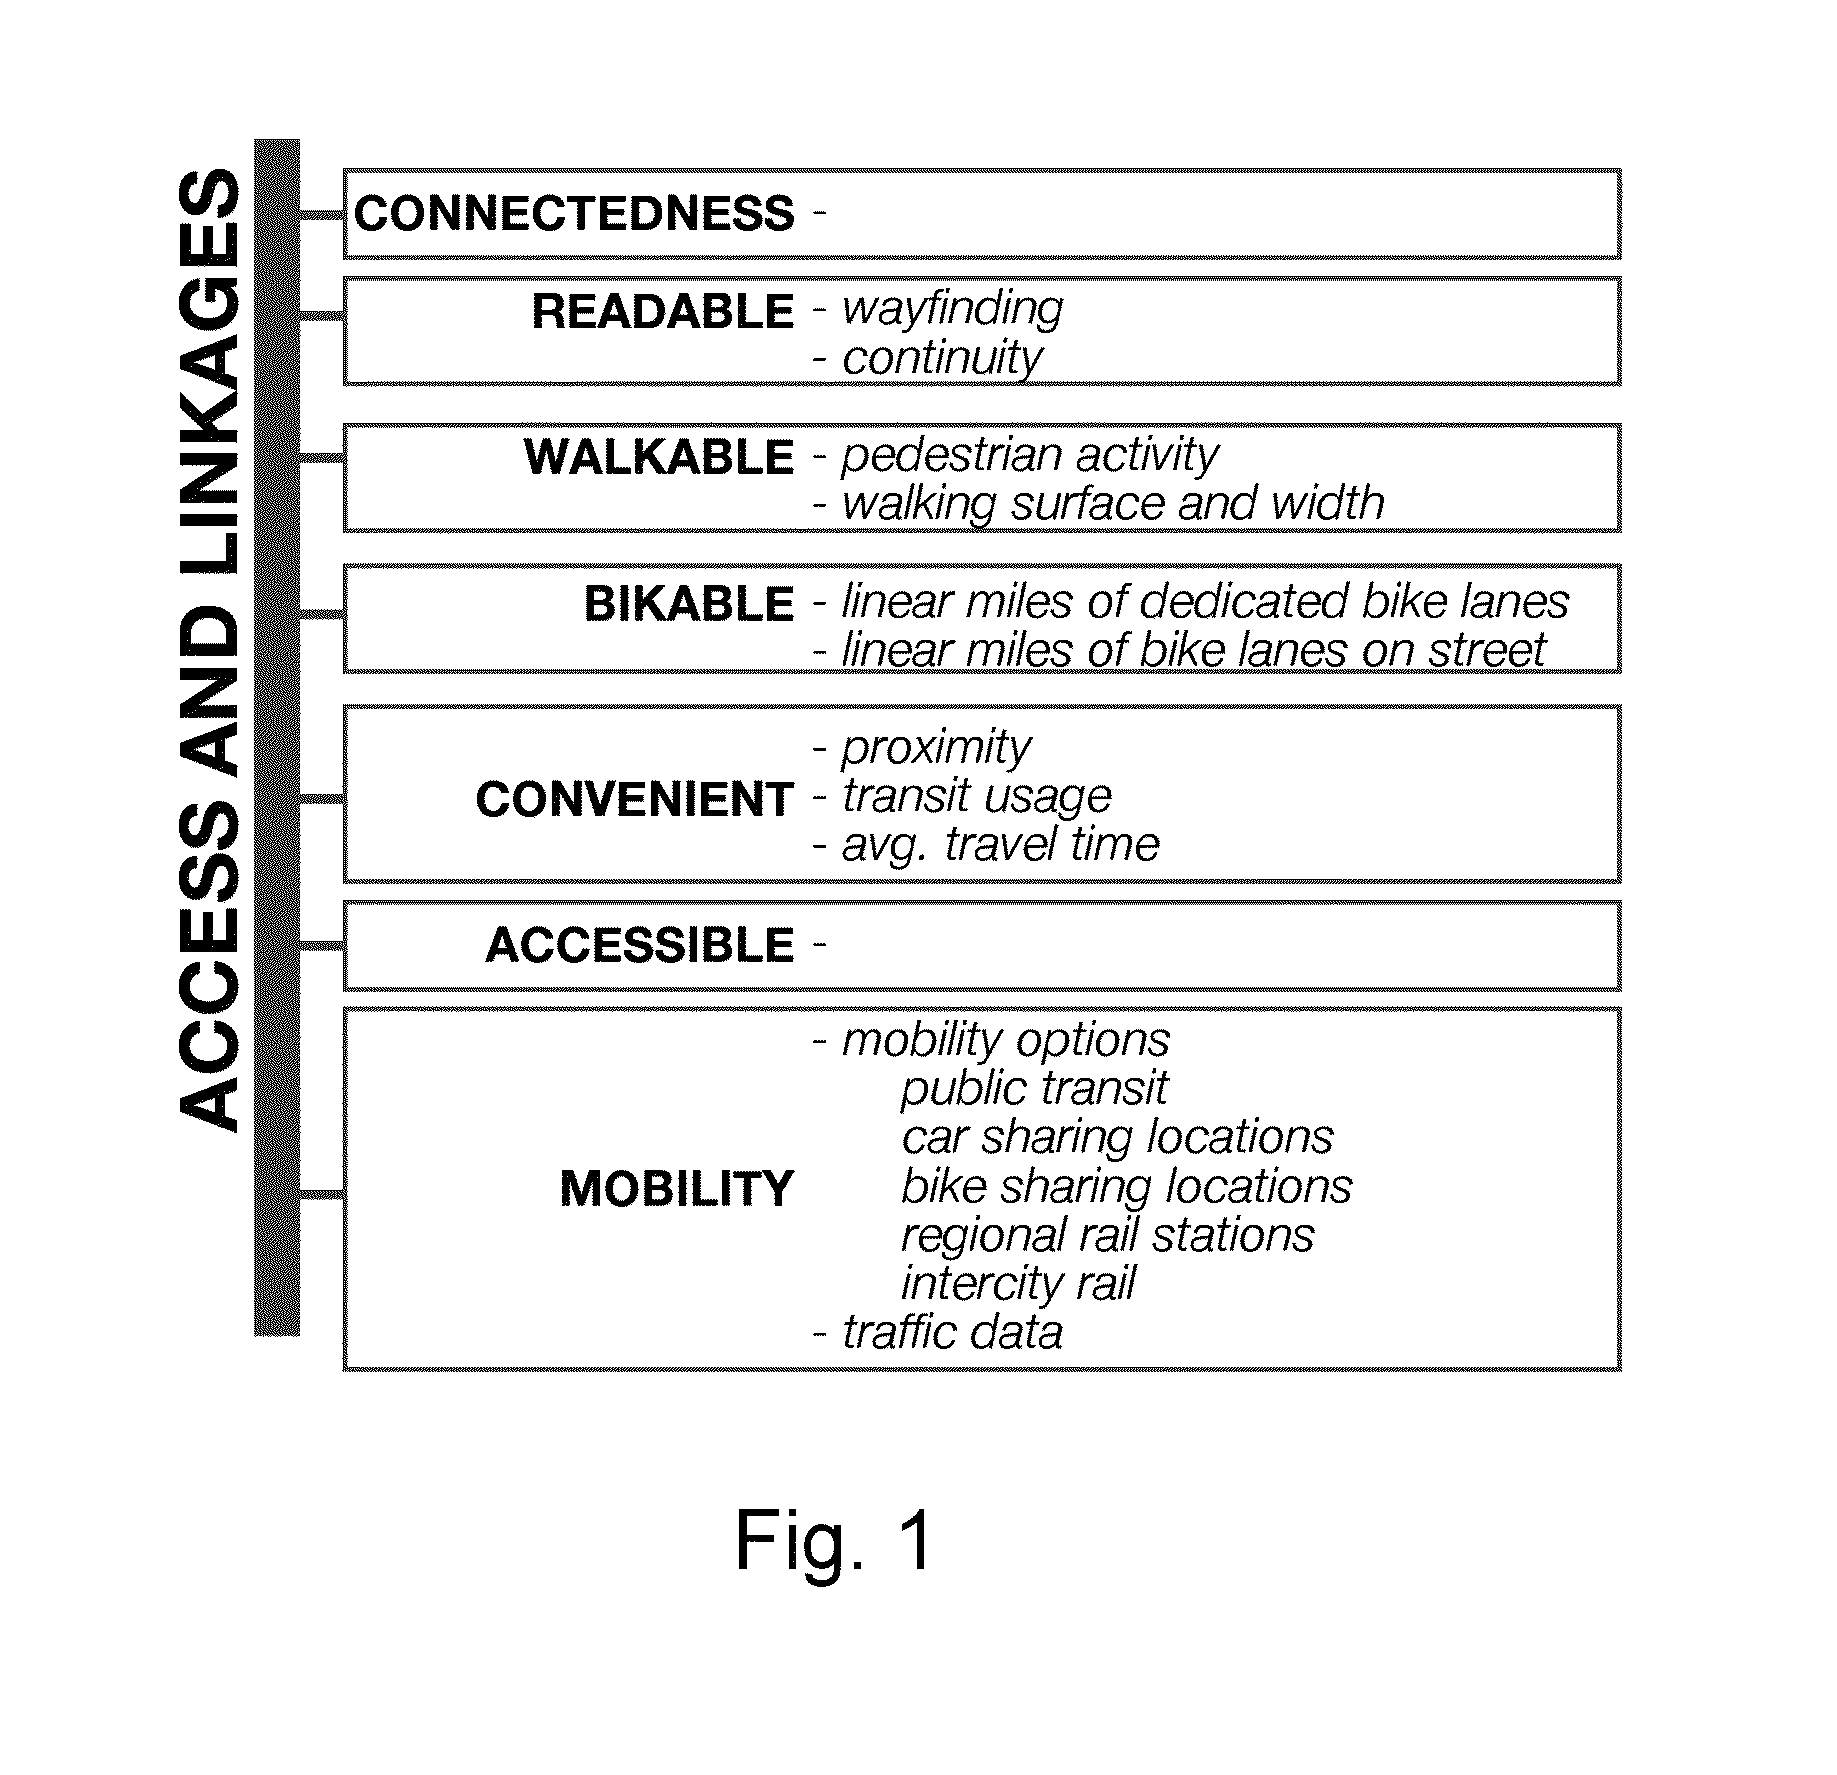
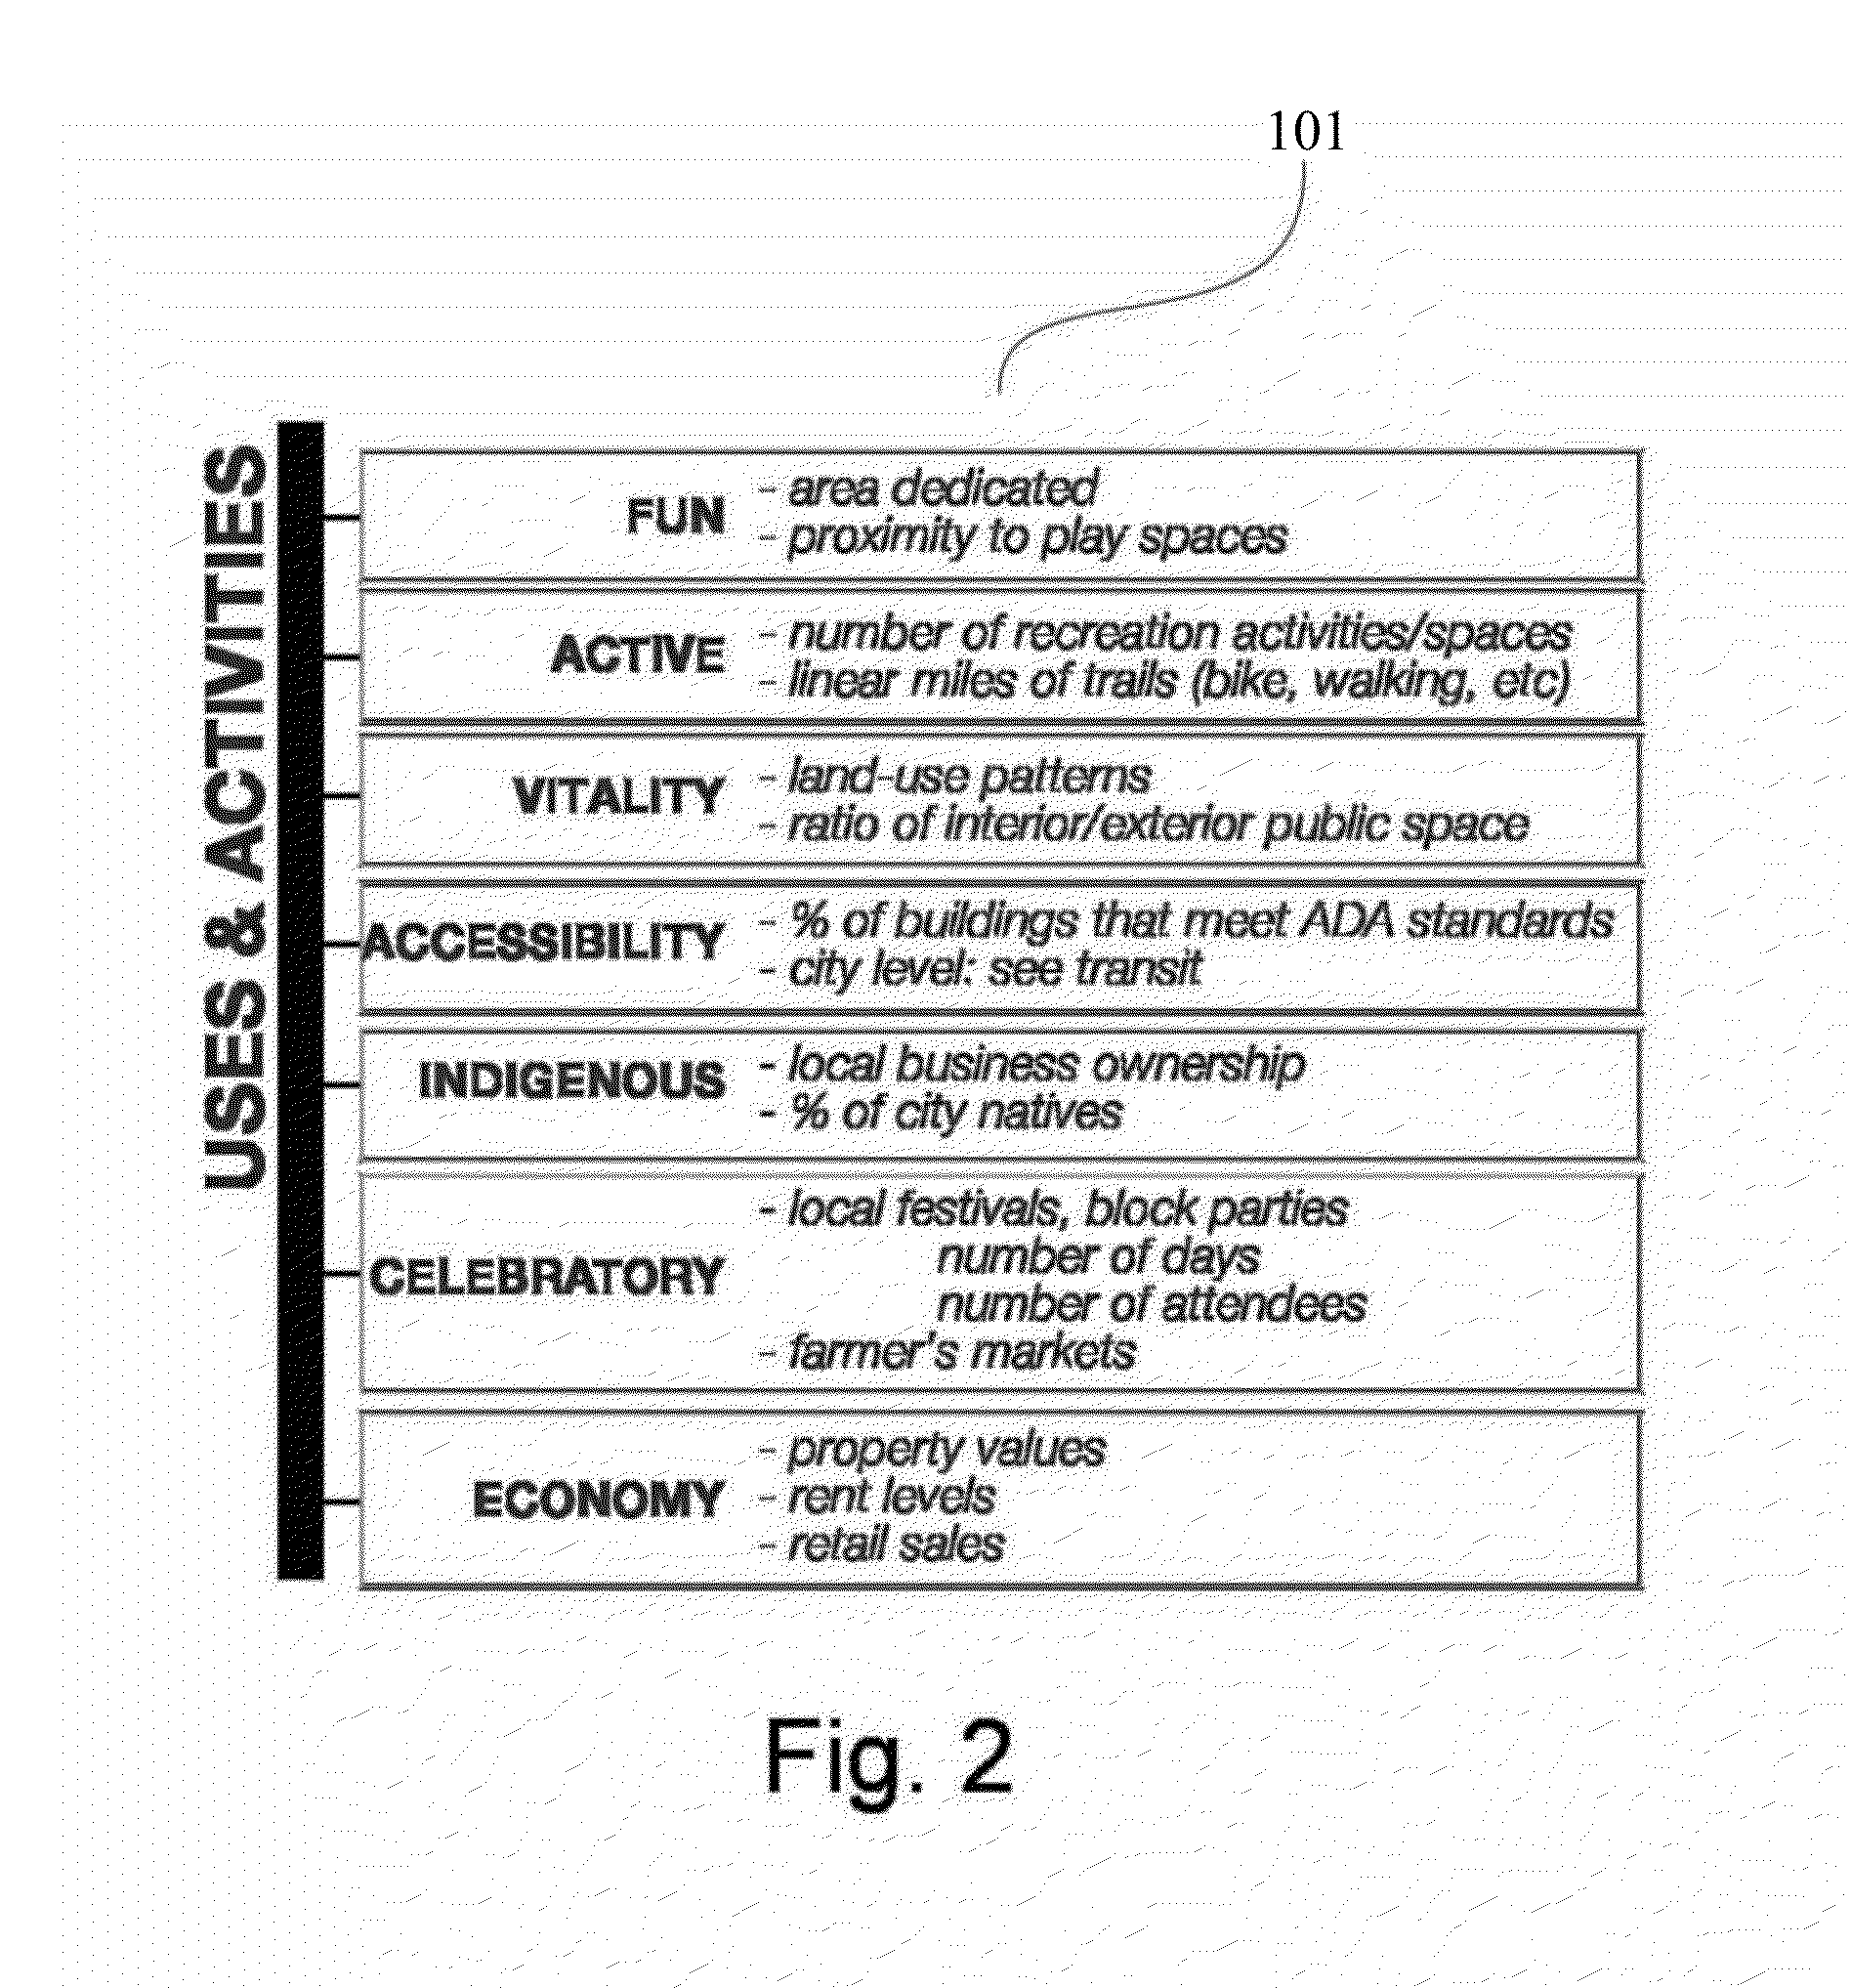
  • Data Driven Placemaking
  • Data Driven Placemaking
  • Data Driven Placemaking

Examples


example 1

Walkability

[0184]Walkability is a category that considers one's commute; model variables include amenities in walking distance and the quality for the experience of the pedestrian. Advantageously DDP analyzes the walkability of both proposed design model neighborhoods and built. The process of determining walkability as in FIG. 7 first uses located data sources for model variables that is referenced when computing the score and ratings, such as Google, Localeze, Open Street Map, education.com and schedules from transit agencies. Furthermore, information on grocery, restaurants, shopping, coffee, banks, parks, schools, books, entertainment, intersection density and average block length may be used as model design variables.

[0185]Furthermore, model variable data may include spatial and cultural data used to analyze proposed plans include GIS data from states, cities and nations. As well as census, cultural and economic data, LiDAR and Landsat imaging, as well as agencies such as the U...

example 2

Non-Successful DDP Design Precedent Hartford, Conn.

[0186]It is another feature of the invention for DDP to compare designs that are successful in comparable existing conditions as well as designs that are non-successful.

[0187]City: Hartford, Conn.

[0188]Neighborhood: Downtown Hartford

[0189]City Data:

[0190]Ranking: Undefined

[0191]Land Area: 17.3 square miles

[0192]Population: 124,060 in 2000

[0193]Economy: Medium income $28,300;

[0194]⅓ of population poverty stricken

[0195]Universities: Over 6,000 students

[0196]Key problems / struggle: Crime / poverty

[0197]Connections: Major airport for international flights; highways

[0198]Climate: Coastal+Northern

[0199]Overview: Hartford was considered one of the greatest cities in the United States up until the introduction of the automobile. When interstates 84 and 91 were created, both bordering downtown Hartford, the city floundered.

Evidence of Non-Success in the Neighborhood:

[0200]Low percentage of population taking public transportation[0201]High crime...

example 3

Non-Successful DDP Design Precedent Cambridge, Mass.

[0206]It is another feature of the invention for DDP to compare designs that are successful in comparable existing conditions as well as designs that are non-successful.

[0207]City: Cambridge, Mass.

[0208]Neighborhood: Kendall Square

[0209]Ranking: Undefined

[0210]Land Area: 1.241 square miles

[0211]Population: 12,940

[0212]Economy: MIT owns a lot of commercial real estate; business in neighborhood is technology driven

[0213]Universities: MIT nearby

[0214]Connections: Bus Routes and MBTA Red Line

[0215]Climate: Coastal+Northern

[0216]Overview: In the 1990s and 2000s, the area between Kendall and Cambridge Side Galleria transformed into what it is today. The square currently holds many offices, research buildings, biotechnology firms, and information technology firms. As a result, the square is only occupied during office hours.

Evidence of Non-Success in the Neighborhood:

[0217]Low green space and land percentage.[0218]Low diversity in buildin...


PUM


Abstract

The embodiments described herein relate to a modeling system that defines index categories and uses model variables for analyzing successful or non-successful implementation. Data Driven Placemaking (DDP) provides evidence-based support to stakeholders (including designers, decision makers, policy makers, academics, and community members) for the purposes of improving designs for cities (and groupings of city regions and subsets of urban regions), via the collection, storage, transformation, analysis, and visualization of data relating to index categories and model variables.

Description

[0001]This application claims the benefit of U.S. Provisional Patent Application No. 61 / 644,062 filed May 8, 2012.FIELD OF THE INVENTION[0002]The present invention relates to the field of placemaking, and in particular it relates to modeling that defines index categories and uses model variables for analysis of successful or non-successful implementation. Output variables are to assist in planning and generating a score card for a proposed design model, as well as predicting design model success.BACKGROUND OF THE INVENTION[0003]New cities are being created, and existing cities are growing, faster than ever before. For the first time in human history, over half of the global population lives in cities, and the percentage of individuals living in urban spaces is expected to reach 55% by 2030.[0004]In the industrialized world, people migrate to cities as they seek opportunities for employment, education, and cultural enrichment. Cities are often viewed as concentrations of wealth, indu...

Claims


Application Information

Patent Timeline
IPC IPC(8): G06F17/50G06N5/04
CPCG06N5/04
Inventor SILVERMAN, DAVIDPATEL, SALILFRAUSTO-ROBLEDO, ANTHONY
Owner SILVERMAN DAVID
Learn More