
System And Method For Quickly Visualizing Oil And Gas Field Data

a technology of system and method, applied in the field of system and method for quickly visualizing oil and gas field data, can solve problems such as data problems that need further action, and achieve the effect of quick change of output format and rapid switch

Inactive Publication Date: 2014-12-11
THE INFORMATION STORE
View PDF7 Cites 12 Cited by
  • Summary
  • Abstract
  • Description
  • Claims
  • Application Information

AI Technical Summary

Benefits of technology

The present invention is a system and method designed to help petroleum engineers and scientists quickly analyze and quality control large amounts of oil field data. The data comes from various databases maintained by petroleum companies and can be viewed in a variety of formats, allowing users to quickly identify incorrect, missing, or duplicated data types. By viewing the data in a graphical form, data owners can also identify missing or incorrect data. This system and method provide a powerful tool for identifying data problems and helping to improve the accuracy and quality of oil field data.

Problems solved by technology

When a large difference or gaps are noted it can indicate a data problem which needs further action.

Method used


Image

  • System And Method For Quickly Visualizing Oil And Gas Field Data
  • System And Method For Quickly Visualizing Oil And Gas Field Data
  • System And Method For Quickly Visualizing Oil And Gas Field Data

Examples


Embodiment Construction

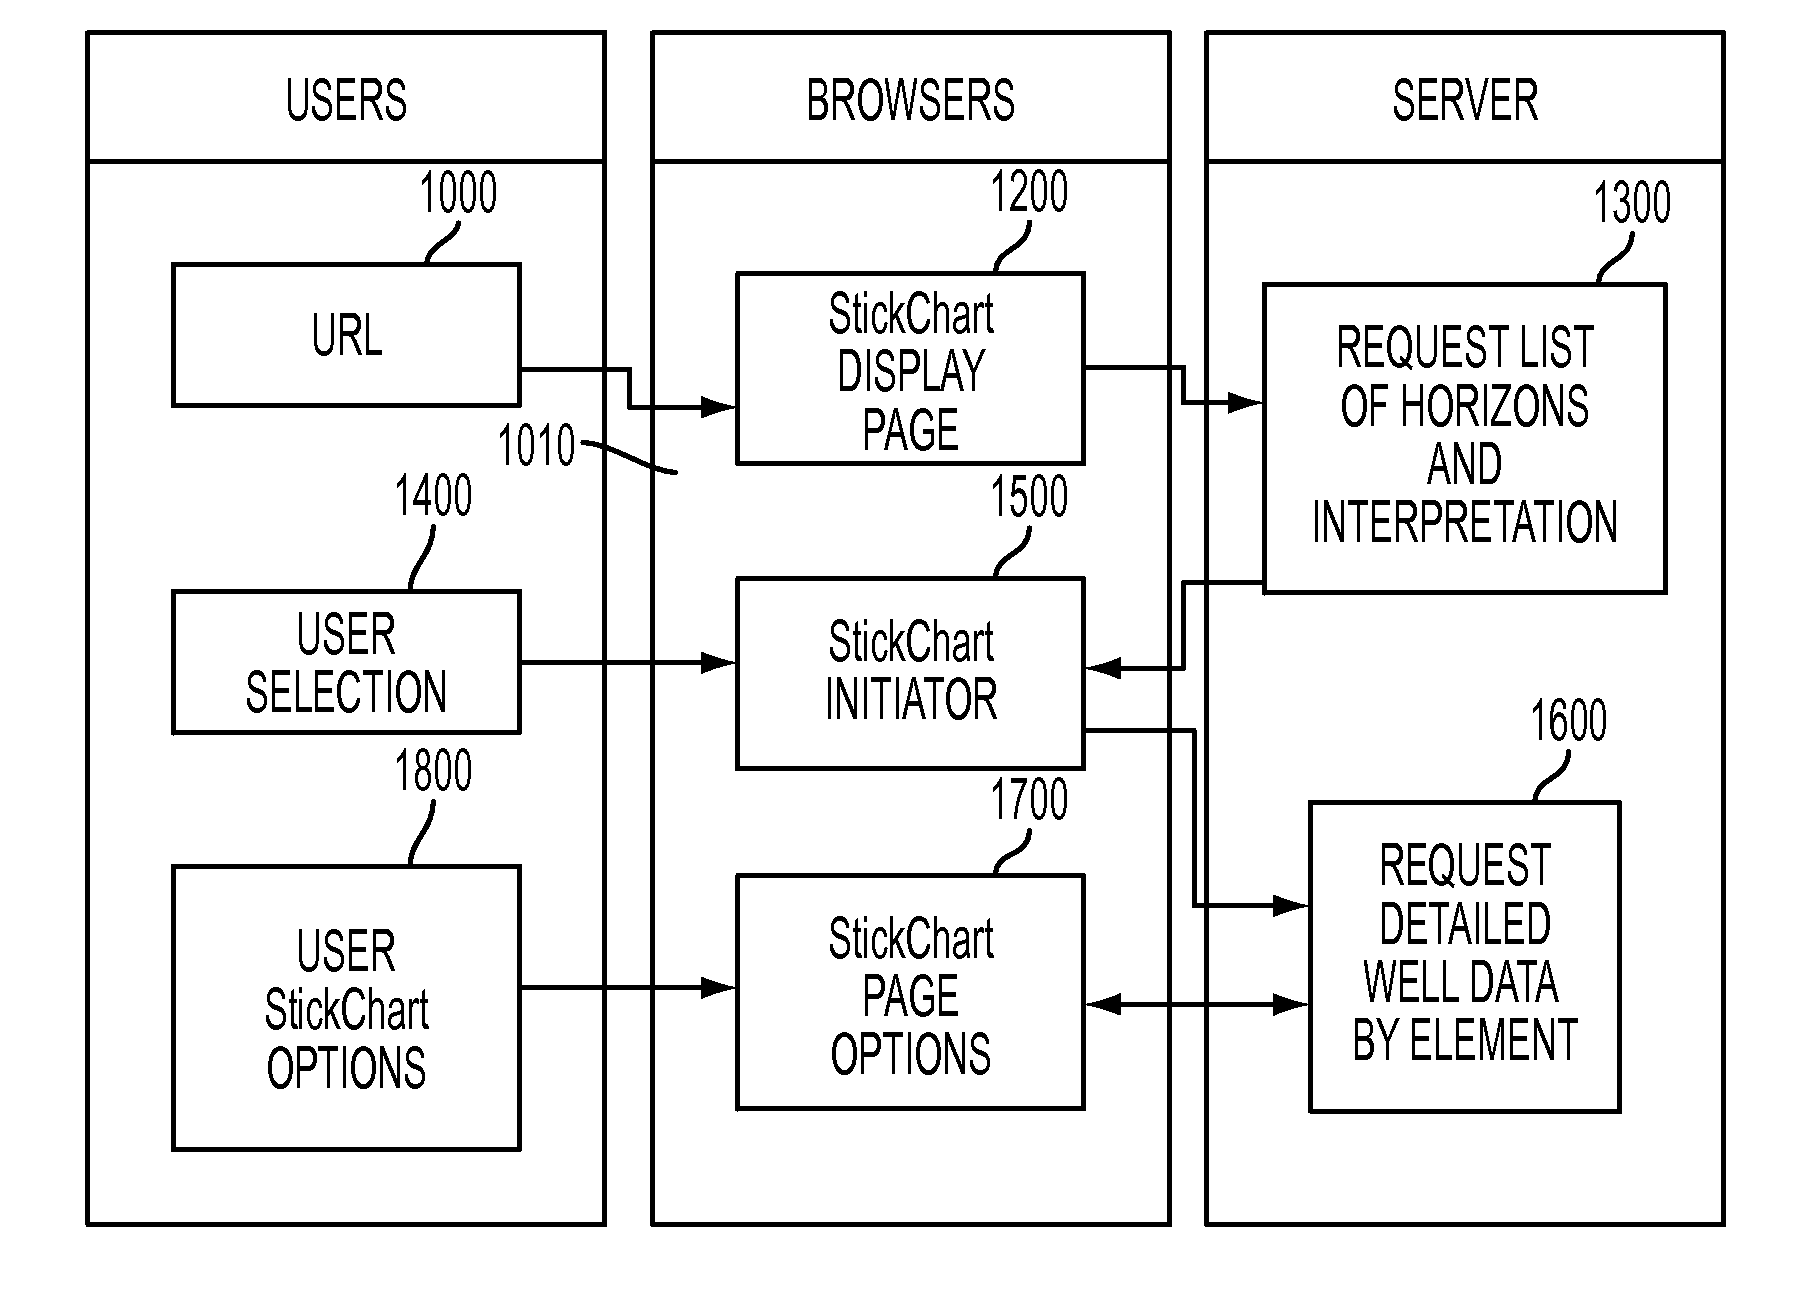
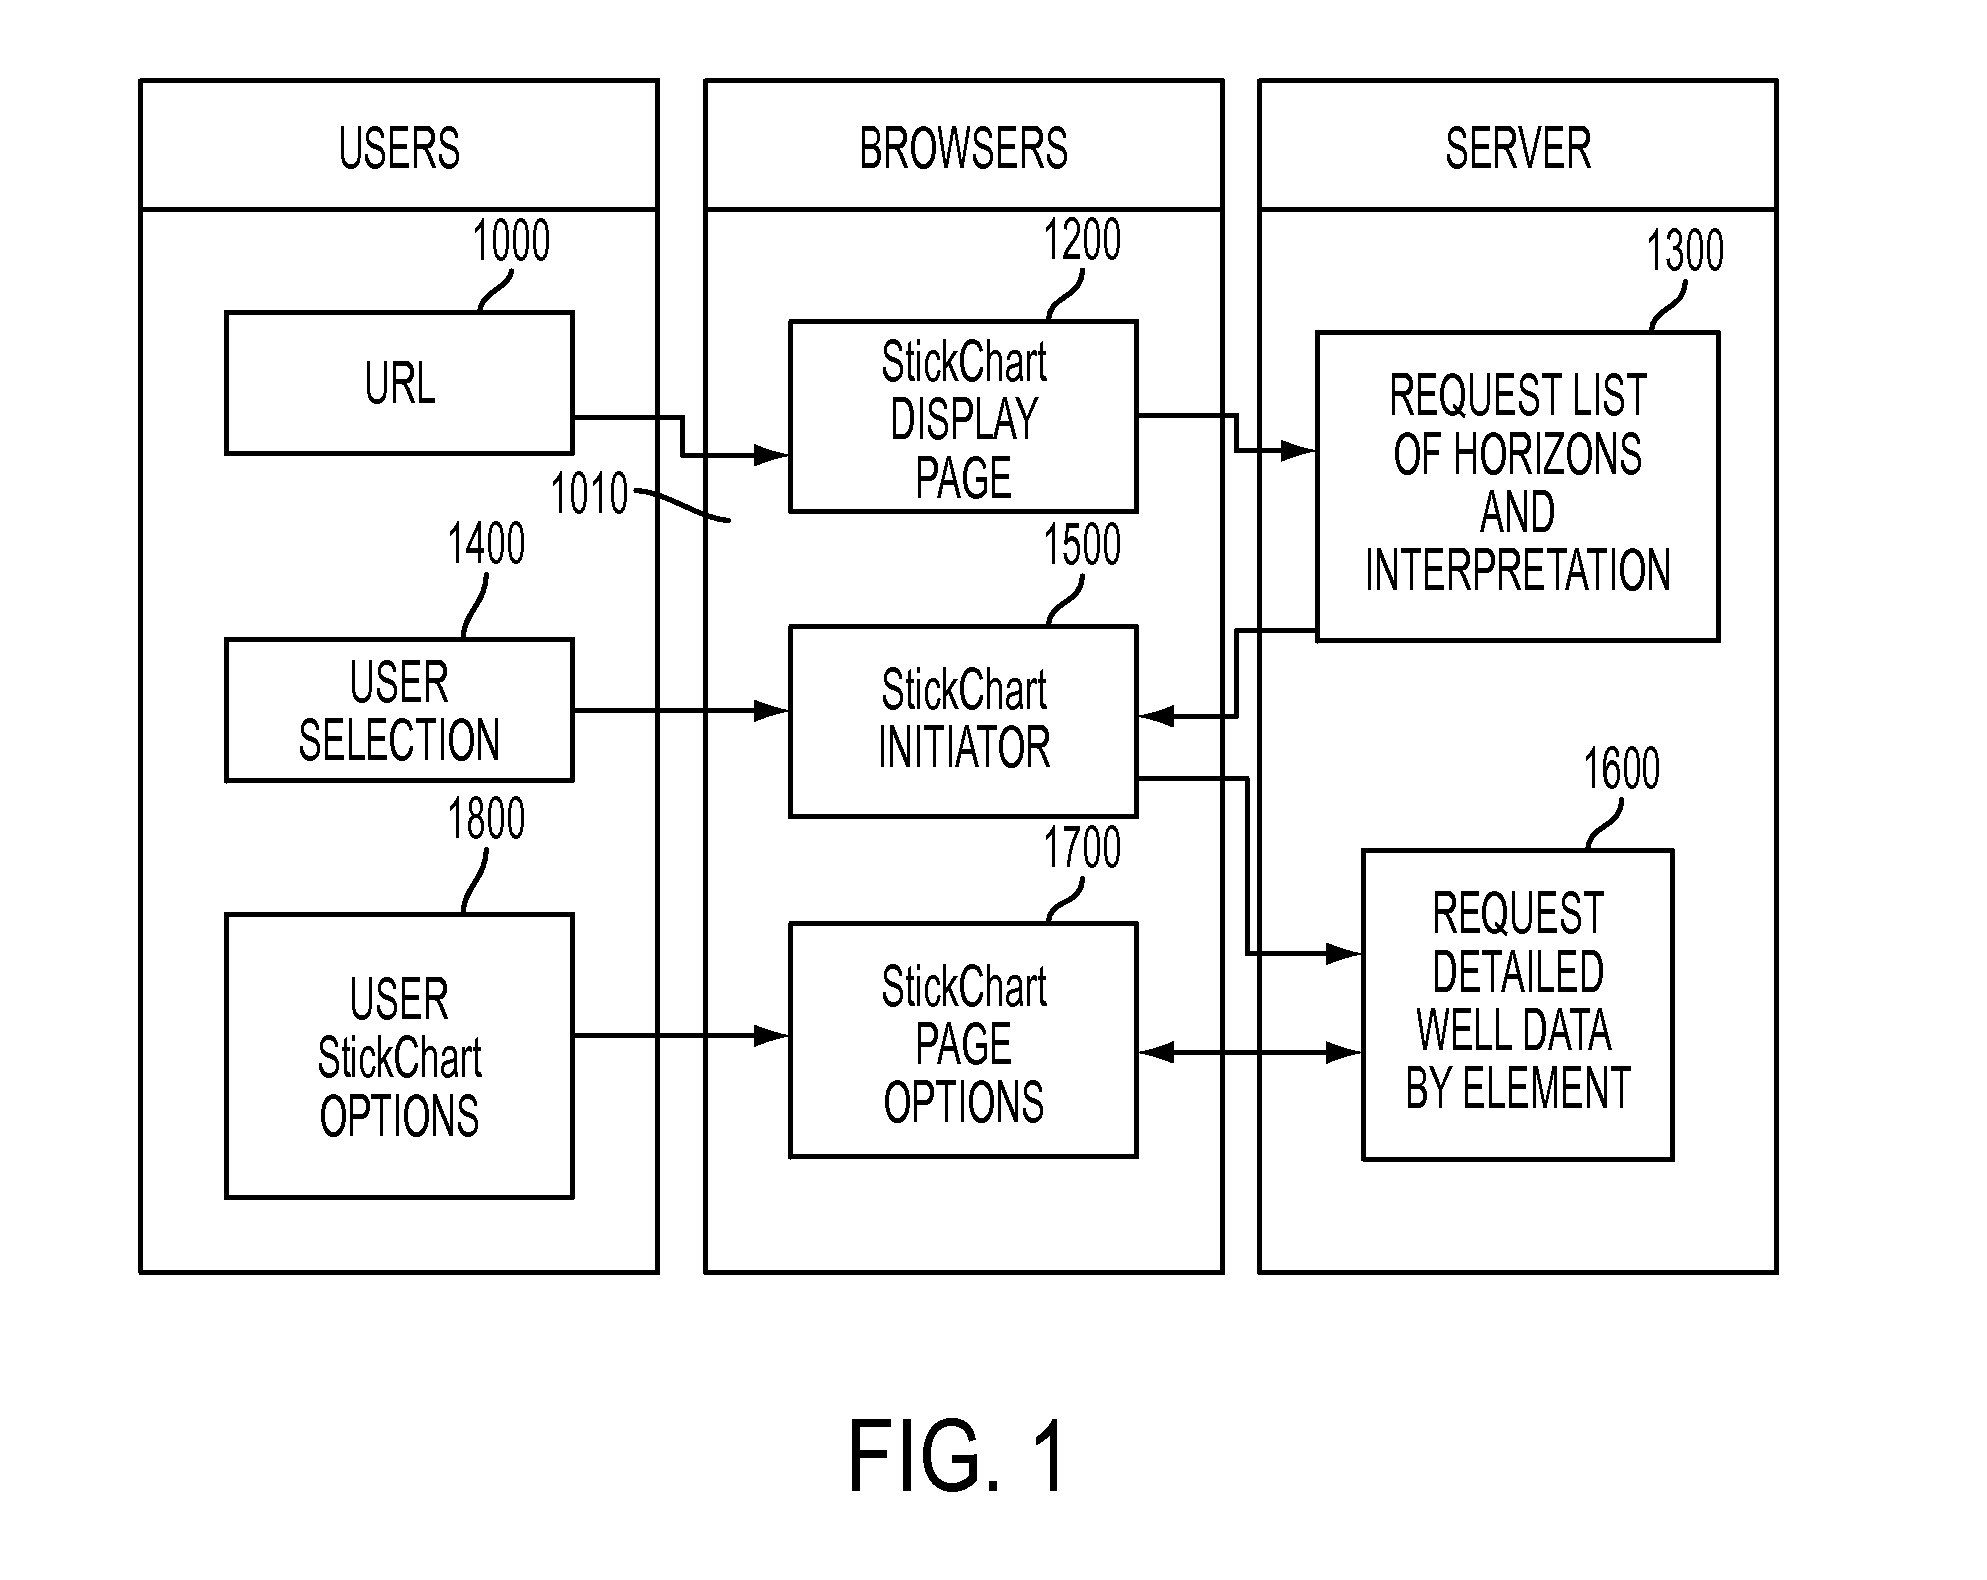
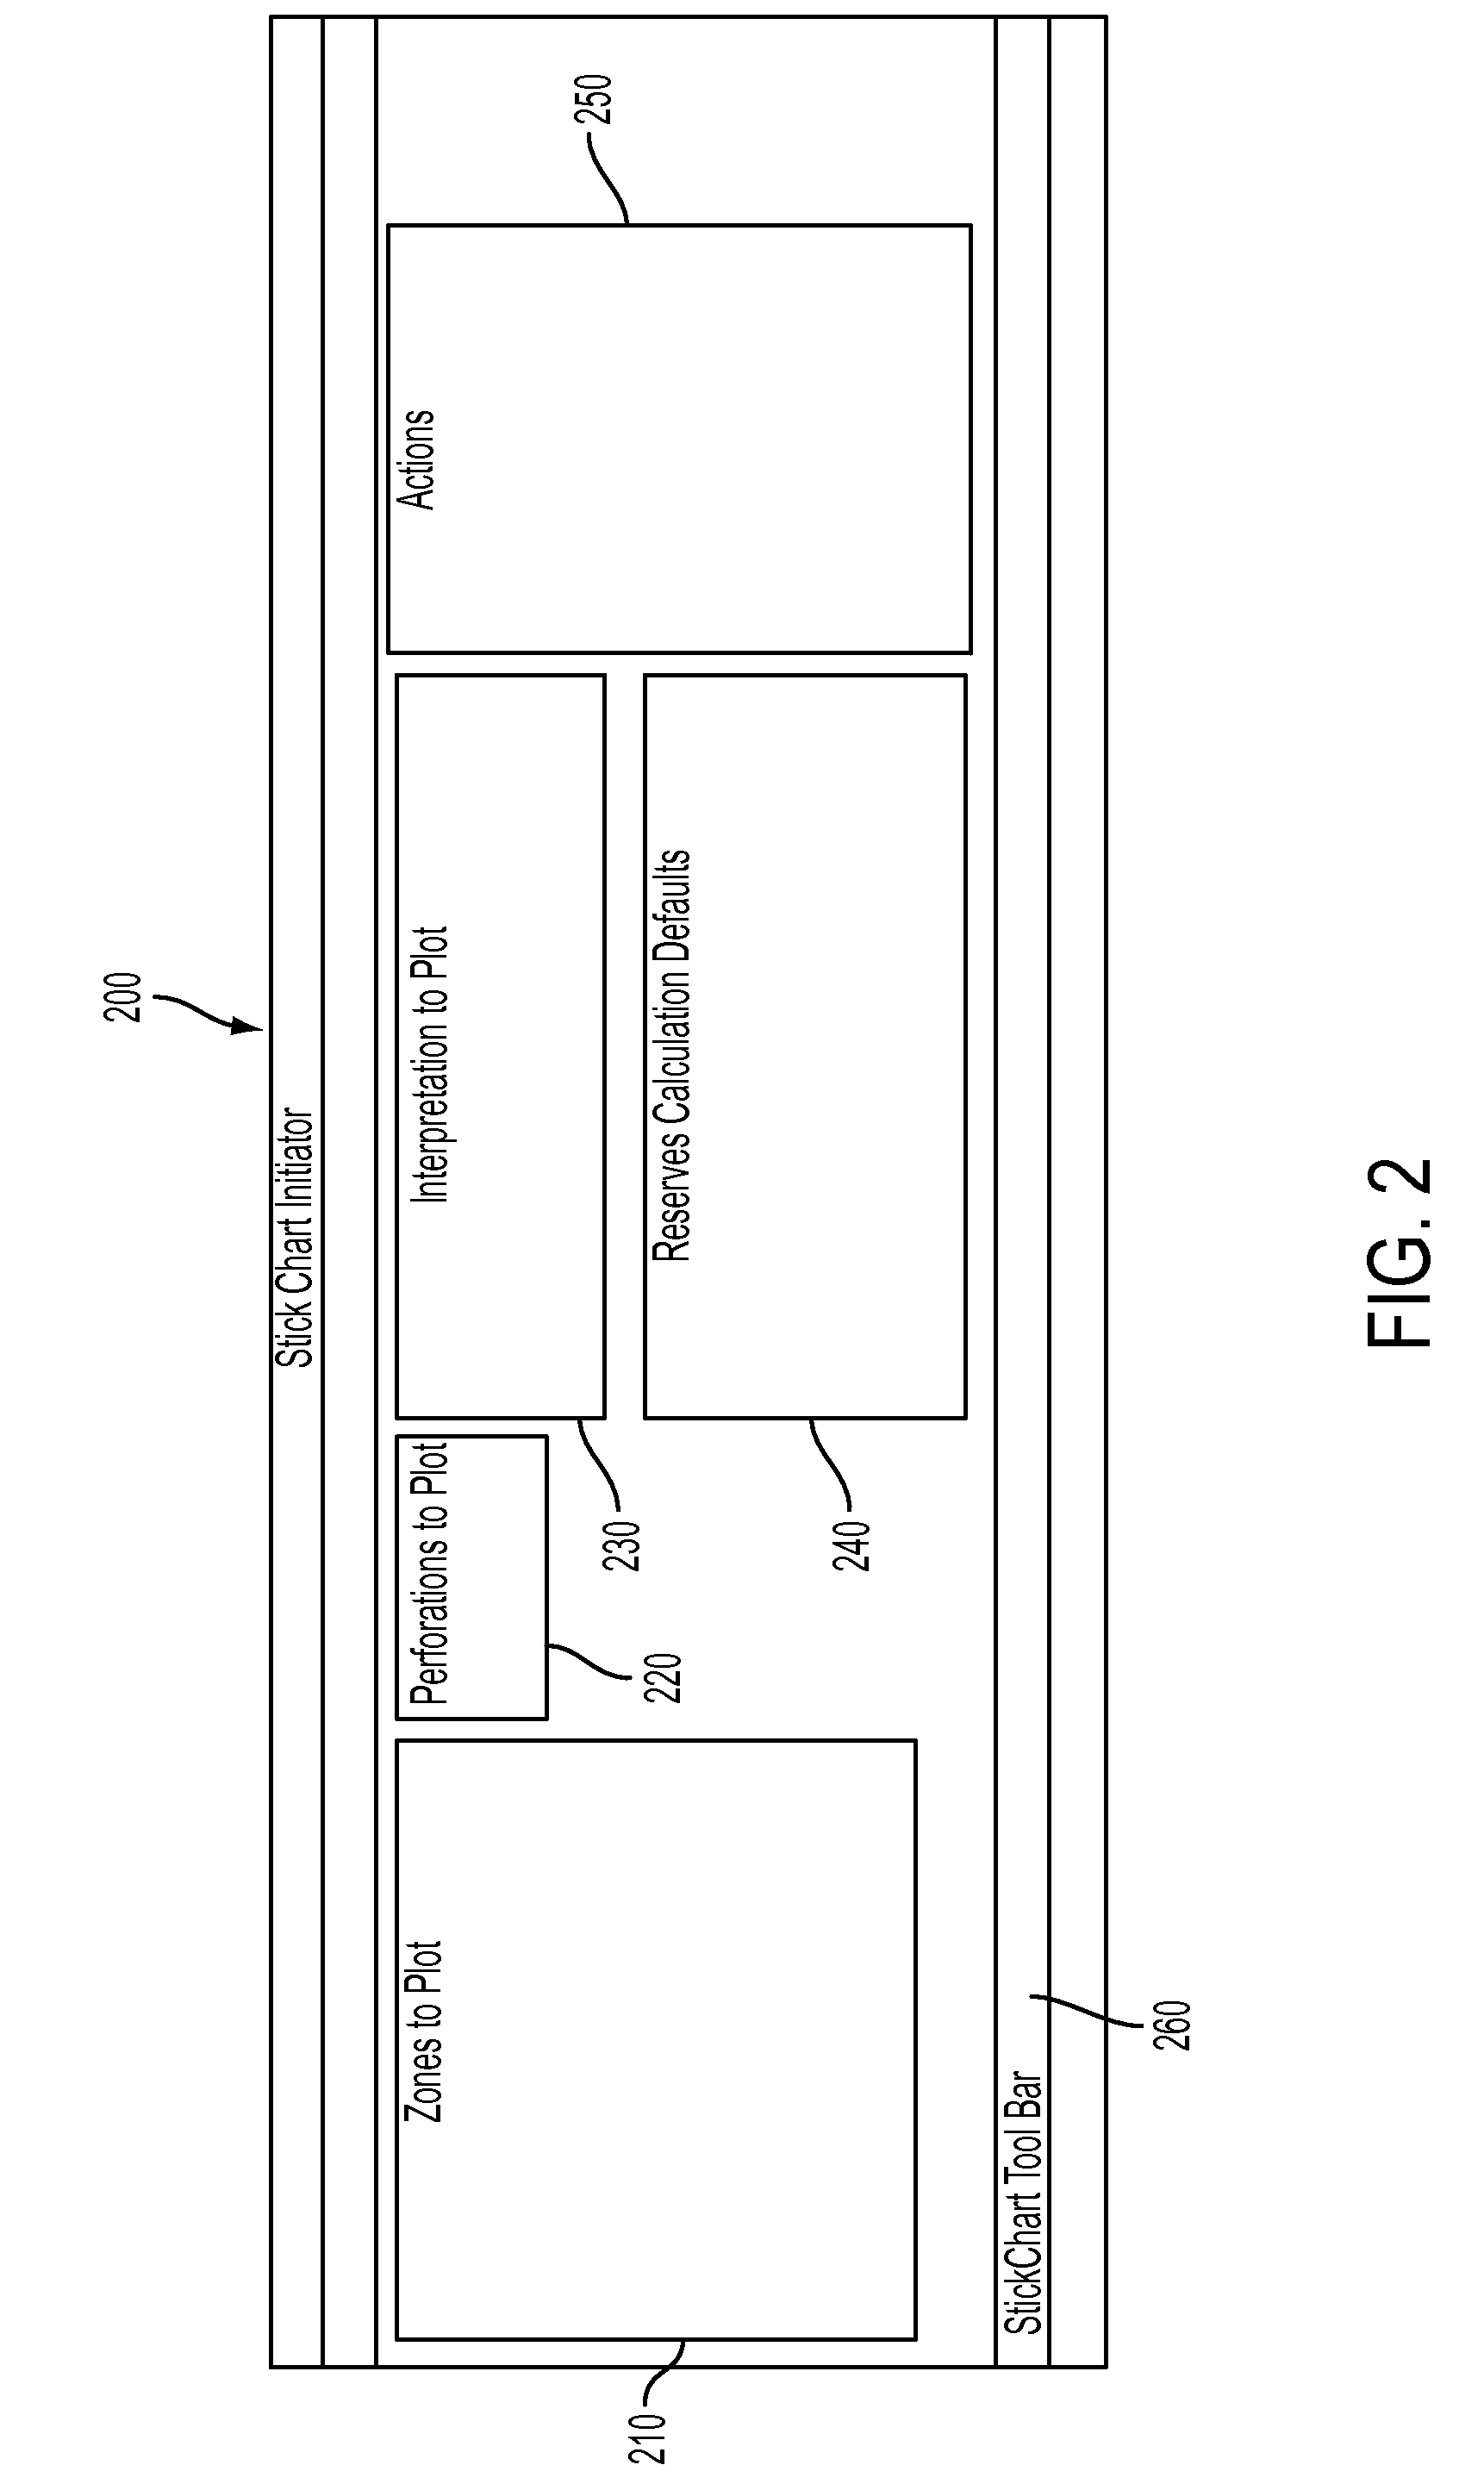
[0015]Referring to FIG. 1, the system of the present invention generates a dynamic computer chart which will be referred to herein as a “stick chart” that is used to display detailed oil and gas well data in a variety of ways in order to facilitate interpretation of reservoir characteristics, e.g., hydrocarbon reserves. The stick chart is drawn on an HTML5 canvas using any web browser capable of supporting JavaScript and HTML5 technology. The stick chart consists of two main functional pieces: 1) data selection and preparation; and 2) data presentation and analysis.

[0016]The system 10 can access existing data in the different and distinct databases where it is located and move it into a database based on a selected data model. The data may exist externally on servers or within applications in diverse geographic locations using one of many different database management systems, such as Sequel®, Access® or other data bases, Excel® spreadsheets, MS Project® documents or even project MS...


PUM


Abstract

A powerful visualization aid is provided for technical petroleum engineers and earth scientists who have a need to analyze and quality control large amounts of oil field data quickly. The data used by the system and method comes from a wide variety of databases normally maintained by petroleum company operations, information technology and management personnel as part of their routine resource extraction business. The system and method present the data in a variety of formats and the system can quickly change the output format to enable a user to rapidly switch between various data presentations.

Description

CROSS-REFERENCE TO RELATED APPLICATIONS[0001]This application is a continuation-in-part of U.S. patent application Ser. No. 14 / 146,978, filed on Jan. 3, 2014, which claims priority to U.S. Provisional Application No. 61 / 748,571, filed on Jan. 3, 2013, each of which is hereby incorporated by reference herein in its entirety.BACKGROUND OF THE INVENTION[0002]In the petroleum industry, data related to oil and gas wells is stored in large and complex databases that are difficult to manage. These databases contain a wide variety of data which engineers need to combine in many different ways and view in many different formats. Known tools have not presented this data in a coherent form which allow users to easily process the data and view that data in many different formats. In systems where data can be viewed in different ways or in different formats, the transfer from one viewing mode or from one format to another is very slow and cumbersome.SUMMARY OF INVENTION[0003]The system and metho...

Claims


Application Information

Patent Timeline
Patent Type & Authority Applications(United States)
IPC IPC(8): G06T11/20E21B41/00
CPCE21B41/0092G06T11/206G06T17/05E21B41/00
Inventor IRANI, BARRY K.SCHENCK, DANMAGSTADT, TODRAINS, DAVID
Owner THE INFORMATION STORE
Learn More