Volume rendering for graph renderization

Inactive Publication Date: 2015-01-01
HEWLETT-PACKARD ENTERPRISE DEV LP +1
View PDF5 Cites 5 Cited by
  • Summary
  • Abstract
  • Description
  • Claims
  • Application Information

AI Technical Summary

Benefits of technology

[0006]The present technology may provide data visualization with the capability to substitute elements for groups of clustered data in a graphical interface. When large numbers of data points are to be displayed in an interface, one or more groupings may be identified within the data. A grouping may be two or more data points that exist close together in the two or three dimensional space illustrated in the visualization interface. Typically, a grouping may consist of many more than two data points, but for example may be ten, hundreds, millions, or more data points. Once the groupings are identified and created, an element representing each grouping may be displayed in the visualization interface along with data points not associated with a grouping. A user may select a grouping to see additional information about the grouping, such as a zoomed-in view of the data points making up the grouping. Similarly, a user may select a portion of the data points that make up a grouping to display the element and zoom out for a broader view of the data.
[0007]An embodiment may perform a method for displaying data. A two or three dimensional image of data within a graphical po

Problems solved by technology

For this much data, typical graphical techniques do not provide a mechanism for understanding the data patterns and relationships in an uncluttered manner
Viewing two or three dimensional data sets associated with big data applications

Method used


Image

  • Volume rendering for graph renderization
  • Volume rendering for graph renderization
  • Volume rendering for graph renderization

Examples


Example

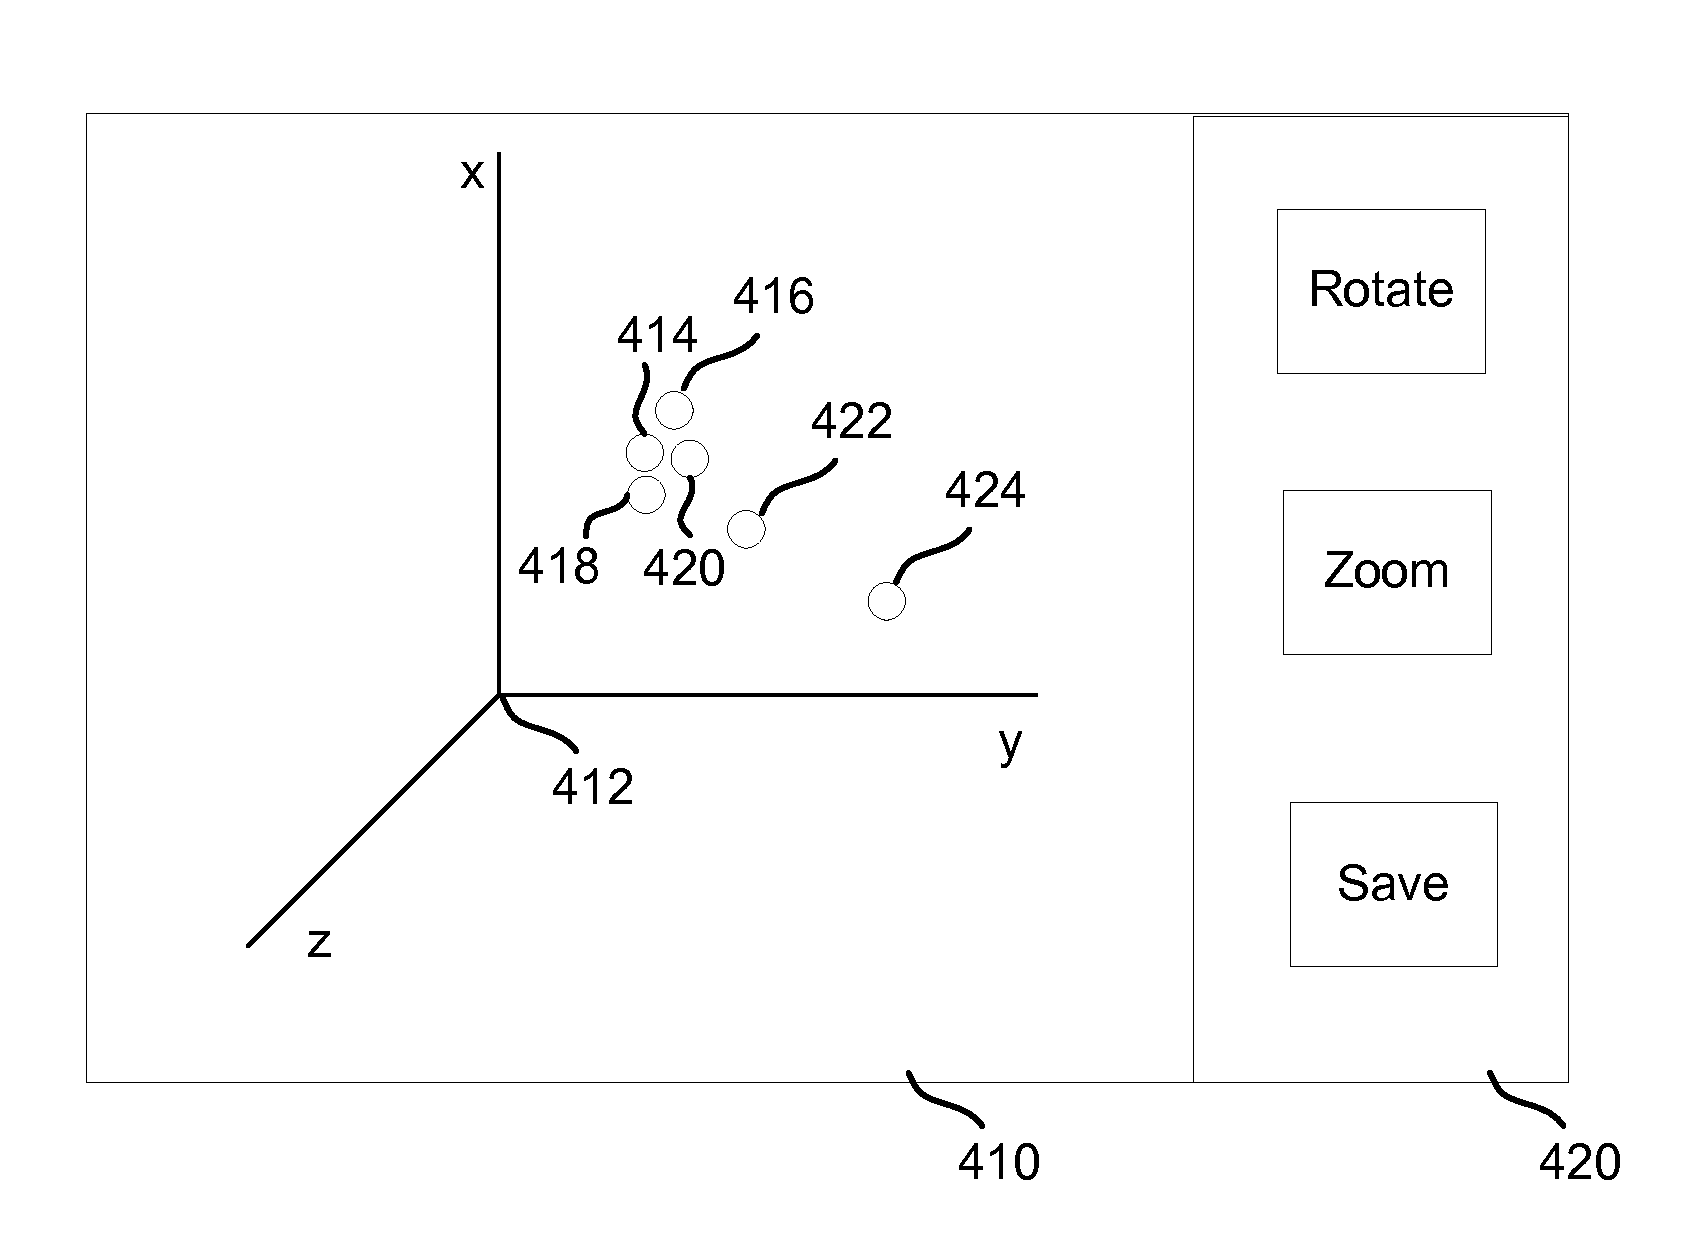
[0017]A visualization of data is provided with the capability to interactively select the orientation of one or more axis used to display data. Data to be visualized is accessed by a data visualization application. The data may be structured or unstructured, filtered and analyzed. The accessed data may be displayed through an interface of the visualization application for a user. The coordinate system for displaying the data may also be displayed.

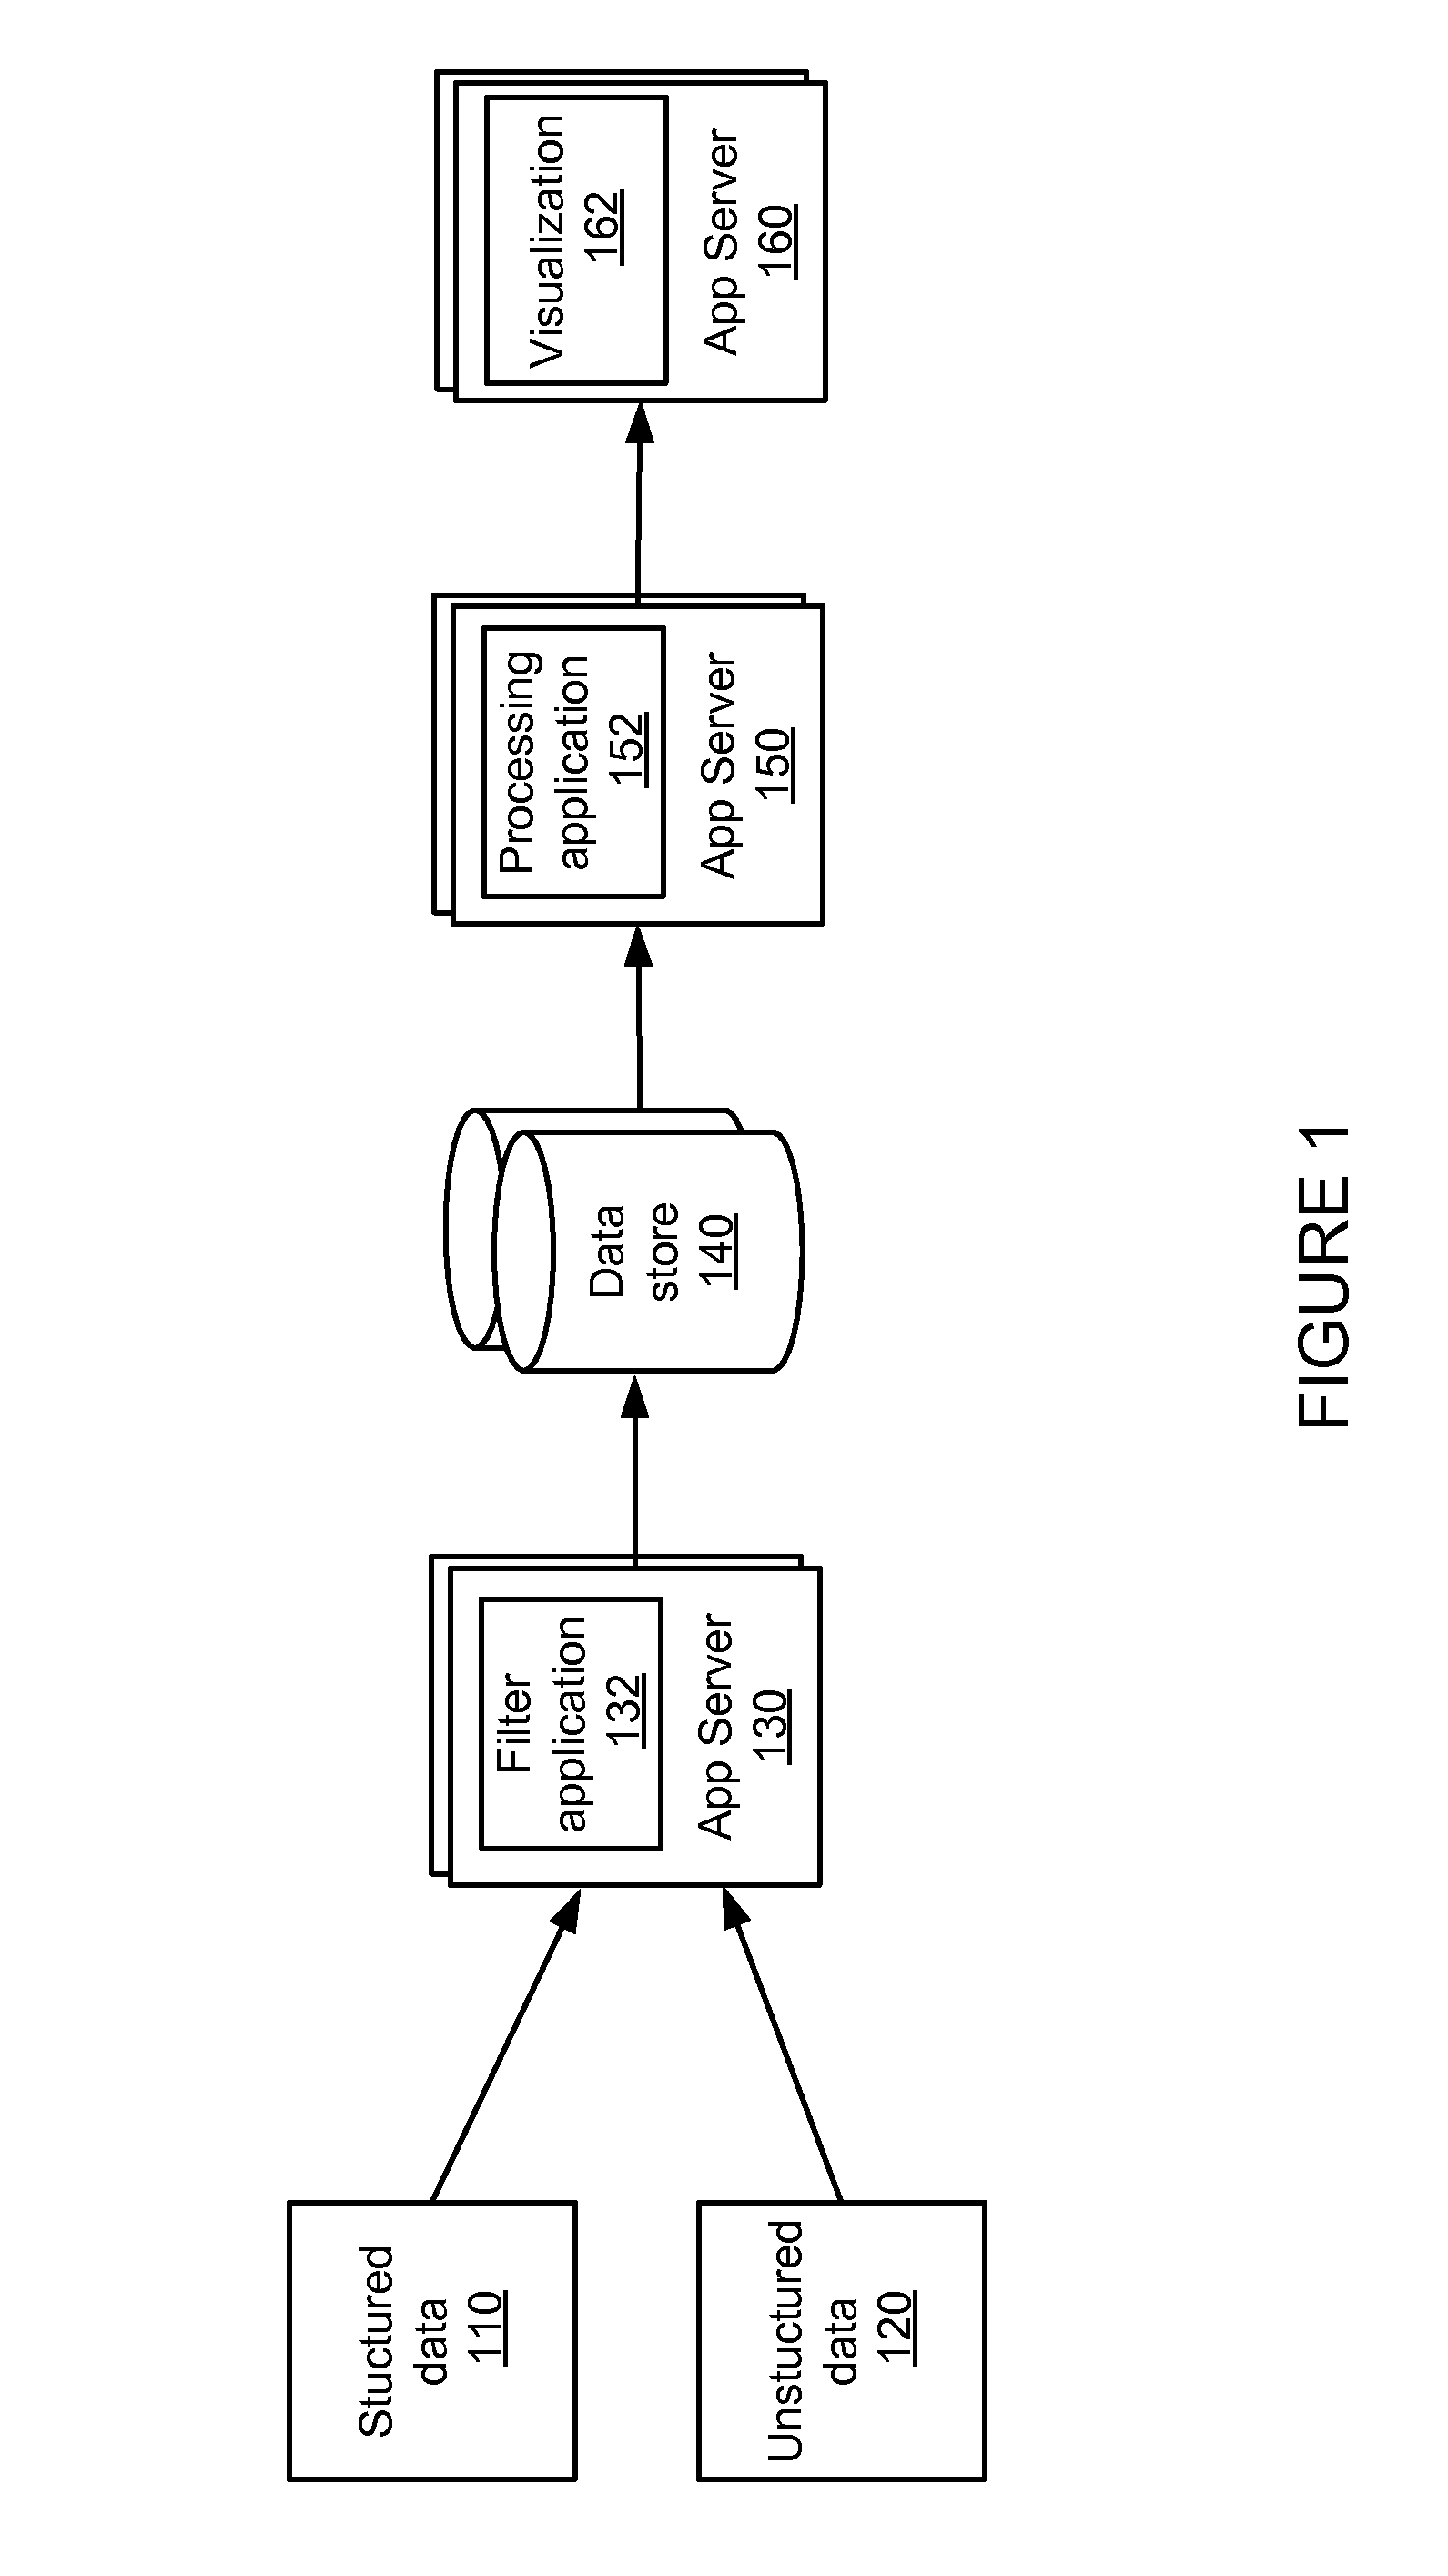
[0018]FIG. 1 is a system for processing and visualizing data. The system of FIG. 1 includes structured data 110, unstructured data 120, application servers 130, 150 and 160, and data store 140.

[0019]Structured data 110 (RDMS data) may include data items stored in tables. The structured data may be stored in a relational database, and may be formally described and organized according to a relational model. Structured data 110 may be data which can be managed using a relational database management system and may be accessed by application ser...


PUM


Abstract

Data visualization is provided with the capability to substitute elements for groups of clustered data in a graphical interface. When large numbers of data points are to be displayed in an interface, one or more groupings of data existing close together in coordinate space may be identified within the data. Once the groupings are identified and created, an element representing each grouping may be displayed in the visualization interface along with data points not associated with a grouping. A user may select a grouping to see additional information about the grouping, such as a zoomed-in view of the data points making up the grouping. Similarly, a user may select a portion of the data points that make up a grouping to display the element and zoom out for a broader view of the data.

Description

BACKGROUND[0001]1. Field of the Invention[0002]The present invention relates to visualization of data. In particular, the present invention relates to visualization of two or three dimensional data using volume rendering.[0003]2. Description of the Prior Art[0004]Visualization of data in two or three dimensional graphs can be helpful to understand complicated and large amounts of data. For big data type applications, the number of data points can be in the exabyte range. For this much data, typical graphical techniques do not provide a mechanism for understanding the data patterns and relationships in an uncluttered manner[0005]Viewing two or three dimensional data sets associated with big data applications is not practical in typical graphical formats. When large numbers of data points are displayed in a visualization interface, the data can appear cluttered and the information normally relayed by the graphical presentation is not useable. What is needed is an improved visualizatio...

Claims


Application Information

Patent Timeline
IPC IPC(8): G06F3/0481G06F3/0484
CPCG06F3/04845G06F3/04815G06F2203/04806G06Q10/10G06T11/206G06F16/248
Inventor HANSEN, MARC, DAVID
Owner HEWLETT-PACKARD ENTERPRISE DEV LP
Why Eureka
Try Eureka