Prediction device, prediction method, and computer readable medium

a prediction device and computer-readable medium technology, applied in forecasting, instruments, data processing applications, etc., can solve the problems of insufficient method, insufficient precision of prediction when selecting an item using the two-sided method, and difficulty in predicting items used for analysis, so as to increase the contribution to the effect and increase the prediction precision

Inactive Publication Date: 2015-06-18
YANMAR CO LTD
View PDF0 Cites 5 Cited by
  • Summary
  • Abstract
  • Description
  • Claims
  • Application Information

AI Technical Summary

Benefits of technology

[0065]Here, the above formulas 1 and 2 are equations for calculating the proportionality constant β and the SN ratio η (duplicate ratio) for item 1. The operation means carries out the same calculation on items 2 through k as on item 1. FIG. 2 is a table illustrating an example of the proportionality constant β and the SN ratio η (duplicate ratio) for each item used in the Taguchi-method. In FIG. 2 the proportionality constant β and the SN ratio η (duplicate ratio) for each item that has been calculated by applying the above describe formulas 1 and 2 to each item are shown in a table form.
[0066]Next, the proportionality constant β and the SN ratio η (duplicate ratio) for each item are used in order for the operation means to calculate an estimated value of the output for each item of each member. The estimated value of the output for item 1 can be shown in Formula 3 in the following for the ith member. Likewise, the operation means calculates the estimated values of the output for items 2 through k.
[0068]As a result, the operation means can derive a comprehensive estimation equation (Formula 4) as a predictive formula showing the relationship between the data on an item and the comprehensive estimated value of a signal value. Here, the comprehensive estimation equation using all of the items (1 through k) does not necessarily have the highest precision of prediction for the signal values of the object to be predicted. Therefore, the operation means selects an appropriate combination of items from among all of the items in order to increase the contribution to the effects on the object to be predicted and to increase the precision of the prediction.
[0069]Thus, the operation means calculates the comprehensive estimated value using the SN ratios η1, η2, . . . , ηk (duplicate ratio) that indicate the precision of the estimations concerning the estimated value for each item as weighted coefficients. Accordingly, the comprehensive estimated value of the ith member can be represented in Formula 4 in the following.
[0070]a comprehensive estimated value
[0082]In addition, in the prediction method according to the present embodiment, the time difference model is applied to the signal value and the data for each item as method for selecting an item and furthermore, the operation means calculates the SN ratio of the comprehensive estimated value and selects the item that makes the SN ratio of the comprehensive estimated value maximum on the basis of the corresponding data for each item and the signal value after the conversion process taking the nonlinearity into consideration. FIG. 8 is a graph conceptually showing the process for determining the optimal number of items to be selected. First, the SN ratio of the comprehensive estimated value for each item is calculated as in Formulas 1 to 5 for the signal value and the data for each item on which a linear conversion process has been carried out by using the time difference model. Thus, as described for FIGS. 4 and 5, the operation means calculates the factorial effect value for each item from the SN ratio of the comprehensive estimated value. As shown in FIG. 8, the operation means first sets the minimal value of the factorial effect value for each item as the initial threshold value. The operation means select an item of which the factorial effect value is the threshold value or greater and calculates the SN ratio of the comprehensive estimated value for the signal value (for example, each of 1 through n). In the case the threshold value is the initial value, all of the items are selected. Next, the operation means set the value gained by adding a predetermined value to the threshold value as the next threshold value and selects an item of which the factorial effect value is the threshold value or greater in the same manner so as to calculate the SN ratio of the comprehensive estimated value for the signal value. When the operation means repeats this process until the threshold value reaches the maximum value of the factorial effect value or greater, that is to say reaches the lateral line indicated as MAX in FIG. 8, it is possible to calculate the SN ratio of the comprehensive estimated value for the data for a plurality of selected items for each the numbers of items. Here, the operation means may set the initial value of the threshold value to the maximum value MAX or greater, and thus, may calculate the SN ratio of the comprehensive estimated value by selecting items of which factorial effect value are each threshold value or greater when the threshold value is made smaller by a predetermined value repeatedly.

Problems solved by technology

In the case of an analysis using the Taguchi-method from among various types of chronological methods, how an item used for analysis is selected has been a problem.
However, the inventor found that the precision of the prediction when an item is selected using the two-sided Taguchi-method was insufficient and examined a method for selecting an item wherein the estimated comprehensive SN ratio becomes the maximum.

Method used


Image

  • Prediction device, prediction method, and computer readable medium
  • Prediction device, prediction method, and computer readable medium
  • Prediction device, prediction method, and computer readable medium

Examples


second embodiment

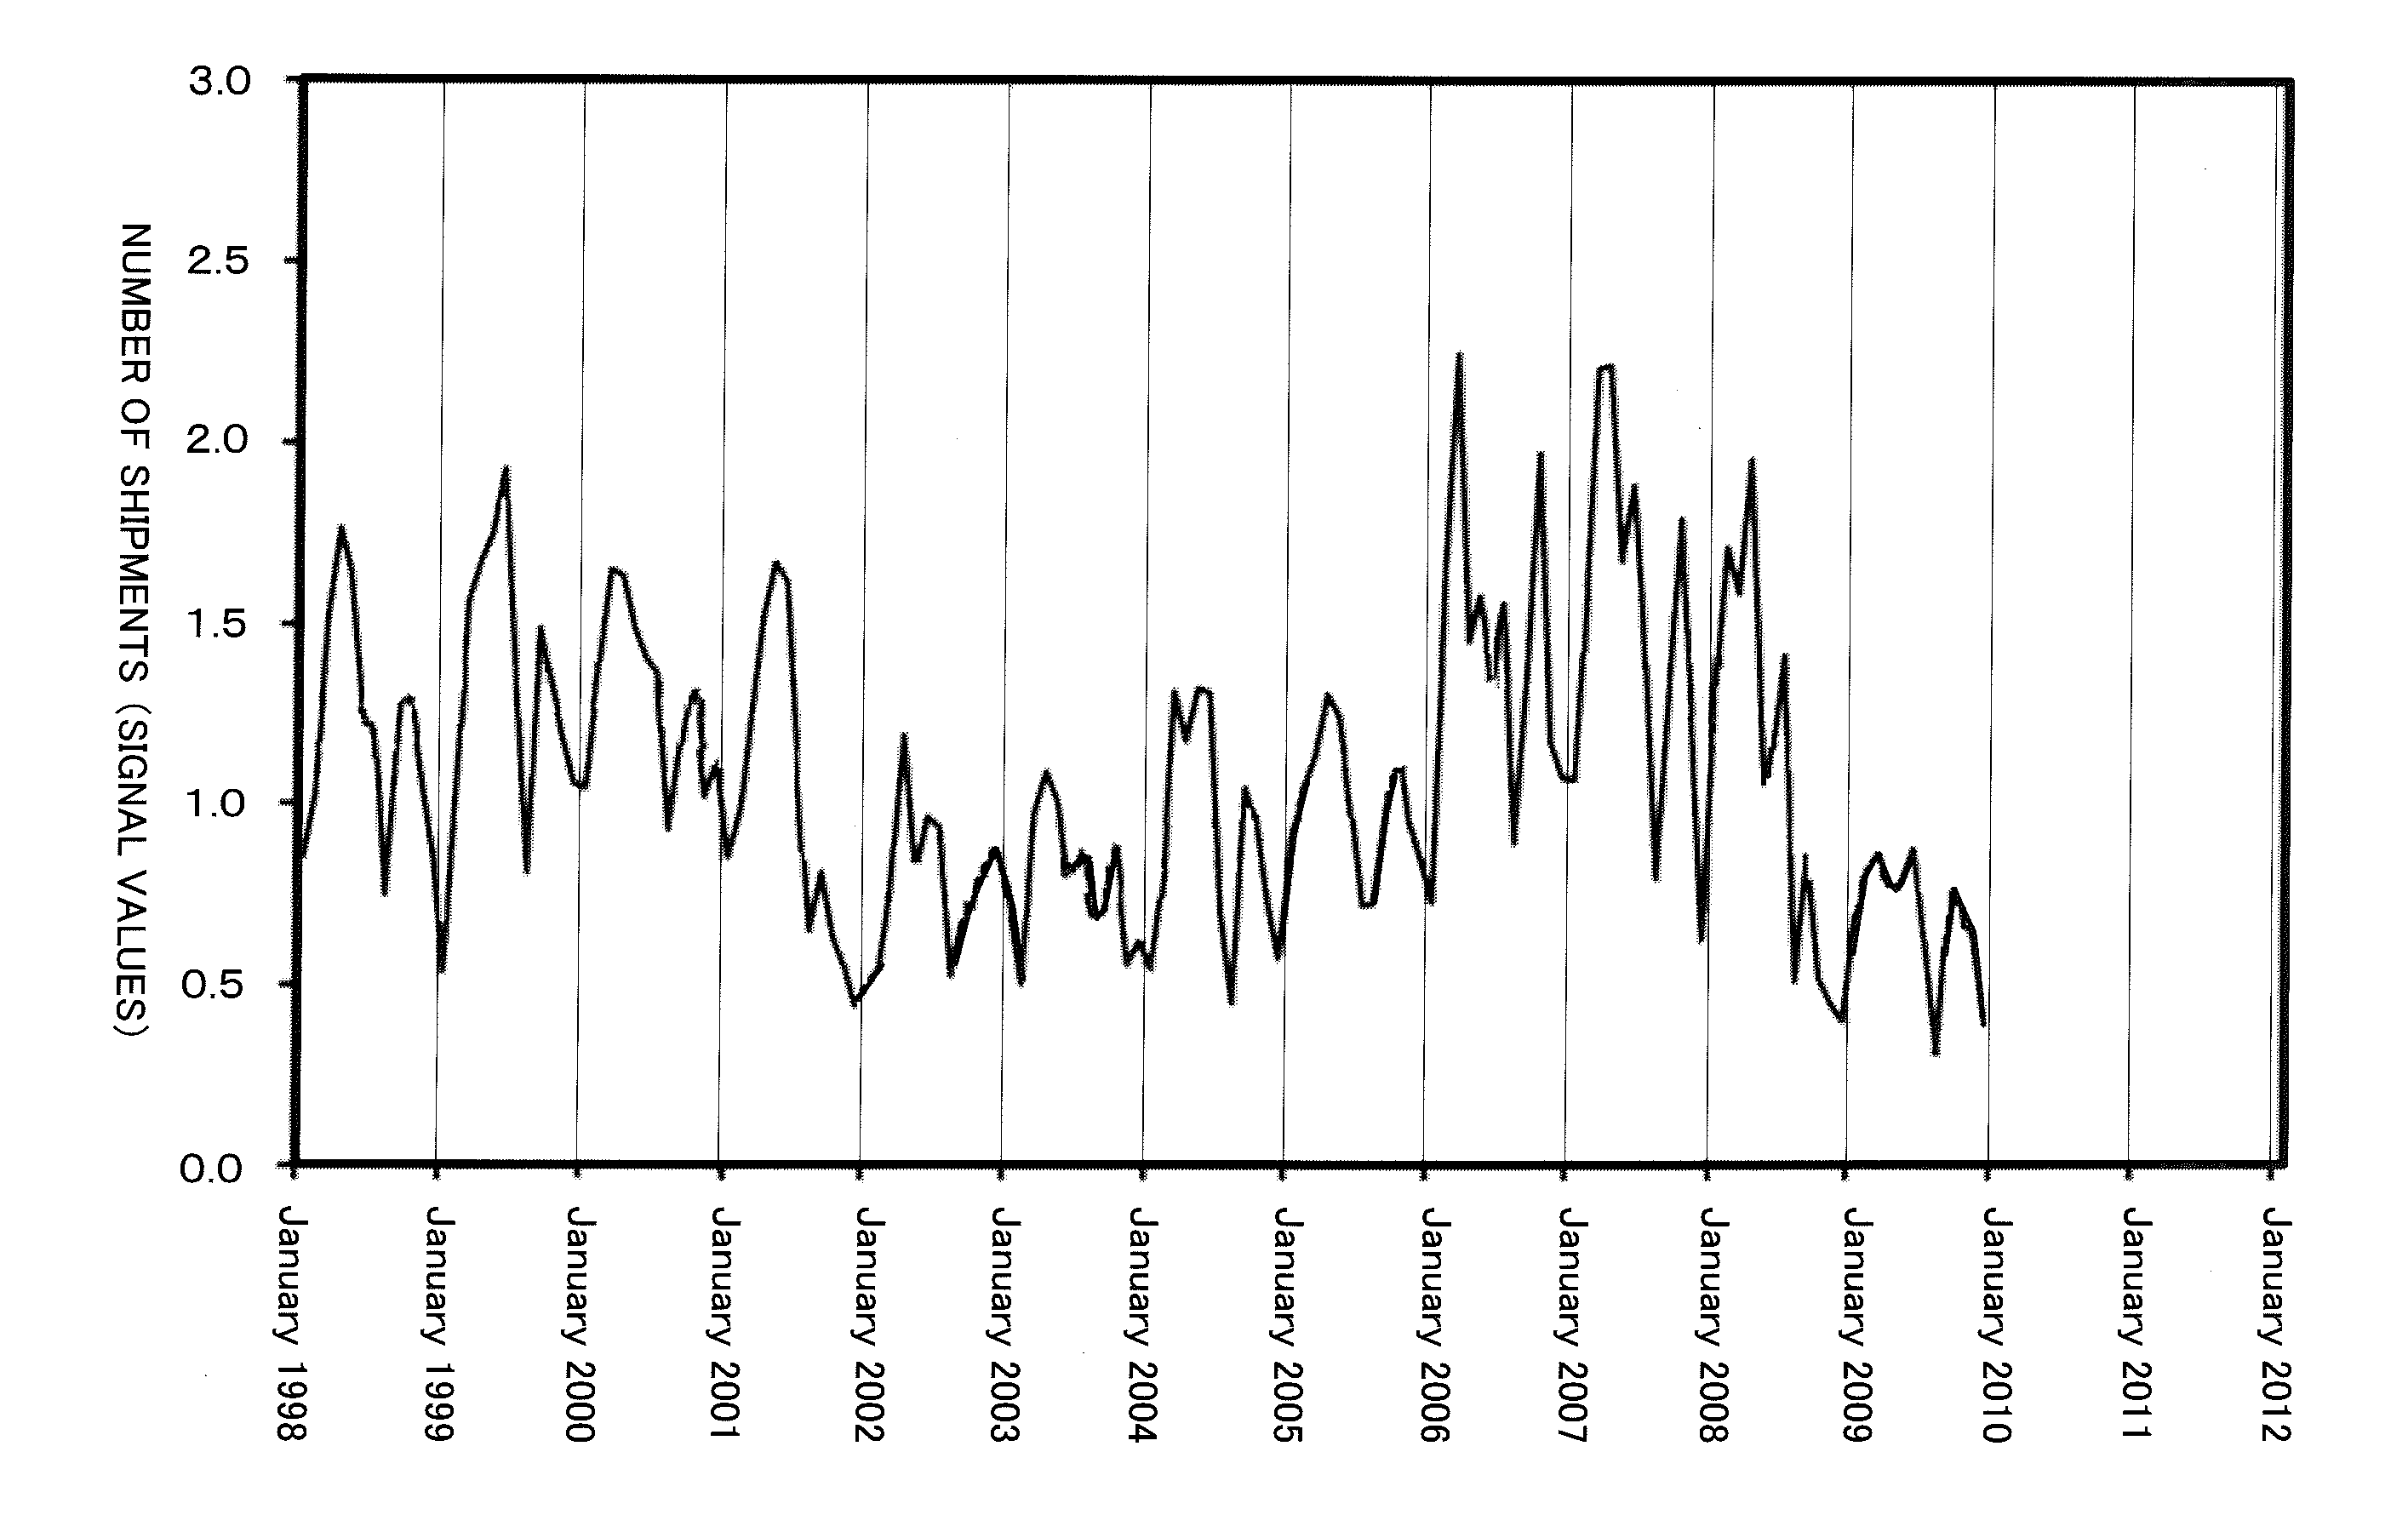
[0136]In the second embodiment, the period having the properties, of which the appearance is close to that of the properties of the trend of the signal value during the same period as of the data for the items that correspond to the signal value in the period to be predicted, is specified so that prediction is carried out from the relationship between the item data in the specified period and the signal value after a predetermined period in the configuration, which is described below.

[0137]Here, the structure of the prediction device according to the second embodiment is the same as that of the prediction device 1 in the first embodiment, and therefore, the structure thereof is not described here.

[0138]The prediction device 1 in the second embodiment predicts the signal value in the period to be predicted following the respective steps shown in the flow chart in FIG. 11. In the second embodiment, the process for selecting a signal period in step S104 in FIG. 11 is carried out in acc...


PUM


Abstract

Provided are a prediction device, a prediction method, and a computer program, related to prediction method using Taguchi-method, and which reflect, in addition to a time difference model, trends, in changes over time, thus further improving prediction accuracy. For example, the prediction device selects, from signal values stored in a time series and data for each item, a period based on the MD of the data for each item and the trend of the MD, namely a signal period in which the data for each item is similar, and carries out a prediction using Taguchi-method on the signal values and data for each item in the selected period.

Description

[0001]This application is the national phase under 35 U.S.C.§371 of PCT International Application No. PCT / JP2013 / 067386 which has an International filing date of Jun. 25, 2013 and designated the United States of America.BACKGROUND OF THE INVENTION[0002]1. Field of the Invention[0003]The present invention relates to a method for analyzing an object to be predicted that varies chronologically as well as a plurality of items regarding the object to be predicted and, in particular, to a prediction device, a prediction method, and a computer readable medium storing a computer program for allowing a computer to function as a prediction device wherein the precision of the predictive results can be improved.[0004]2. Description of Related Art[0005]Economic prediction such as the prediction of the demand for products and the prediction of amount of sales are extremely important in order to investigate management direction and company strategy. In addition, how the predicted demand is connect...

Claims


Application Information

Patent Timeline
Patent Type & Authority Applications(United States)
IPC IPC(8): G06Q30/02
CPCG06Q30/0202G06Q10/04G06Q50/08
Inventor NAGAKURA, KATSUHIKO
Owner YANMAR CO LTD
Why Eureka
Try Eureka