Methods and Systems for Lowering Blood Pressure Through Reduction of Ventricle Filling
a technology of ventricle filling and blood pressure reduction, which is applied in the field of treating hypertension through controlling cardiac filling, can solve the problems of life-threatening conditions such as stroke, heart attack, congestive heart failure, etc., and achieve the effects of reducing blood pressure, reducing blood pressure, and reducing blood pressur
- Summary
- Abstract
- Description
- Claims
- Application Information
AI Technical Summary
Benefits of technology
Problems solved by technology
Method used
Image
Examples
example 1
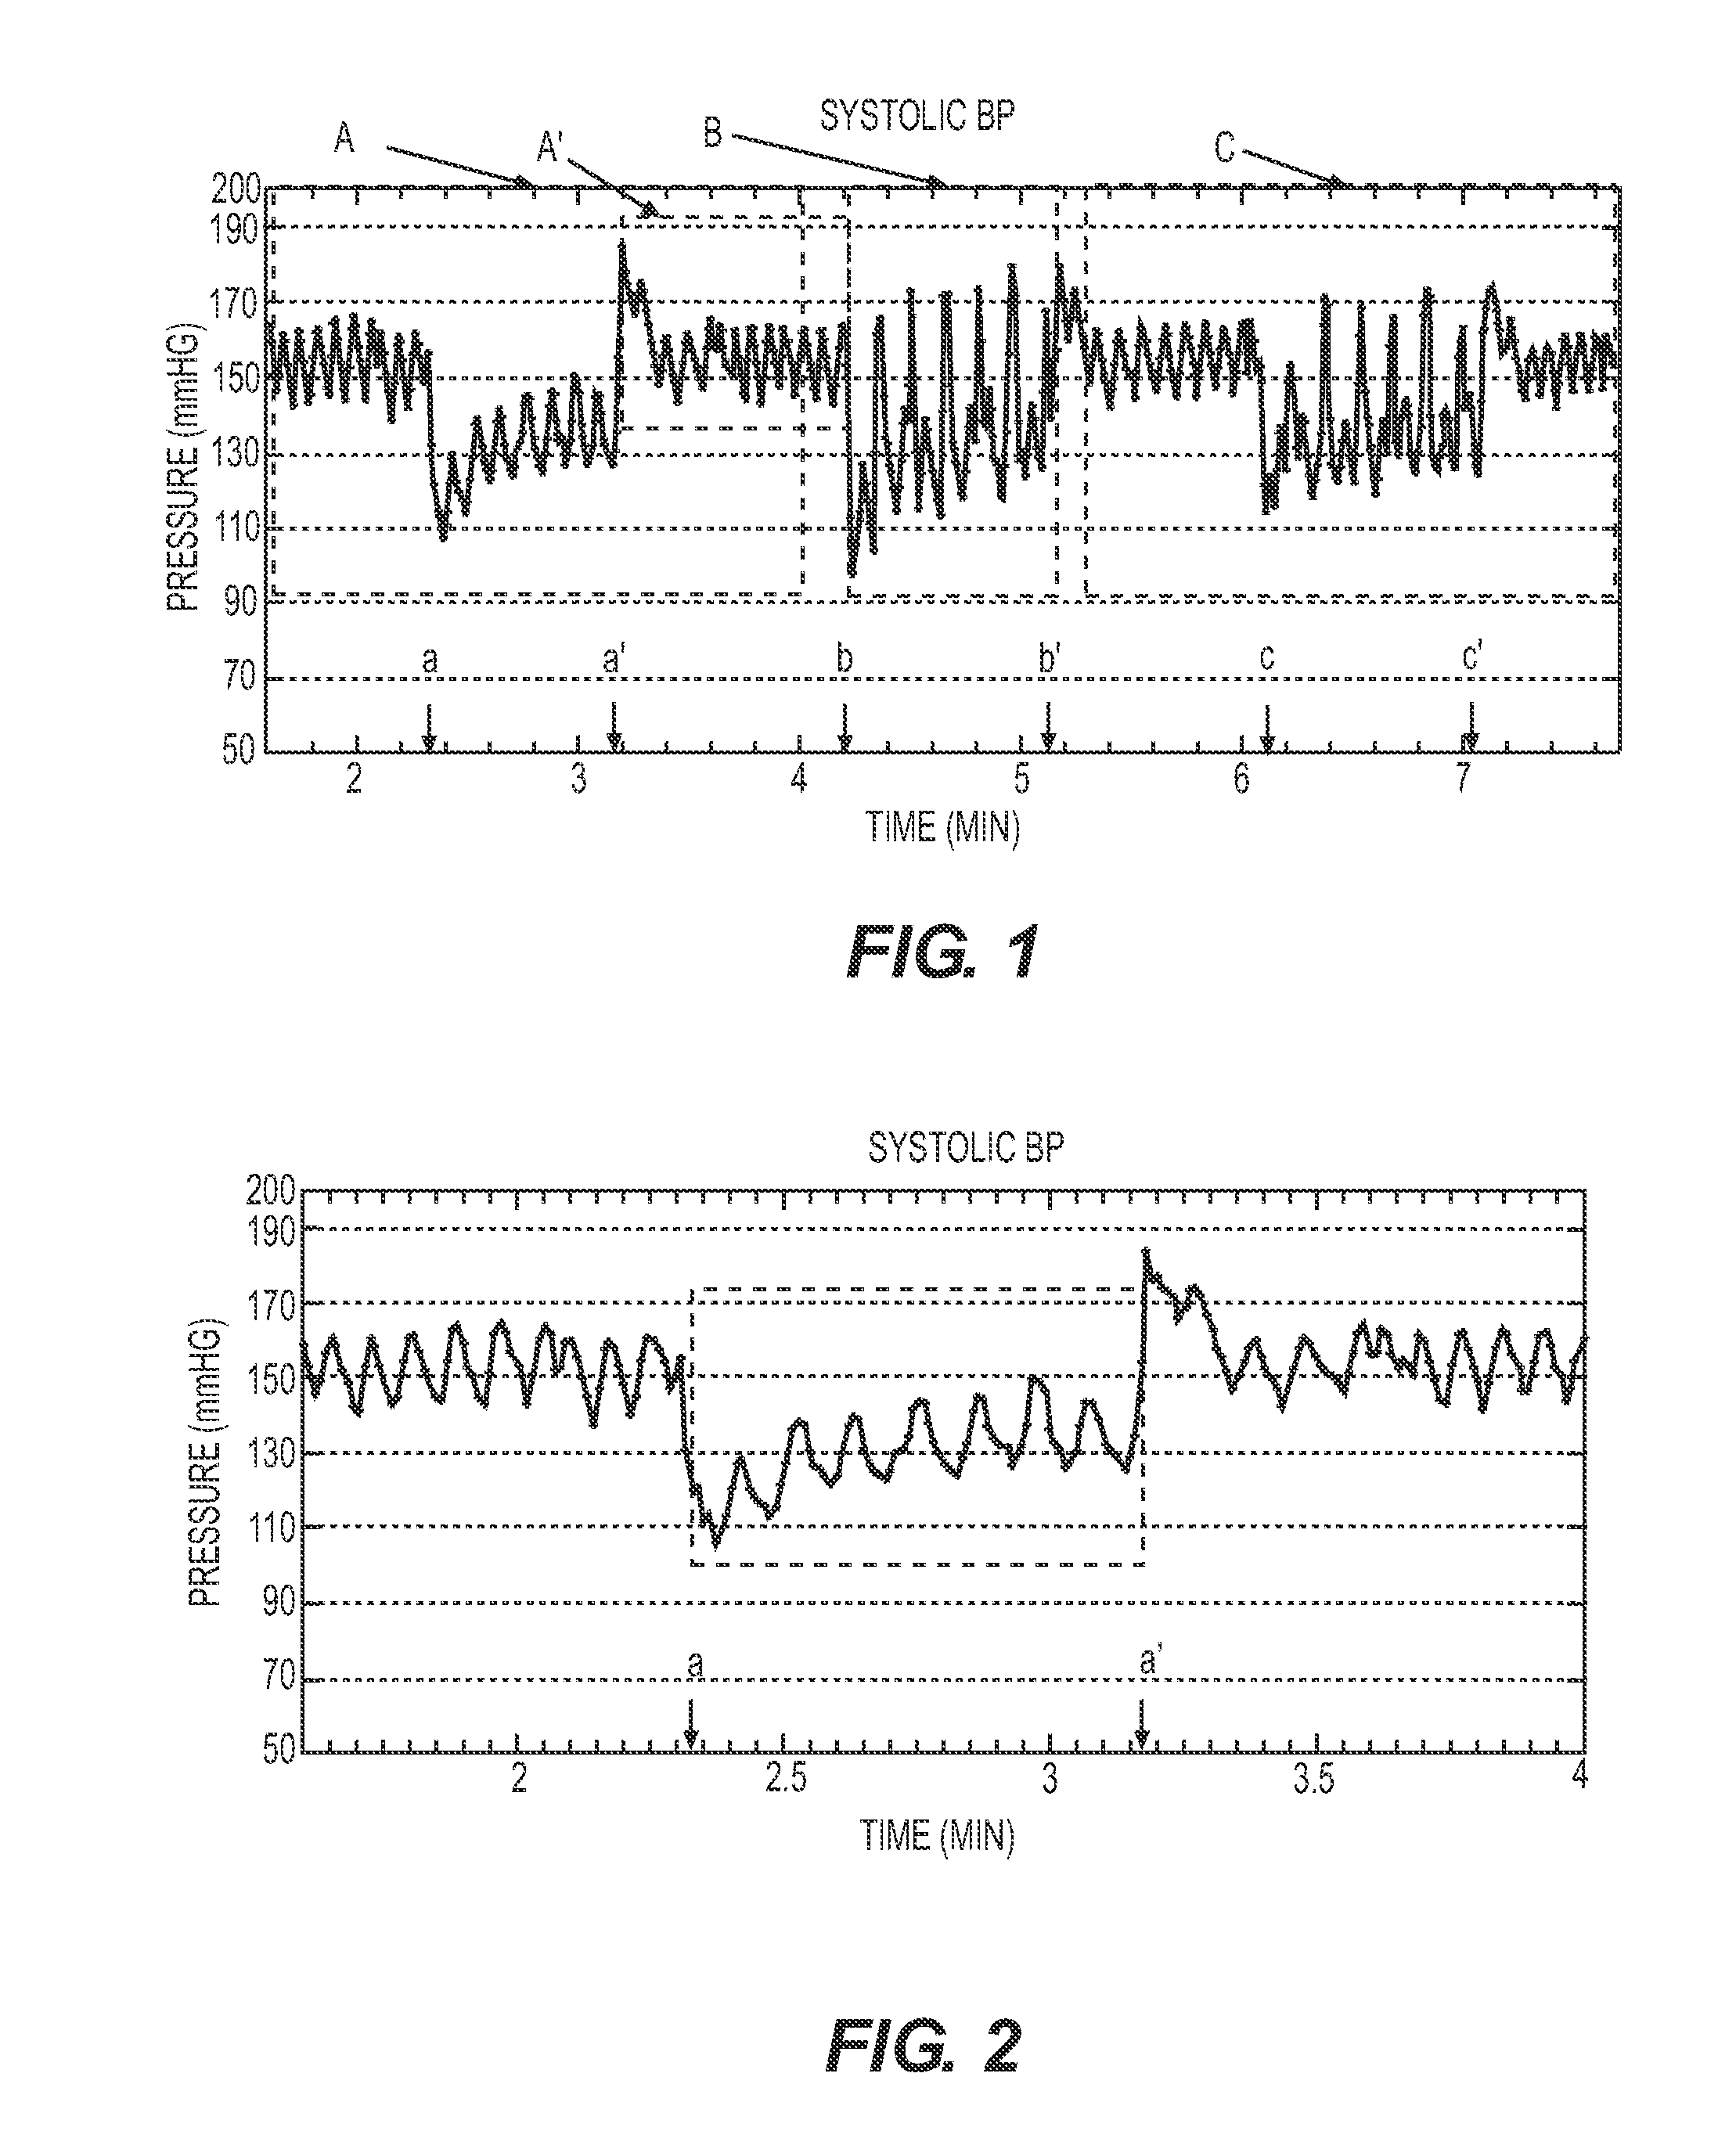
[0135]In FIG. 1, the systolic blood pressure of a hypertensive patient receiving a stimulation signal is plotted against time. The crosses along the plotted line depict the peak systolic blood pressure for every heartbeat. During approximately the first 2 plotted minutes, no stimulation signal was delivered. As seen, the patient's initial blood pressure was on average more than 150 mmHg. The oscillations in blood pressure (about ±10 mmHg) are attributed to the breathing cycle, as known in the art.
[0136]Then, a first stimulation pattern was applied during time interval a-a′, a second stimulation pattern was applied during time interval b-b′, and a third stimulation pattern was applied during time interval c-c′. In between the stimulation patterns and after the third stimulation pattern, the heart was not stimulated.
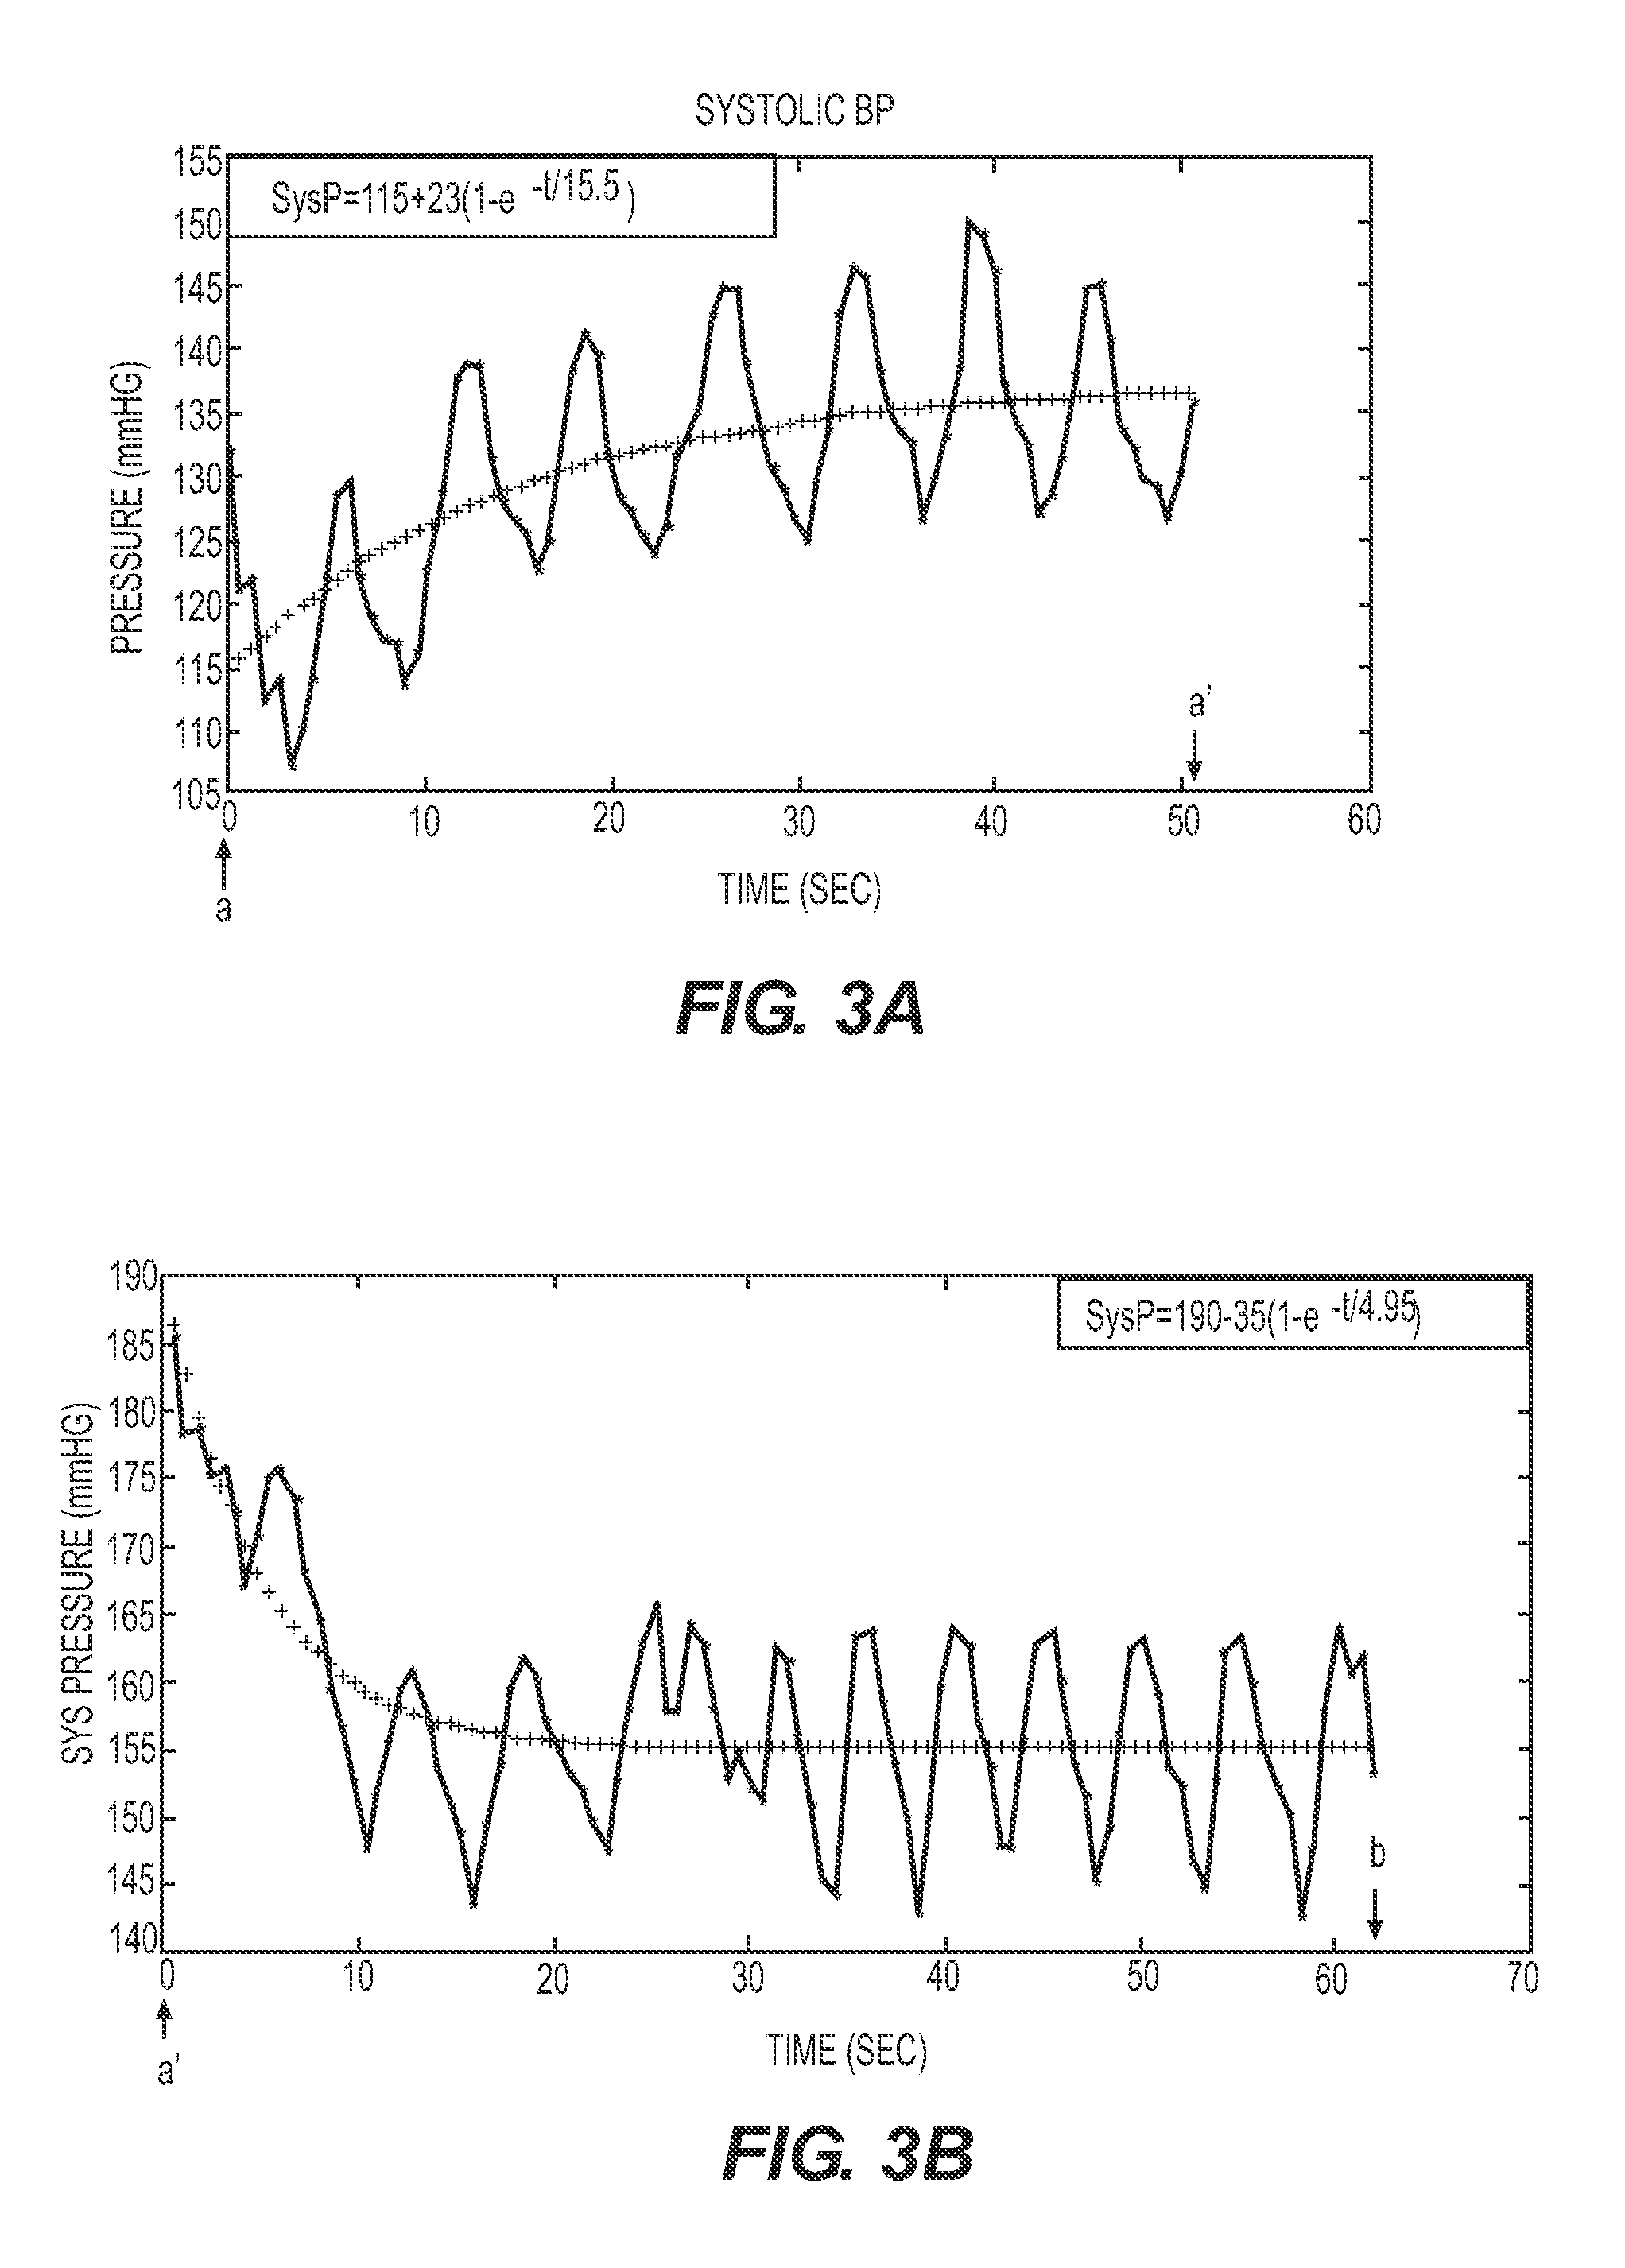
[0137]Attention is now drawn to FIG. 2, depicting an enlarged portion of FIG. 1 marked by dashed rectangle A. During the time marked by the dashed rectangle in FIG. 2, whi...
example 2
[0153]In yet another example, shown in FIG. 7, a hypertensive patient's heart was stimulated with a stimulation pattern having a sequence of 12 BPR pulses delivered at an AV delay of 2 ms, followed by 3 BPR pulses, each with a 40 ms AV delay. Stimulation commenced at point t1 and ended at point t2. In this example, there was no measured adaptation response and the fitting curve was in fact linear and had a fixed average reduced blood pressure of about 112 mmHg, which is about 31 mmHg lower than the blood pressure immediately before and after the time interval t1-t2.
[0154]As apparent from the different stimulation patterns shown in Examples 1 and 2, a stimulation pattern comprising at least one BPR stimulation can be set to at least approach one or more targets. For example, in some embodiments, a stimulation pattern may be set to cause an initial reduction in blood pressure (systolic and / or diastolic) that will exceed a predetermined threshold or will be within a predetermined range...
example 3
[0212]Example 3 is depicted in FIGS. 10A and 10B. FIGS. 10A and 10B depict a healthy anesthetized canine heart, showing an electrocardiogram (ECG), left ventricle pressure (LVP) and arterial (blood) pressure (AP) traced over a period of time. In FIG. 10A, before point 101, the heart was allowed to beat naturally, and the ECG, LVP, and AP were traced. At point 101, ventricular pacing commenced. The ventricle was paced 2 ms after the onset of atrial excitation. This pacing caused an immediate change in the ECG, which was concomitant with a reduction of both LVP and AP. The pacing continued at a 2 ms time interval between the onset of atrial contractions and the onset of ventricular pacing until point 103 in FIG. 10B, where pacing ceased. As seen, immediately upon cessation of pacing, the ECG, LVP, and BP all returned essentially to the same values as before pacing.
PUM
 Abstract
Description
Claims
Application Information
 - R&D
- Intellectual Property
- Life Sciences
- Materials
- Tech Scout
- Unparalleled Data Quality
- Higher Quality Content
- 60% Fewer Hallucinations
Browse by: Latest US Patents, China's latest patents, Technical Efficacy Thesaurus, Application Domain, Technology Topic, Popular Technical Reports.
© 2025 PatSnap. All rights reserved.Legal|Privacy policy|Modern Slavery Act Transparency Statement|Sitemap|About US| Contact US: help@patsnap.com


