Computer-Implemented Method For Portfolio Construction And Indexation Of Securities Under A Noisy Market Hypothesis

a technology of noisy market hypothesis and portfolio construction, applied in the field of cross-sectional analysis, can solve the problems of stock market rationality or efficiency, investment returns, unnecessary volatility, etc., and achieve the effect of high accuracy and predictabl

Inactive Publication Date: 2015-08-06
JOHANSSON PETER J
View PDF0 Cites 10 Cited by
  • Summary
  • Abstract
  • Description
  • Claims
  • Application Information

AI Technical Summary

Benefits of technology

[0036]Still further what is desired then is a highly accurate and predictable system and method for determining the value of stock investments.
[0037]It is further desired to provide a system and method that adjusts a fair value of stocks in a population in order to yield a current annual compounding rate of return on investment comparable to the stock in the population having the highest current annual compounding rate of return on investment.

Problems solved by technology

However, stock markets are not always rational or efficient.
As a result, market cap-weighted indexes that rely on stock price as the only indicator of fair value, by design can become overweighed in overvalued stocks and underweighted in undervalued stocks, exposing investors to a sub-optimal portfolio.
The disadvantages of market capitalization weighting passive indexes, which can be substantial, center on the fact that any undervalued securities are underweighted in the index and related portfolios, while any overvalued securities are overweighted.
This creates unnecessary volatility, which is not in the interests of most investors.
It may also lead to investment returns that have had to absorb the phenomenon of having to repeatedly increase weightings in shares after they have risen and reduce weightings in them after they have fallen.
Unfortunately, cap-weighted indexes suffer from an inherent flaw as they overweight all overvalued stocks and underweight all undervalued stocks.
This causes cap-weighted indexes to underperform relative to indexes that are immune to this shortcoming.
In addition, cap-weighted indexes are vulnerable to speculative bubbles and emotional bear markets which may unnaturally drive up or down stock prices respectively.
One significant problem with equal-weighted indexes is that they come out of the same cap-weighted universes as cap-weighted indexes.
High turnover and associated high costs are additional problems of equal-weighted indexes.
These small illiquid stocks must be traded as often as the larger stocks but at a higher cost because they are less liquid.
These temporary shocks referred to as “noise” can obscure the true value of securities and may result in mispricing of these securities for many years.
However, fundamentally weighted indexes also comes with shortcomings since they fails to effectively capture fundamental growth and risk factors arguably inherited in a cross section of risky assets such as stocks.
Consequently, fundamentally-weighted indexes underweights growth companies and overweight companies with high intrinsic (idiosyncratic) volatility risk which provides for a sub-optimal portfolio.

Method used


Image

  • Computer-Implemented Method For Portfolio Construction And Indexation Of Securities Under A Noisy Market Hypothesis
  • Computer-Implemented Method For Portfolio Construction And Indexation Of Securities Under A Noisy Market Hypothesis
  • Computer-Implemented Method For Portfolio Construction And Indexation Of Securities Under A Noisy Market Hypothesis

Examples


example embodiments i

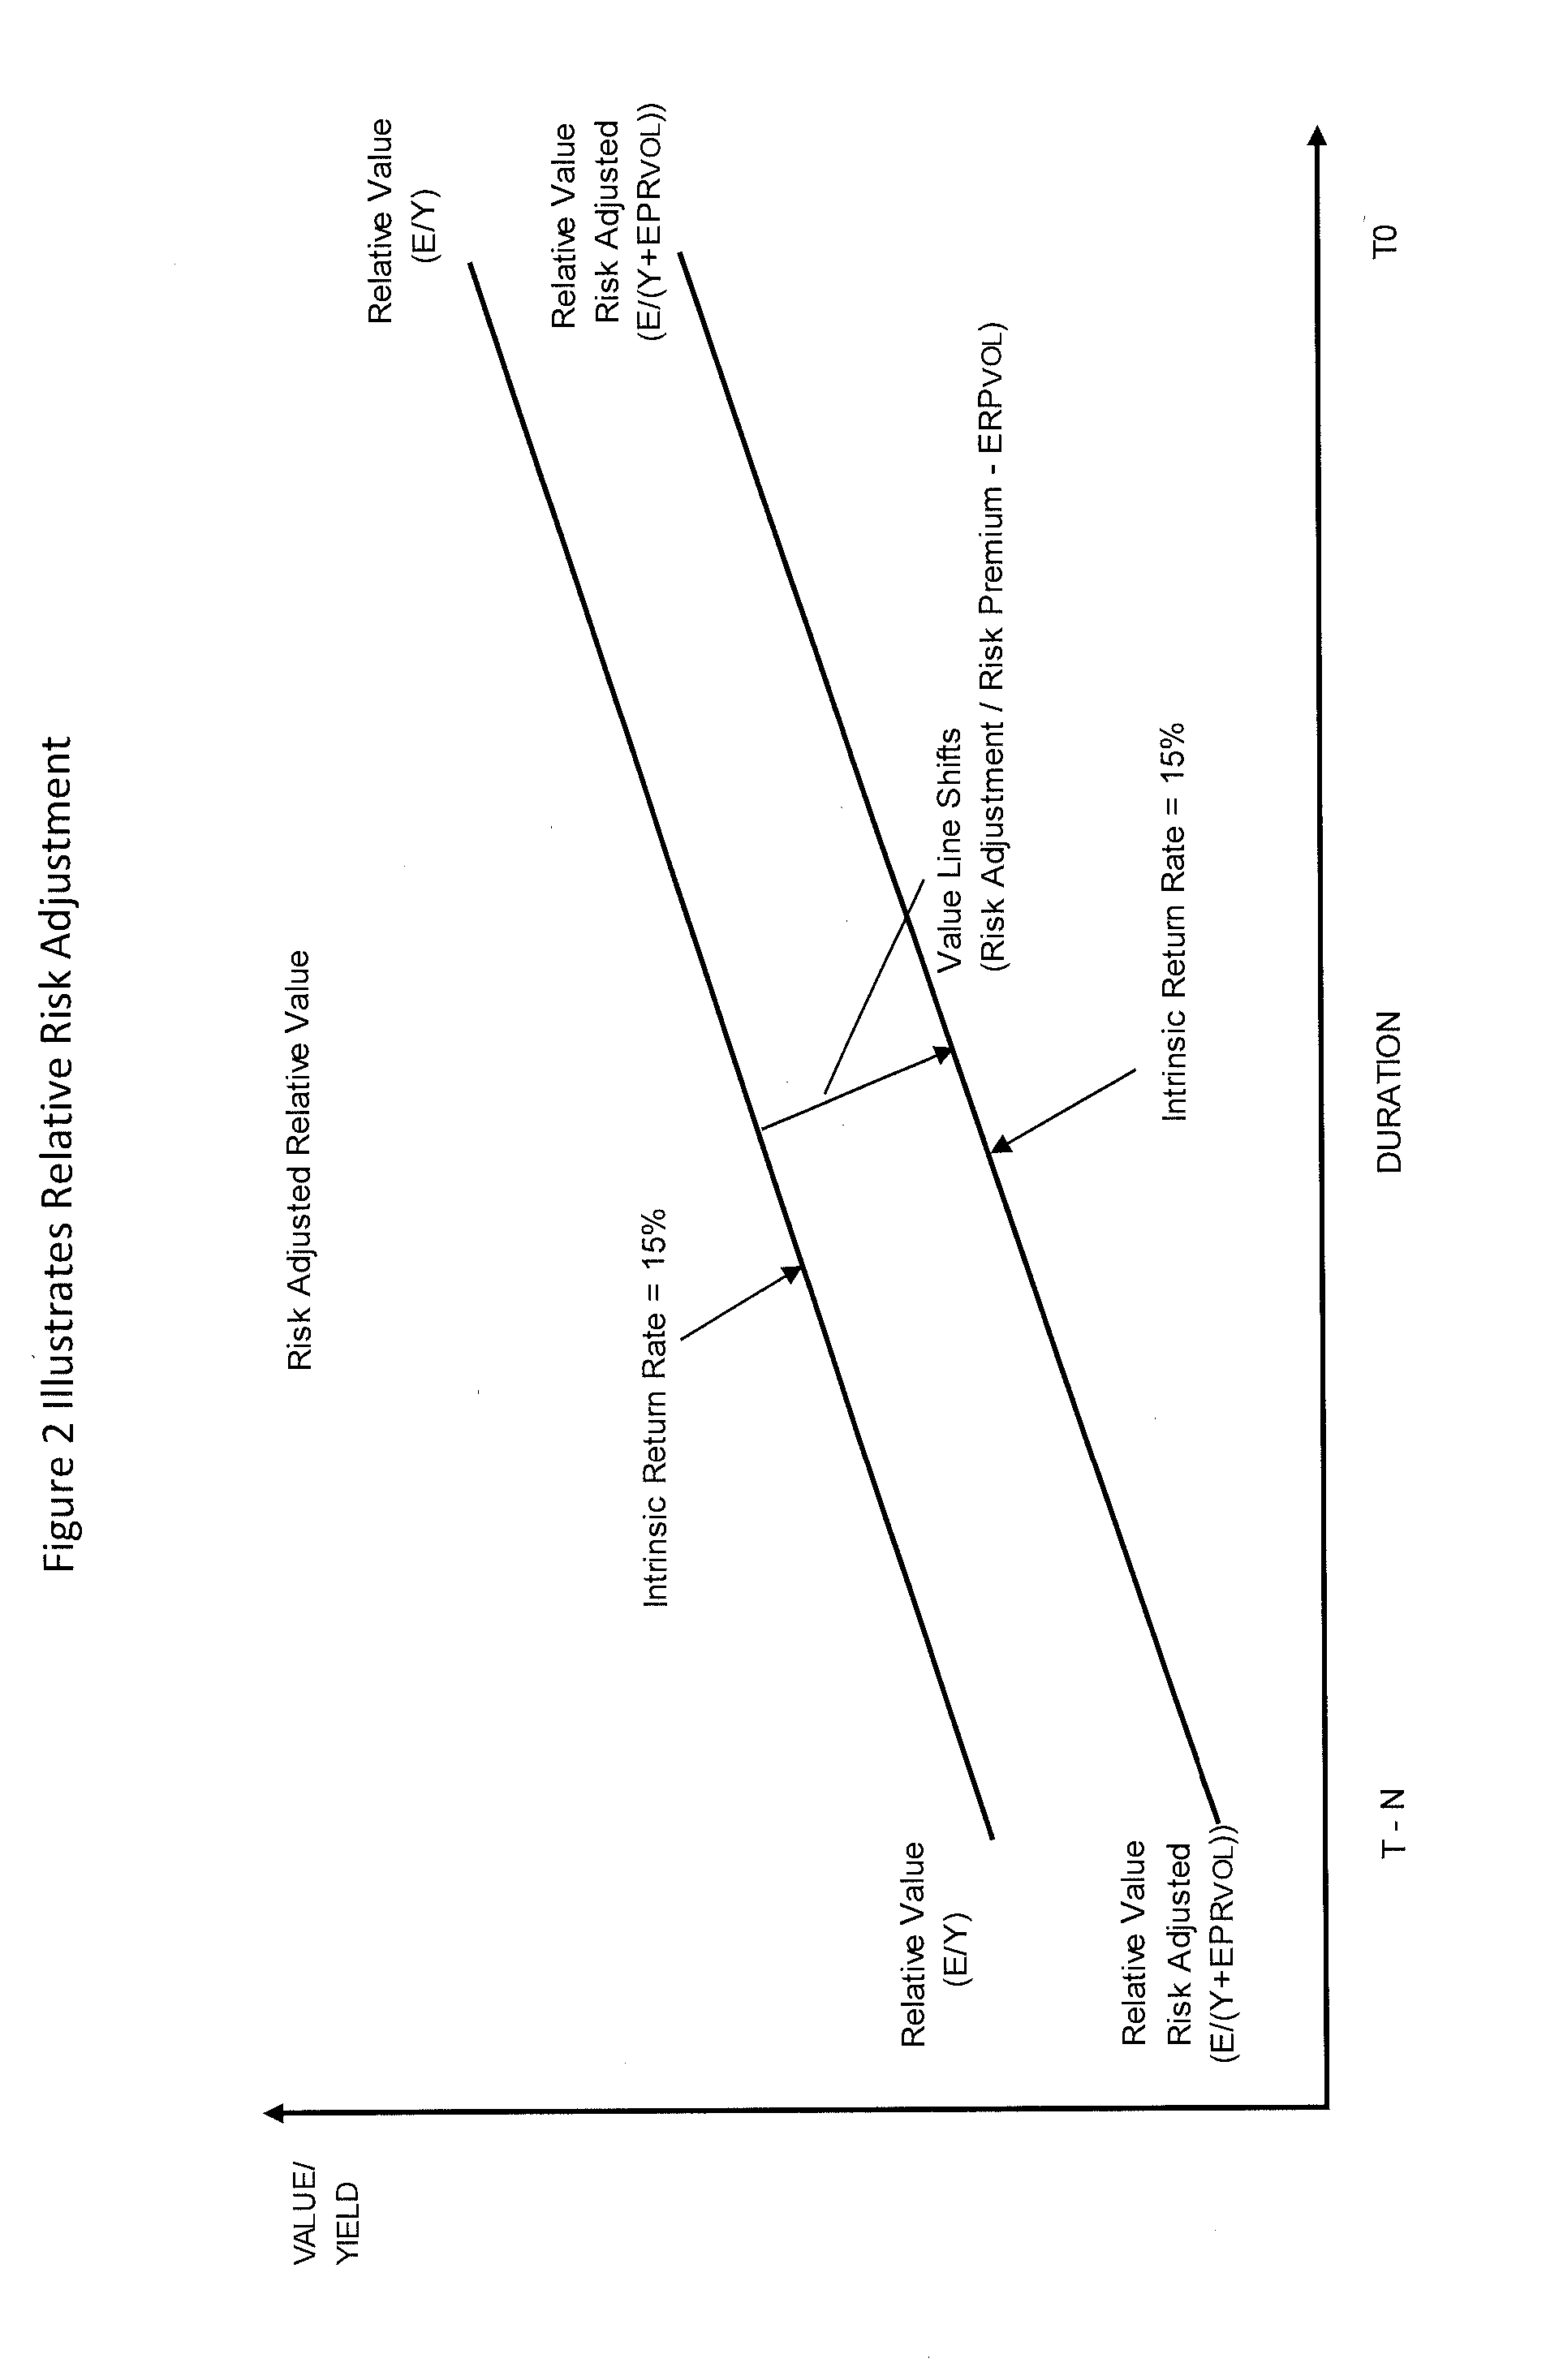
[0113]A risky assets (stocks) cash-flow is set in “volatility risk equilibrium” with a risk free assets cash flow (bond) when relative volatility risk has been considered and eliminated through a risk adjustment. In other words, a risk premium is added to the risk free rate to compensate for inconsistency (deviation or volatility) risk carried by the risky asset. This can be formulized as, ERAYRFA+ERPVOL), where E represents a risky assets (RA) earnings and Y represents the yield for a risk free asset (RFA) and where EPRVOL represents the risk premium based on earnings volatility risk.

[0114]A risky asset (stock) is fair valued when the risky assets risk adjusted relative value to a risk free asset (bond) is in equilibrium with the risky assets (stocks) market value.

[0115]Equilibrium can be formulated as ERA / (YB+ERPVOL)=P, where ERA is the risky assets (stock) earnings and YB represents the yield for a risk free asset, and where ERPVOL represents the risk premium based on demonstrate...

example embodiments ii

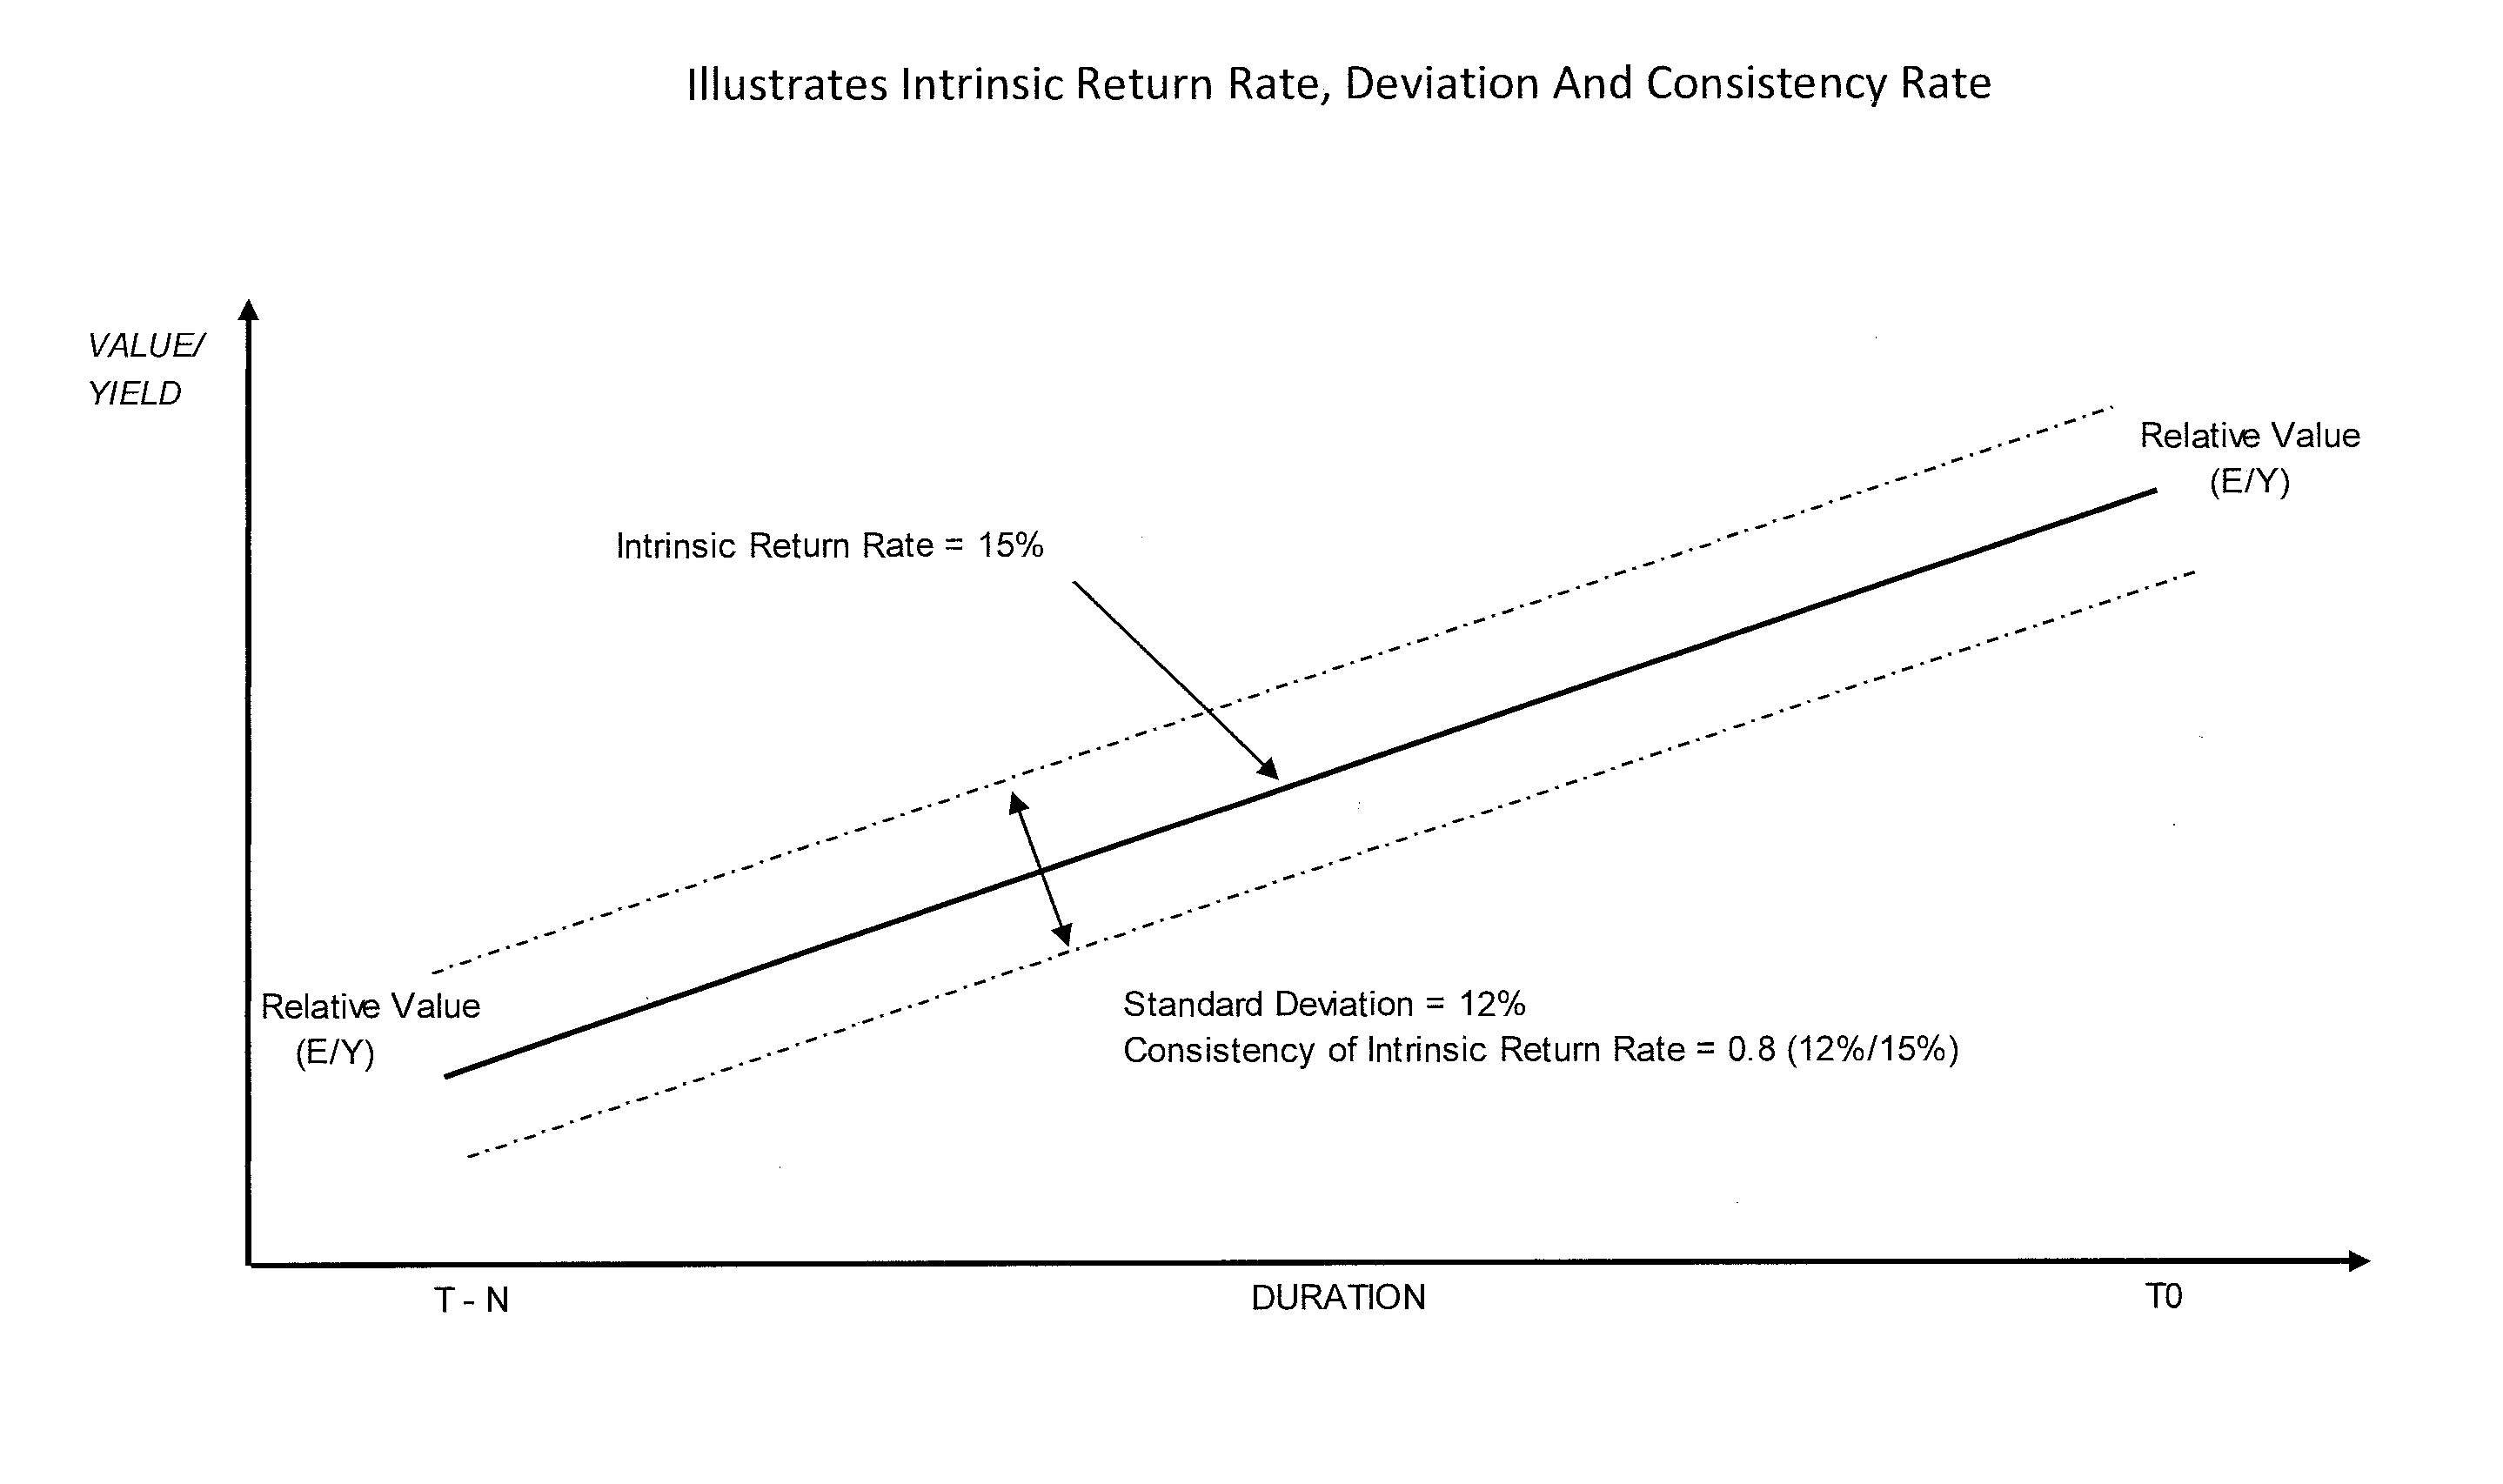
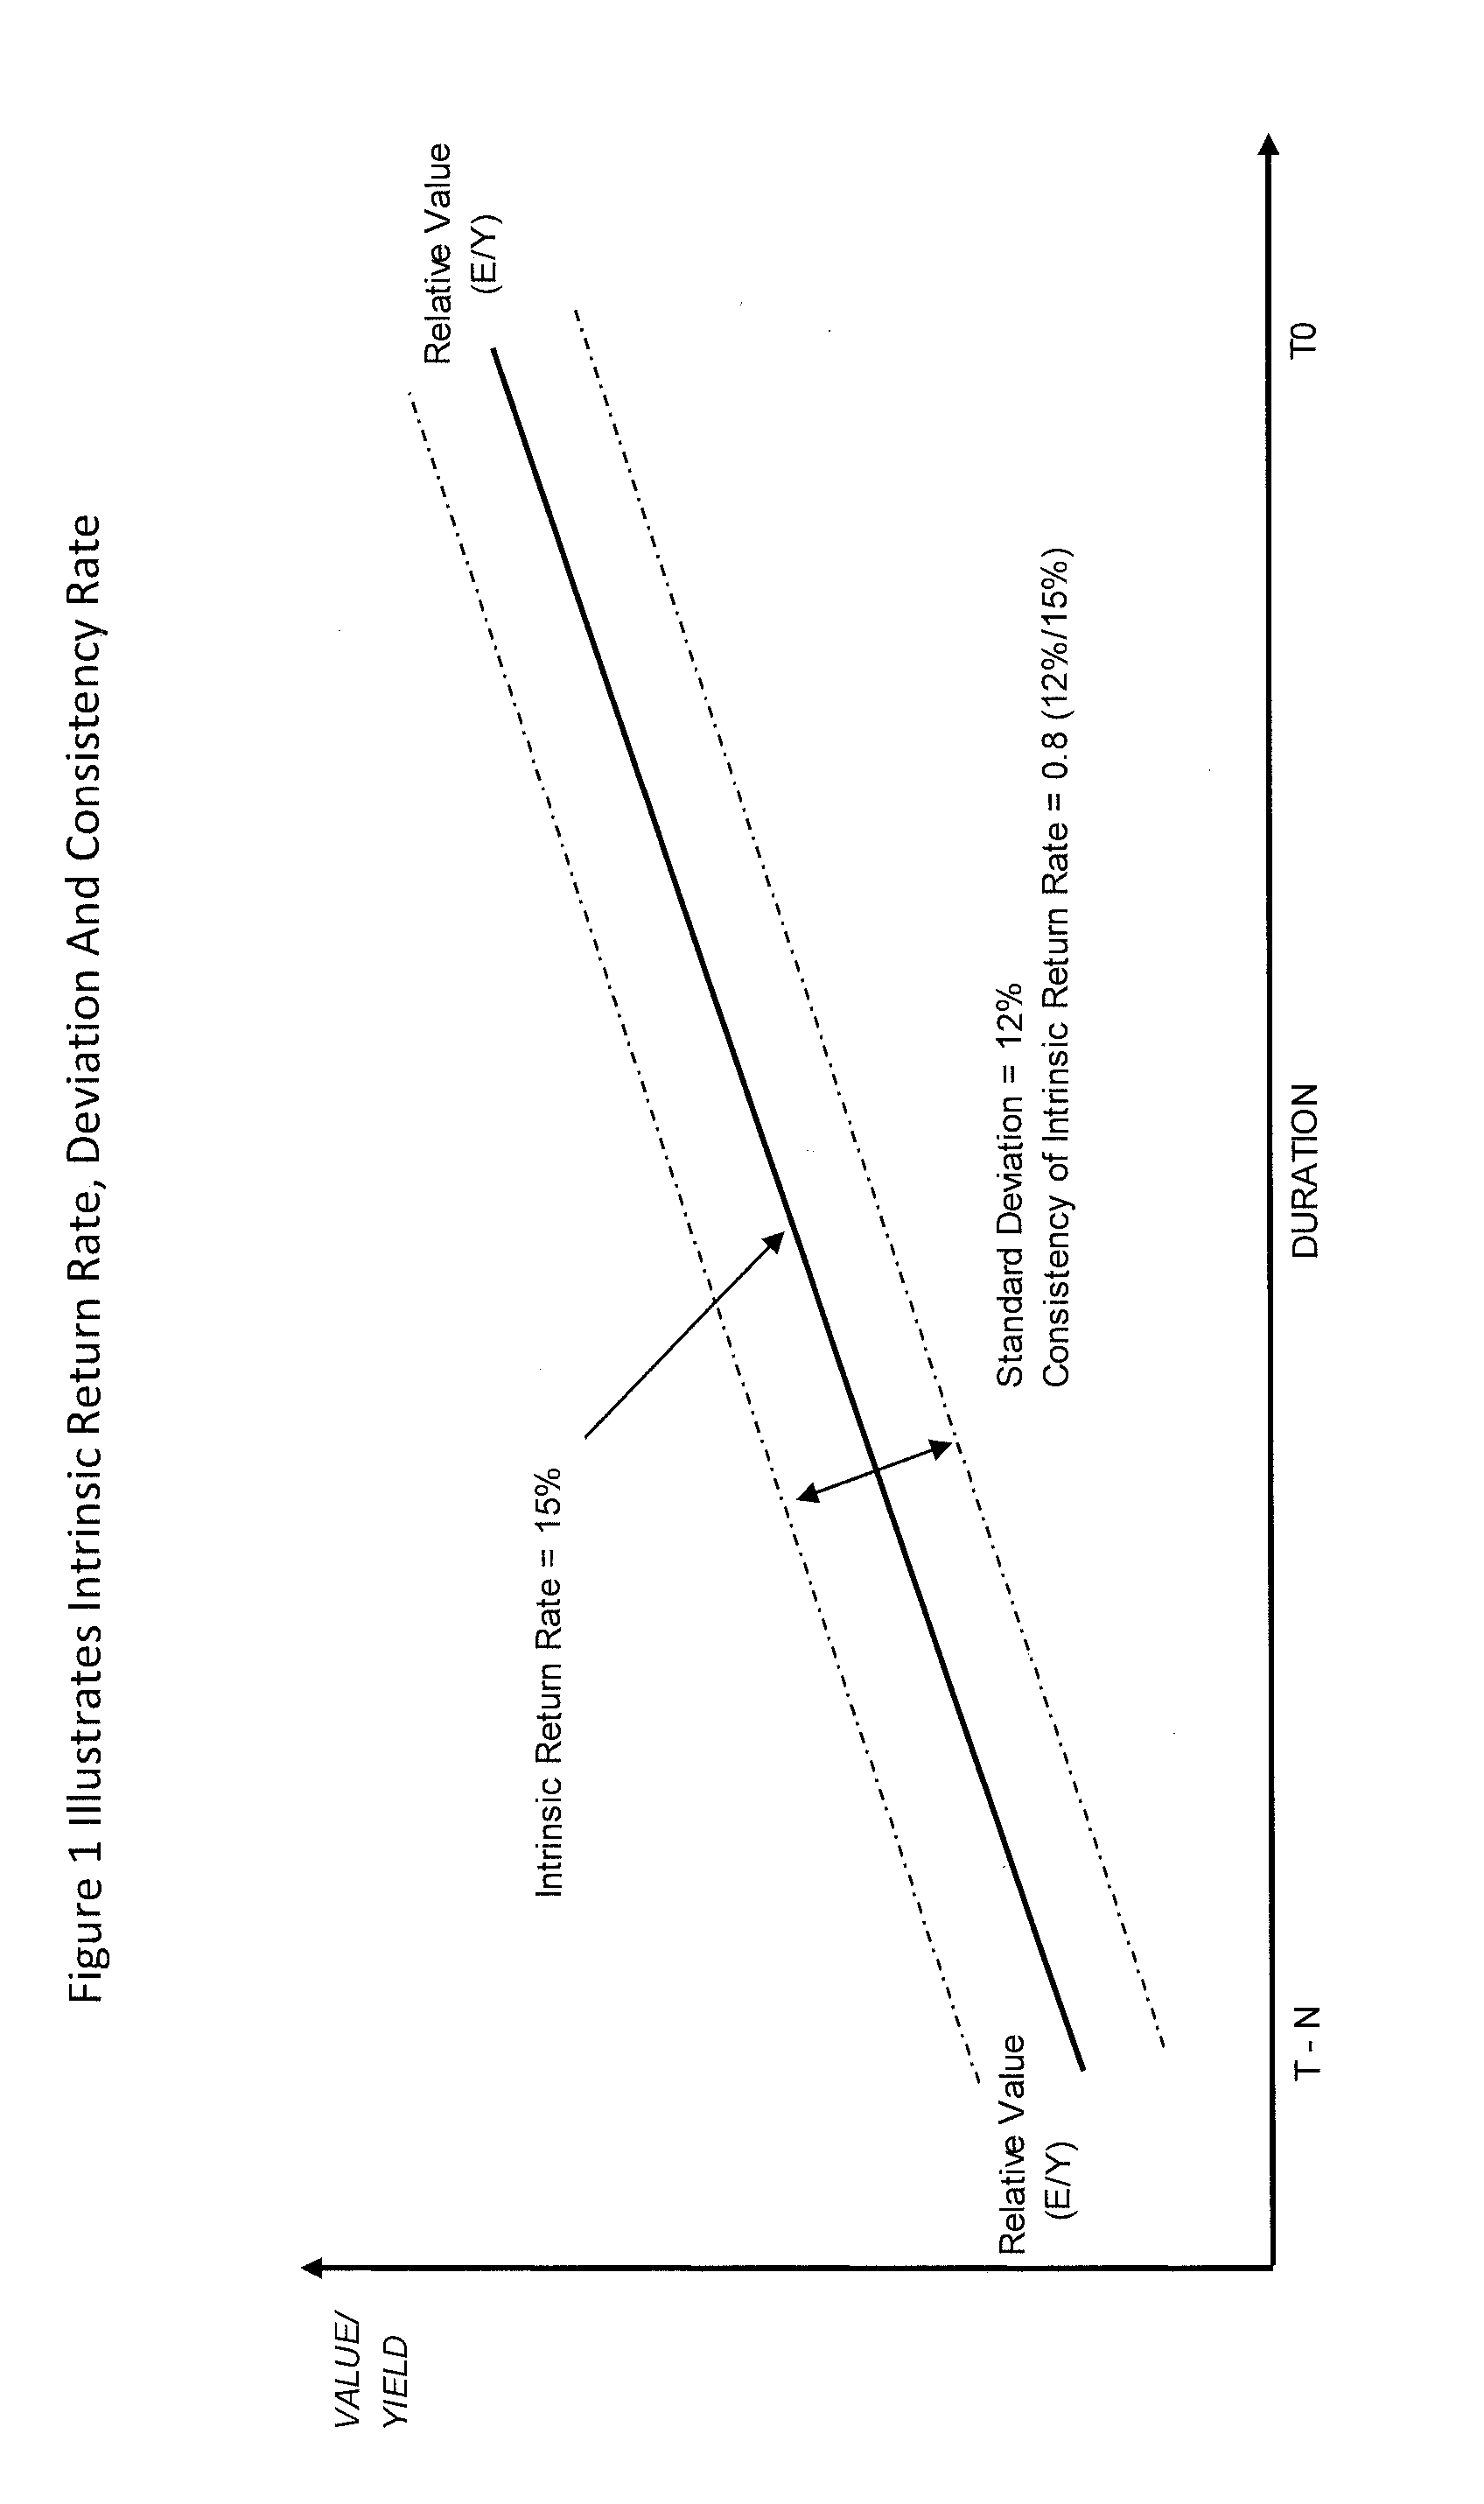
[0161]Provided herein is a system and method for determining profitability on stock investments. The method is generally described in an advantageous embodiment as provided below and further illustrated in FIGS. 1-3 and 5-8 while the system is generally illustrated and detailed in FIGS. 9-12.

[0162]The method may include four steps: 1) determining the fair value of a particular stock; 2) determining the annual compounding intrinsic return of the company; 3) determining the consistency of the intrinsic return; and 4) determining the current annual compounding rate of return on investment. Alternatively, it is contemplated that the step of determining consistency of the intrinsic growth may be performed during step 1, such that the step of determining a fair value of a particular stock takes into account the risk involved.

[0163]Primary Method, step one: Current Fair Value Determination. For this application, “fair value” is the relative value to the risk free rate of a Treasury Note. I...

example

[0182]RequiredInitialReturn=(20.9%26.5%)×4.7%+4.7%=8.4%RiskPremium=8.4%-4.7%=3.7%

[0183]For example, a standard deviation is 10%, the intrinsic return is 20% and the risk free rate is 5%. The new discount rate or initial return requirement is therefore: (0.5*5%)+5%=7.5% (risk premium is 2.5%). If a company's last reported or trailing Earnings Per Share (EPS) is $10, then the new (risk adjusted) fair value would be $10 divided by 7.5% =$133. It can be seen that the new fair value is now discounted to reflect a 100% consistent (e.g. standard deviation=0) performance record. By calculating and adding a risk premium it becomes possible to compare companies in a population on a risk adjusted basis. This makes stocks comparable to a benchmark e.g. the (risk free rate), which has a standard deviation of “0” when held to maturity. Risk is the volatility in the year by year growth records of the intrinsic return.

[0184]It should be noted, however, that other alternative measurements and adjust...


PUM


Abstract

A system, method and computer program product creates a portfolio index based on fundamental, bond and stock market data and weights on constituent's fundamental value, fair value, relative value or synthesized value. An investment system may be based on a combination of fundamental metrics along with bond and stock market data to select and weight securities in a portfolio. Once a portfolio index is created, it may be used as a basis to purchase securities for the portfolio. Valuation indifferent indexes avoid overexposure to overvalued securities and underexposure to undervalued securities, as compared with conventional capitalization-weighted and price-weighted indexes.

Description

RELATED APPLICATION(S)[0001]This application is a continuation-in-part of U.S. application Ser. No. 11 / 957,703, filed Dec. 17, 2007. The entire teachings of the above application(s) are incorporated herein by reference.FIELD OF INVENTION[0002]The invention relates to a system and method of cross sectional analysis and more particularly, to portfolio selection and weighting disciplines of an investment portfolio.BACKGROUND OF THE INVENTION[0003]Traditionally, there are two broad categories of securities investing and portfolio management. One is active management, wherein the securities are selected based on a strategy where the manager makes specific investments with the goal of outperforming an investment benchmark index. The other broad category is passive management, also called indexing, wherein (a) the securities are selected and weighted (to generally construct the portfolio) according to various methodologies, such as size or style, e.g., value and growth, and (b) once the se...

Claims


Application Information

Patent Timeline
Patent Type & Authority Applications(United States)
IPC IPC(8): G06Q40/06G06F17/30
CPCG06Q40/00G06F17/30342G06Q40/06G06F16/2291
Inventor JOHANSSON, PETER J.
Owner JOHANSSON PETER J
Why Eureka
Try Eureka