
Density gradient analysis tool

a density gradient and analysis tool technology, applied in the field of density gradient analysis tools, can solve the problems of difficult to assess the data presented and identify data problems, and achieve the effect of efficient illustration of data, easy identification and easy identification

Active Publication Date: 2016-02-18
WELLS FARGO BANK NA
View PDF2 Cites 12 Cited by
  • Summary
  • Abstract
  • Description
  • Claims
  • Application Information

AI Technical Summary

Benefits of technology

The patent describes a method of creating heat maps using density gradient analysis to help identify issues in data. By organizing data based on its characteristics, the resulting heat map makes it easier to identify problems and can be reviewed more easily by non-experts. This approach helps to remove uncertainty from data analysis and improve the efficiency of data analysis.

Problems solved by technology

The more data a heat map includes, the more difficult it may be to assess the data being presented and identify issues in the data.

Method used


Image

  • Density gradient analysis tool
  • Density gradient analysis tool
  • Density gradient analysis tool

Examples


Embodiment Construction

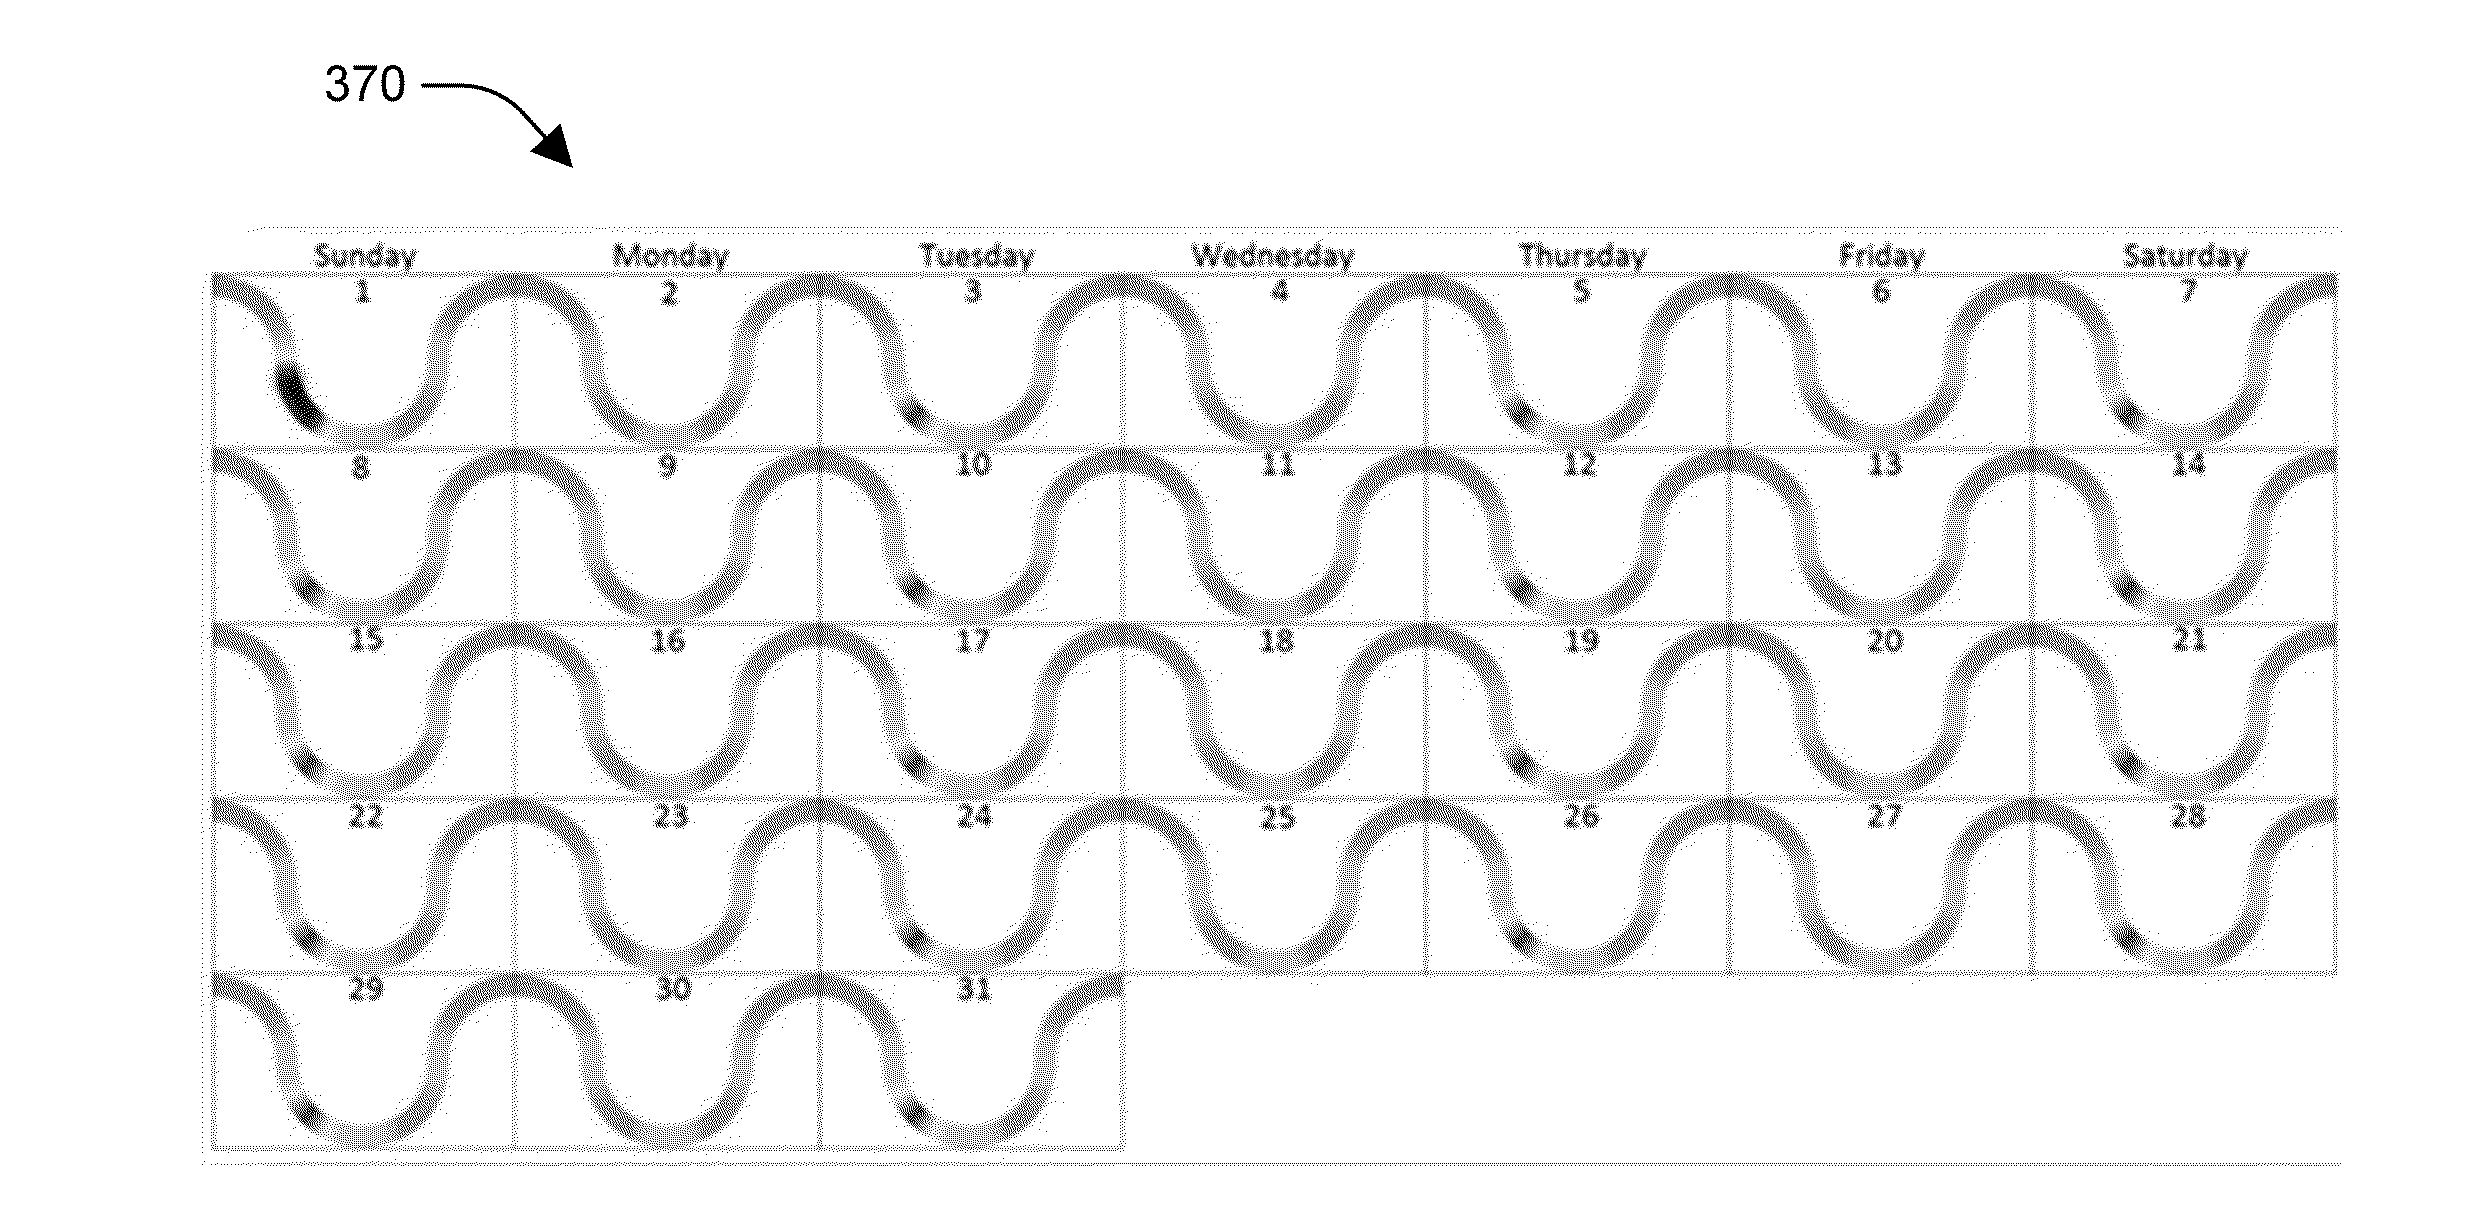
[0019]Embodiments or examples illustrated in the drawings are disclosed below using specific language. It will nevertheless be understood that the embodiments or examples are not intended to be limiting. Any alterations and modifications in the disclosed embodiments and any further applications of the principles disclosed in this document are contemplated as would normally occur to one of ordinary skill in the pertinent art. Described herein are examples of systems, methods, and other embodiments associated with utilizing a density gradient analysis tool in heat mapping.

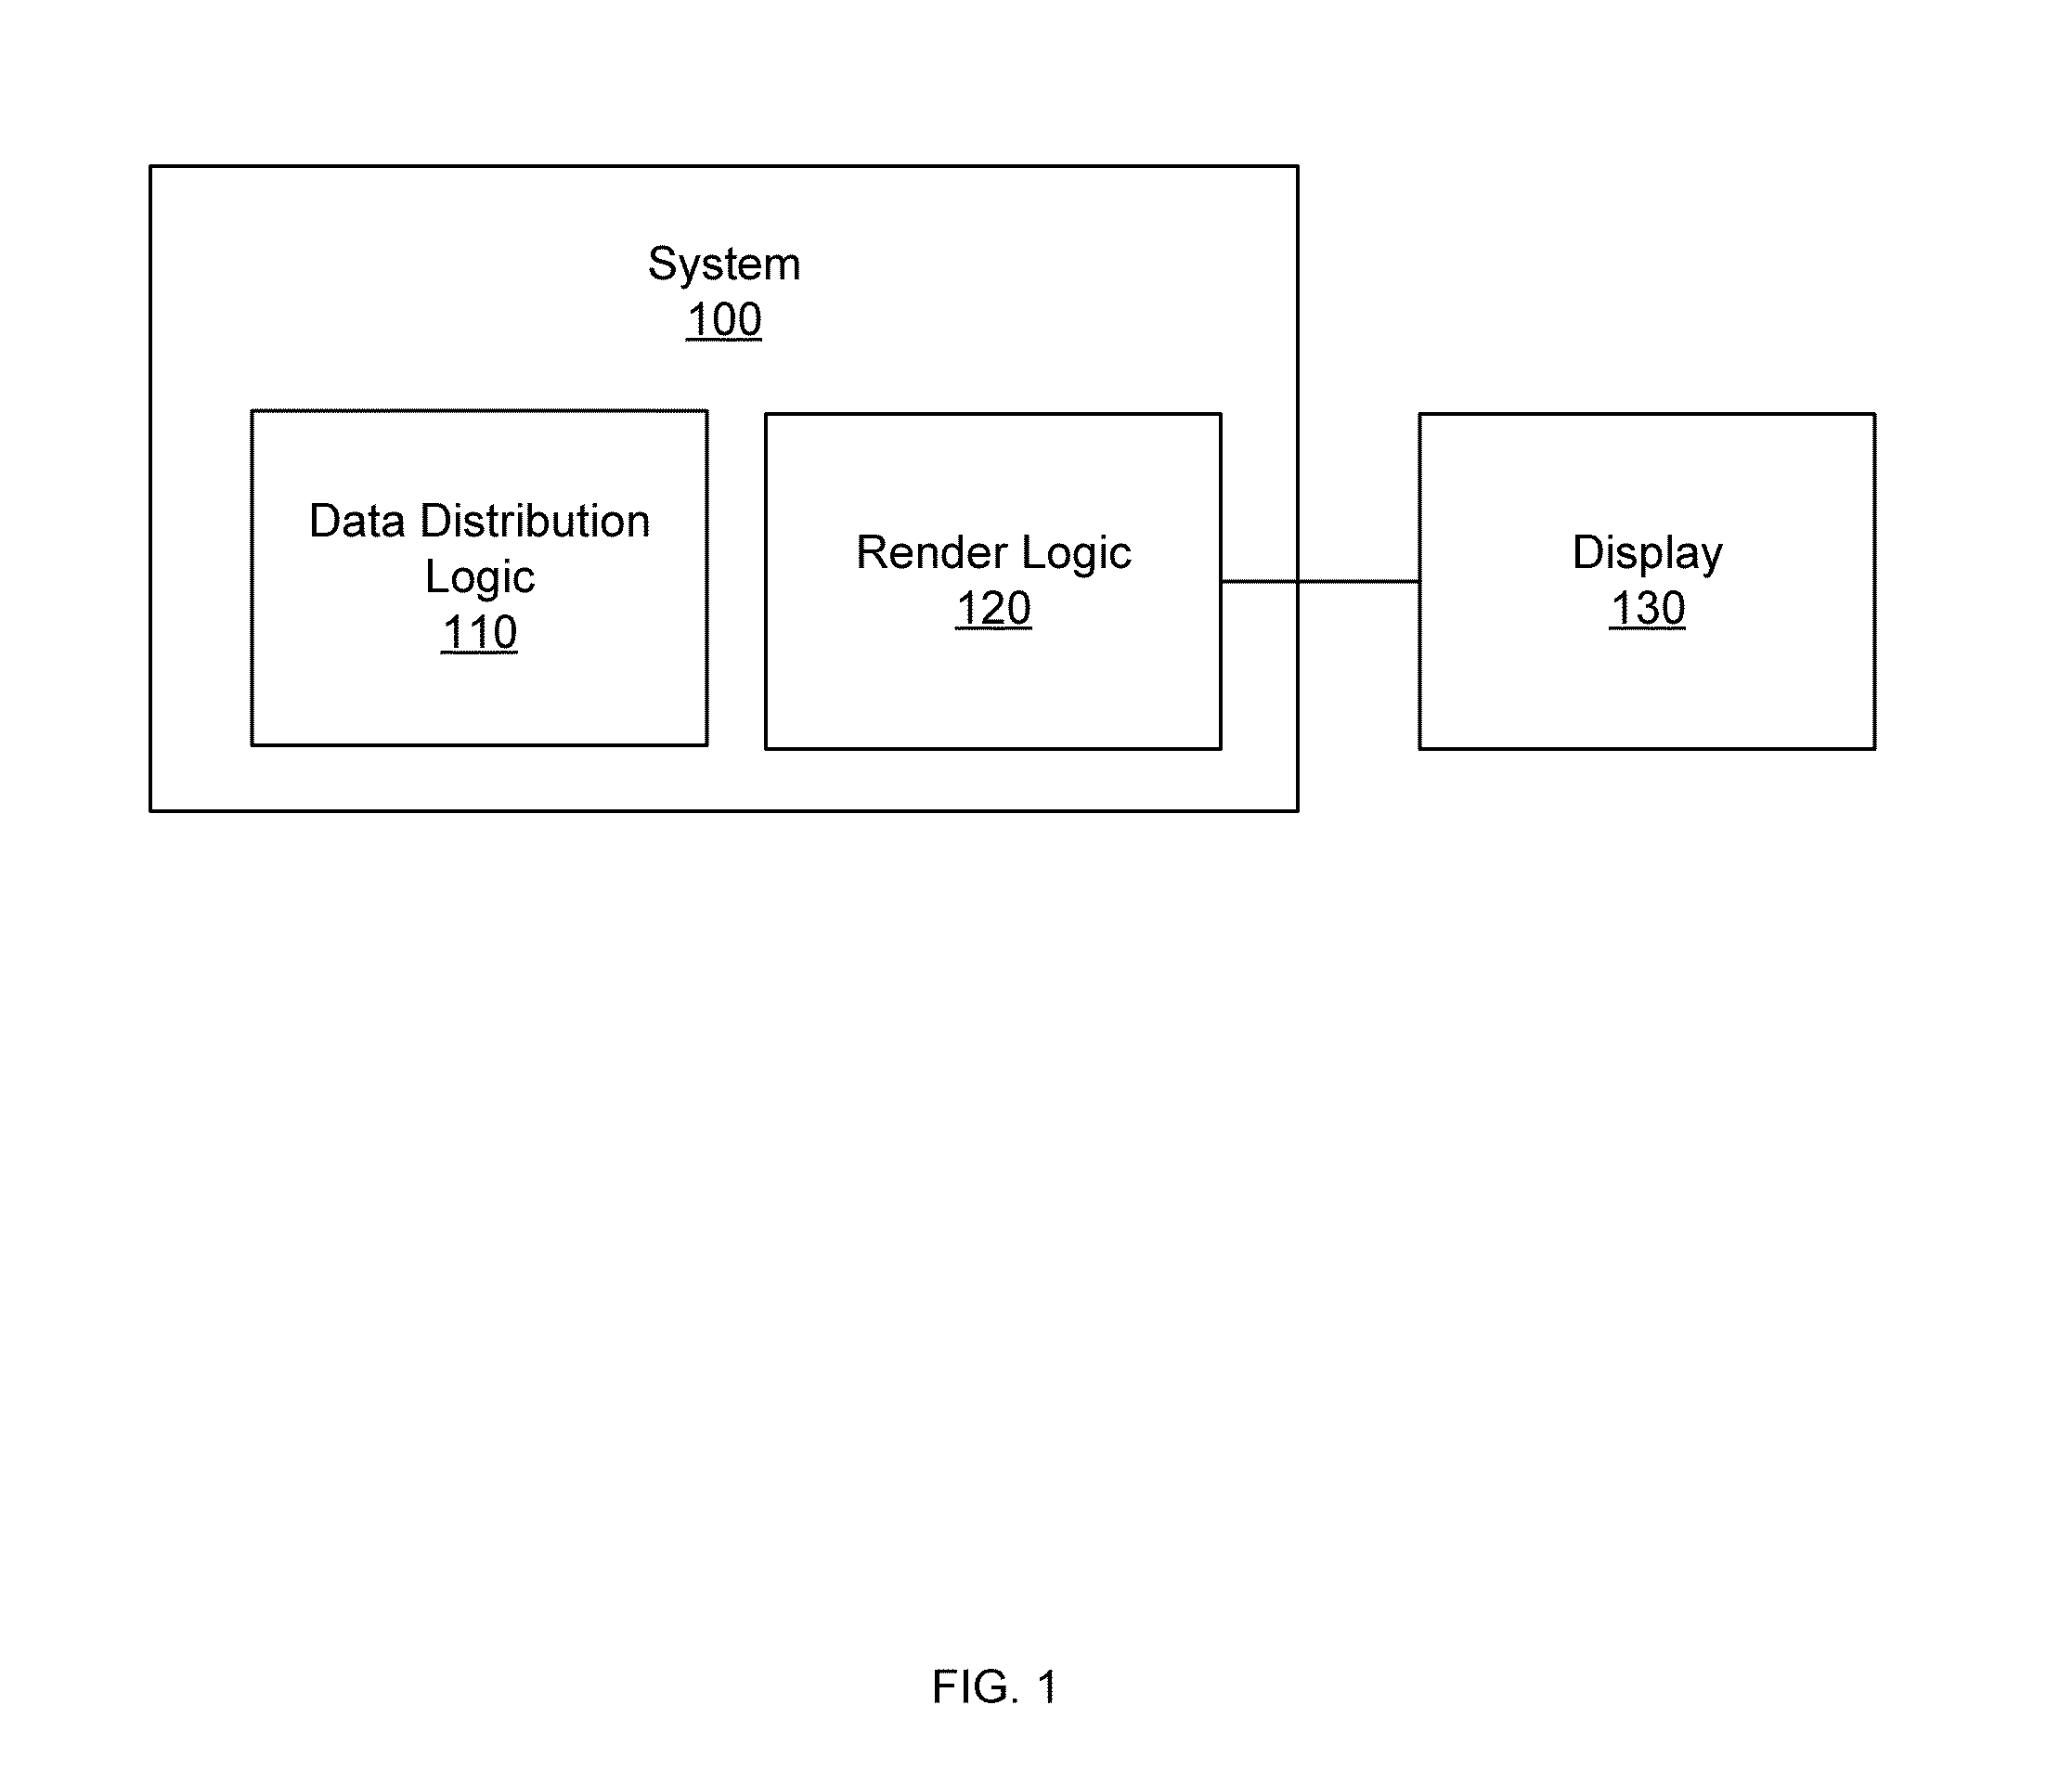
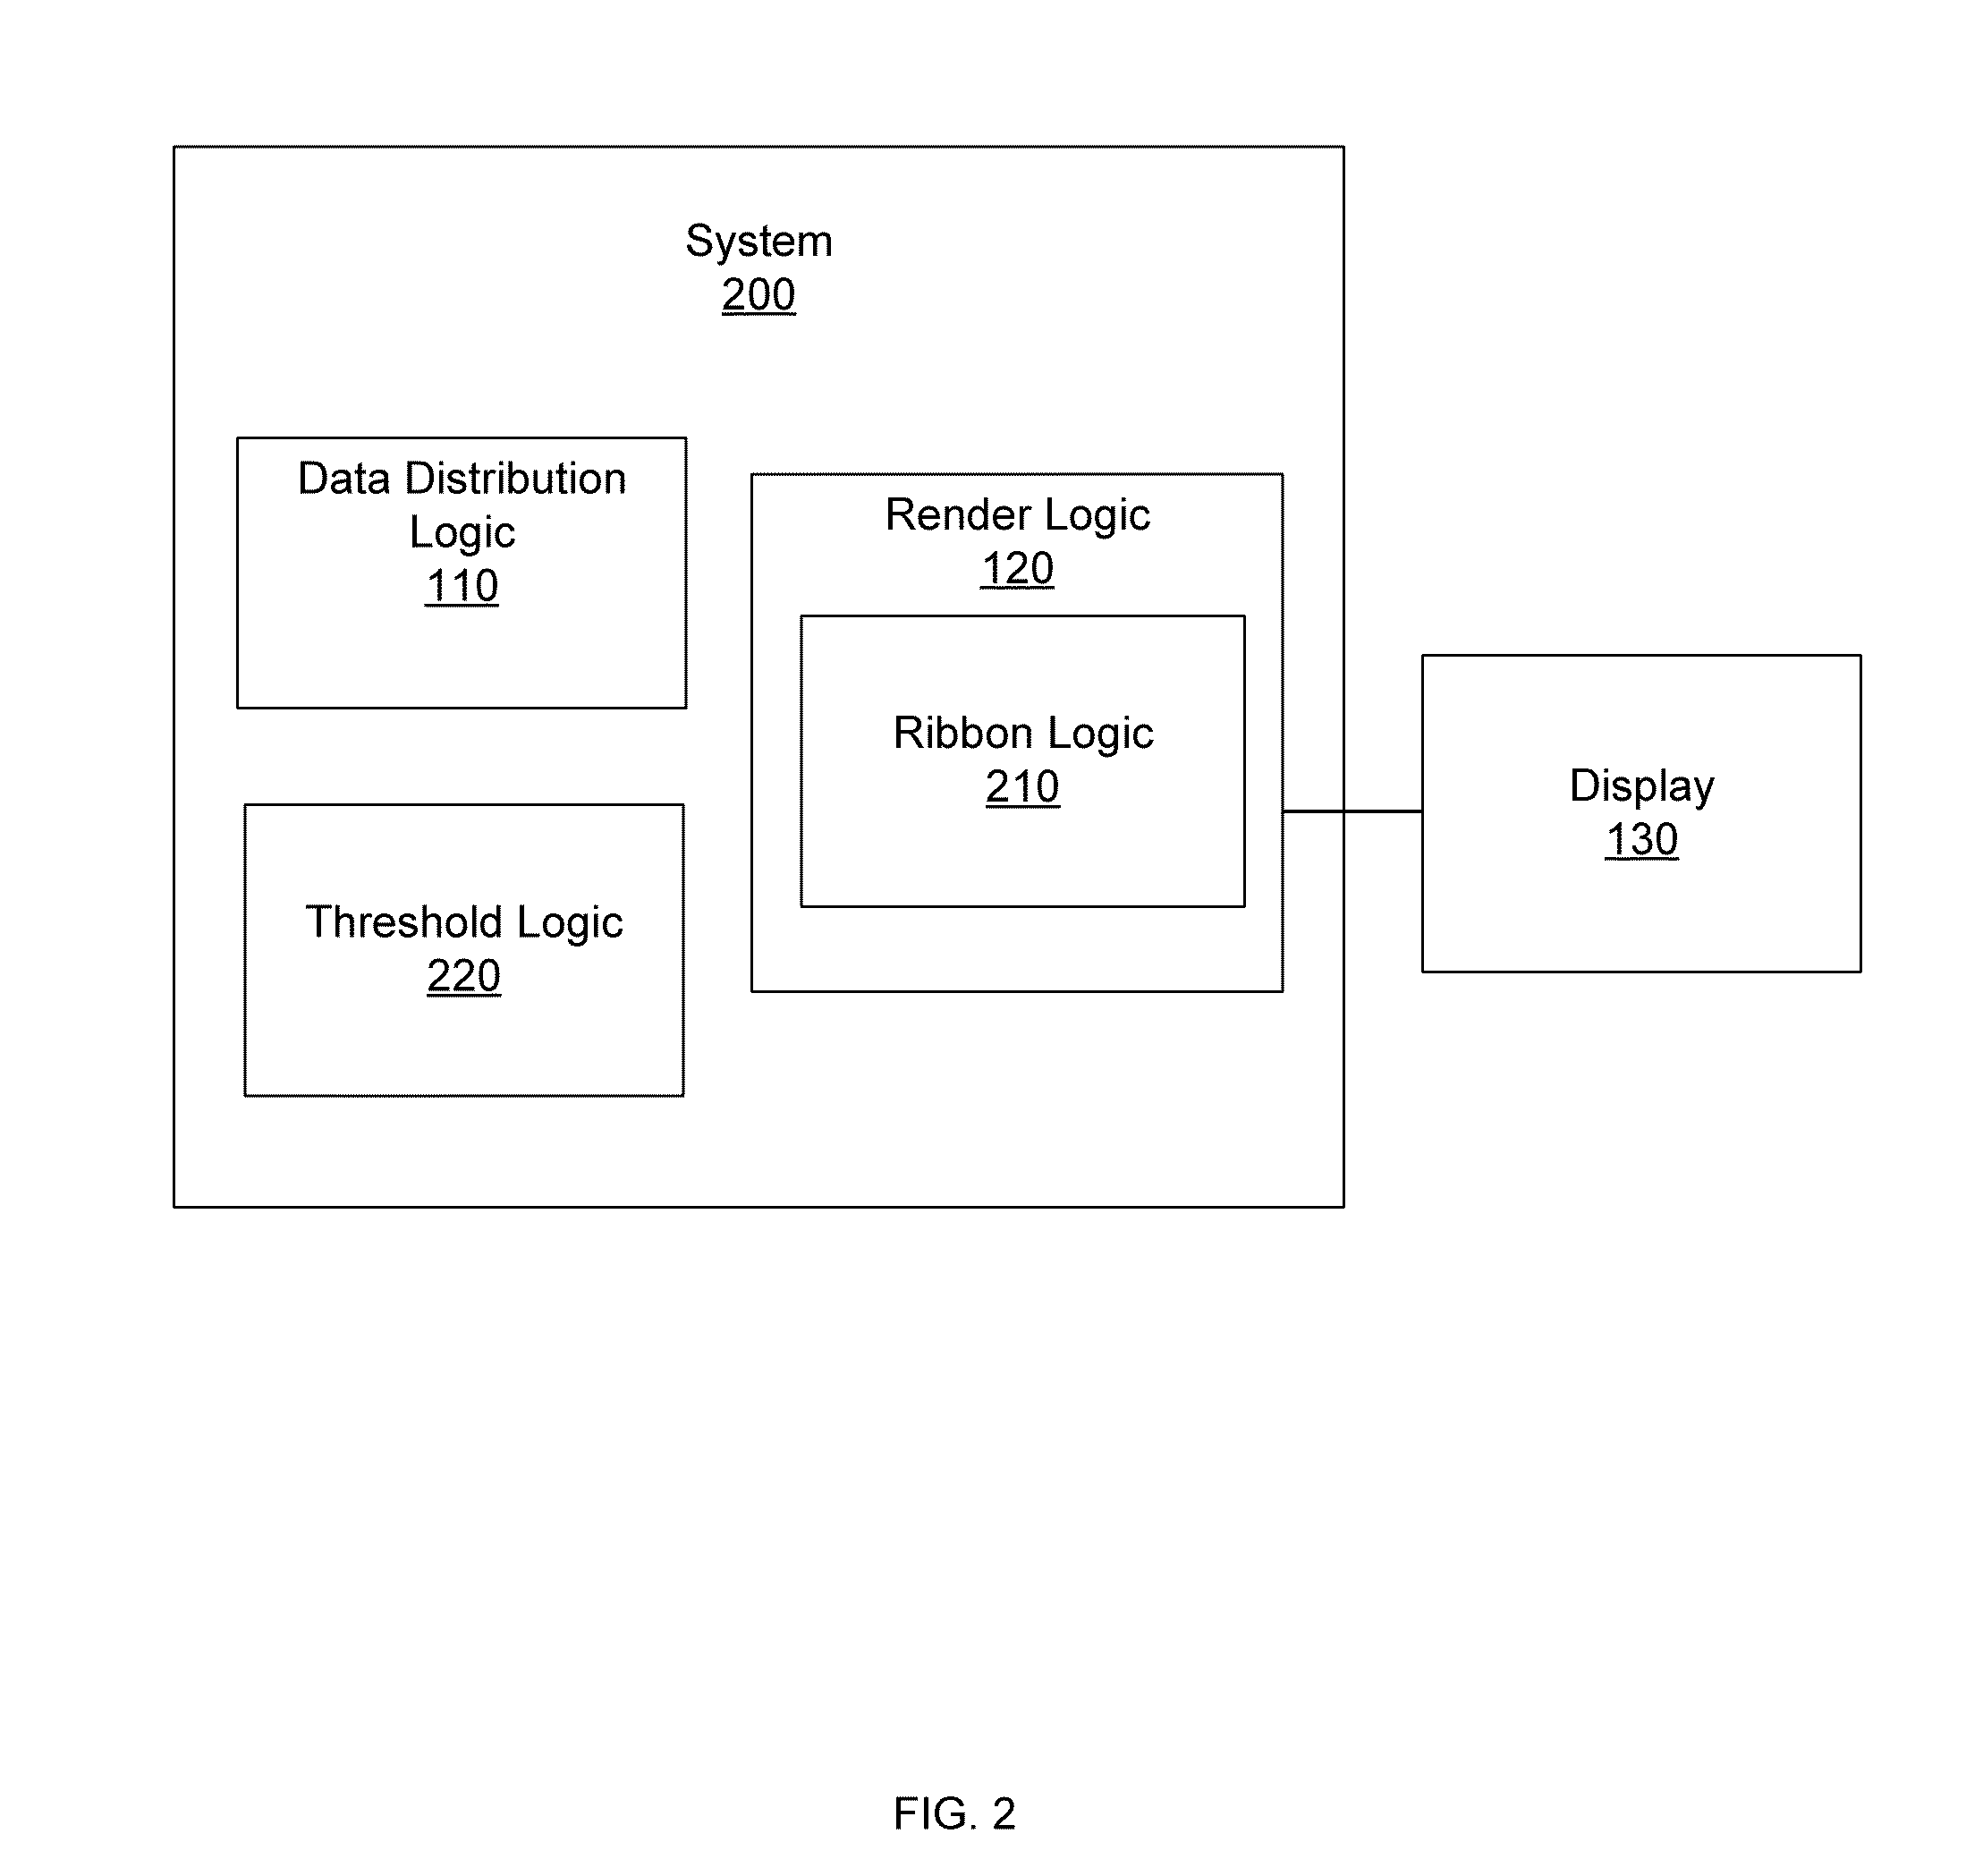
[0020]FIG. 1 illustrates one embodiment of a system 100 associated with a density gradient analysis tool. The system 100 includes a data distribution logic 110 and a render logic 120. They system 100 may be implemented in a computer system used for data analysis and display. For example, the render logic 120 may be associated with a display 130.

[0021]The data distribution logic 110 receives data. As discussed above, ...


PUM


Abstract

Systems, methods, and other embodiments associated with density gradient analysis tool for heat mapping systems. According to one embodiment, a method includes receiving data points. The method further includes calculating a data distribution of the data points. The data distribution has bins, and the bins represent an intervals. The method further includes rendering a heat map based, at least in part, on the data distribution. The heat map includes regions corresponding to the bins.

Description

BACKGROUND[0001]A heat map is a graphical representation of data points. Each data point is associated with a value. For example, data points regarding marathon runners may include values corresponding to finish times for the marathon runners. Different values of the data points are assigned colors. Accordingly, each data point in the heat map has a color corresponding to the value of that data point. The resulting heat map appears as a multi-colored area of all of the data points. Given the vast amounts of data that most endeavors generate and use, heat maps may be difficult to interpret. For example, a single heat map may have thousands of data points in dozens of colors. Even if the colors of each data point can be discerned, the heat map may not visually aid the viewer in identifying issues (e.g., data points, data thresholds, data trends). Thus, typical heat maps do not convey information about the represented data efficiently.BRIEF DESCRIPTION[0002]This brief description is pr...

Claims


Application Information

Patent Timeline
Patent Type & Authority Applications(United States)
IPC IPC(8): G06T11/00G06T11/20G06T11/60G16B45/00
CPCG06T11/206G06T11/60G06T11/001
Inventor JONES, CHRISTOPHER, J.
Owner WELLS FARGO BANK NA
Learn More