Method for weighting a credit score and display of business score

a credit score and business score technology, applied in the field of credit score weighting and business score display, can solve the problems of not really providing a long-term view of how the term measures of success are used, the risk inherent in commercial lease transactions is very small, and the data based on only 1% of u.s. businesses, so as to reduce the risk inherent in commercial lease transactions.

Inactive Publication Date: 2016-03-10
REMETER
View PDF5 Cites 2 Cited by
  • Summary
  • Abstract
  • Description
  • Claims
  • Application Information

AI Technical Summary

Benefits of technology

[0009]In an embodiment, the ranking provides a credit score for a party to a transaction. In an embodiment, the step of assigning an industry code based on an NAICS code to identify a particular industry and comparing the party with its peers based on the NAICS code and breaking out the ranking by one of a zip code, county, state, or metropolitan statistical area (MSA) region or nationally. In an embodiment, the ranking supports a credit score for a transaction that may be used by a credit bureau and a weighting factor applied to information being compared to determine the ranking. In an embodiment the industry information includes tax return data and data relating to the industry of the party including multiple financial data points of comparable parties including Internal Revenue Service data received from a data base of at least 140 MM individuals and 27 MM businesses covering at least 10 previous years of tax return data. In an embodiment, the industry information is incorporated with data from one of the U.S. Census Bureau and Bureau of Labor. In an embodiment, the ranking is used to adjust a financial agreement, contract or lease amount or breakeven point in order to improve the ranking.
[0040]Fosters better lease revenue and capital budgeting forecasts and improves risk management;

Problems solved by technology

There's very little other information about the financial practices or financial risk such companies have taken.
These short term measures of success don't really provide a long term view on how well a business perform over a 5 or 7 year lease period.
So the RMA data is based on only 1% of U.S. businesses and is very limited with respect to the industry breakout in financials per industry.
RMA does not provide market sizing nor rent expense benchmarking.
In view of the current state of means of tracking business financial stability and credit the current data is incomplete and error prone.
Tests have proven that data in this marketplace is poor and studies have concluded that errors of 75% by orders of magnitude are found with the data and 30-60% of the data is overstated with regard to income versus the actual income reported on IRS tax returns.
Secondary survey-based systems are also inconsistent and have poor data quality and lack of critical mass of companies reporting.

Method used


Image

  • Method for weighting a credit score and display of business score
  • Method for weighting a credit score and display of business score
  • Method for weighting a credit score and display of business score

Examples


case b

[0101]incremental Value=(mid−lowMid) / 25;[0102]percentile=(25+(value−lowMid) / incremental Value)*10;[0103]credit indicator=1000−percentile

case c

[0104]incremental Value=(highMid−mid) / 25;[0105]percentile=(50+(value−mid) / incremental Value)*10;[0106]credit indicator=1000−percentile

[0107]Case D[0108]incremental Value=(high−highMid)25;[0109]percentile=(75 +(value−high) / incrementalValue)*10;[0110]credit indicator=1000−percentile

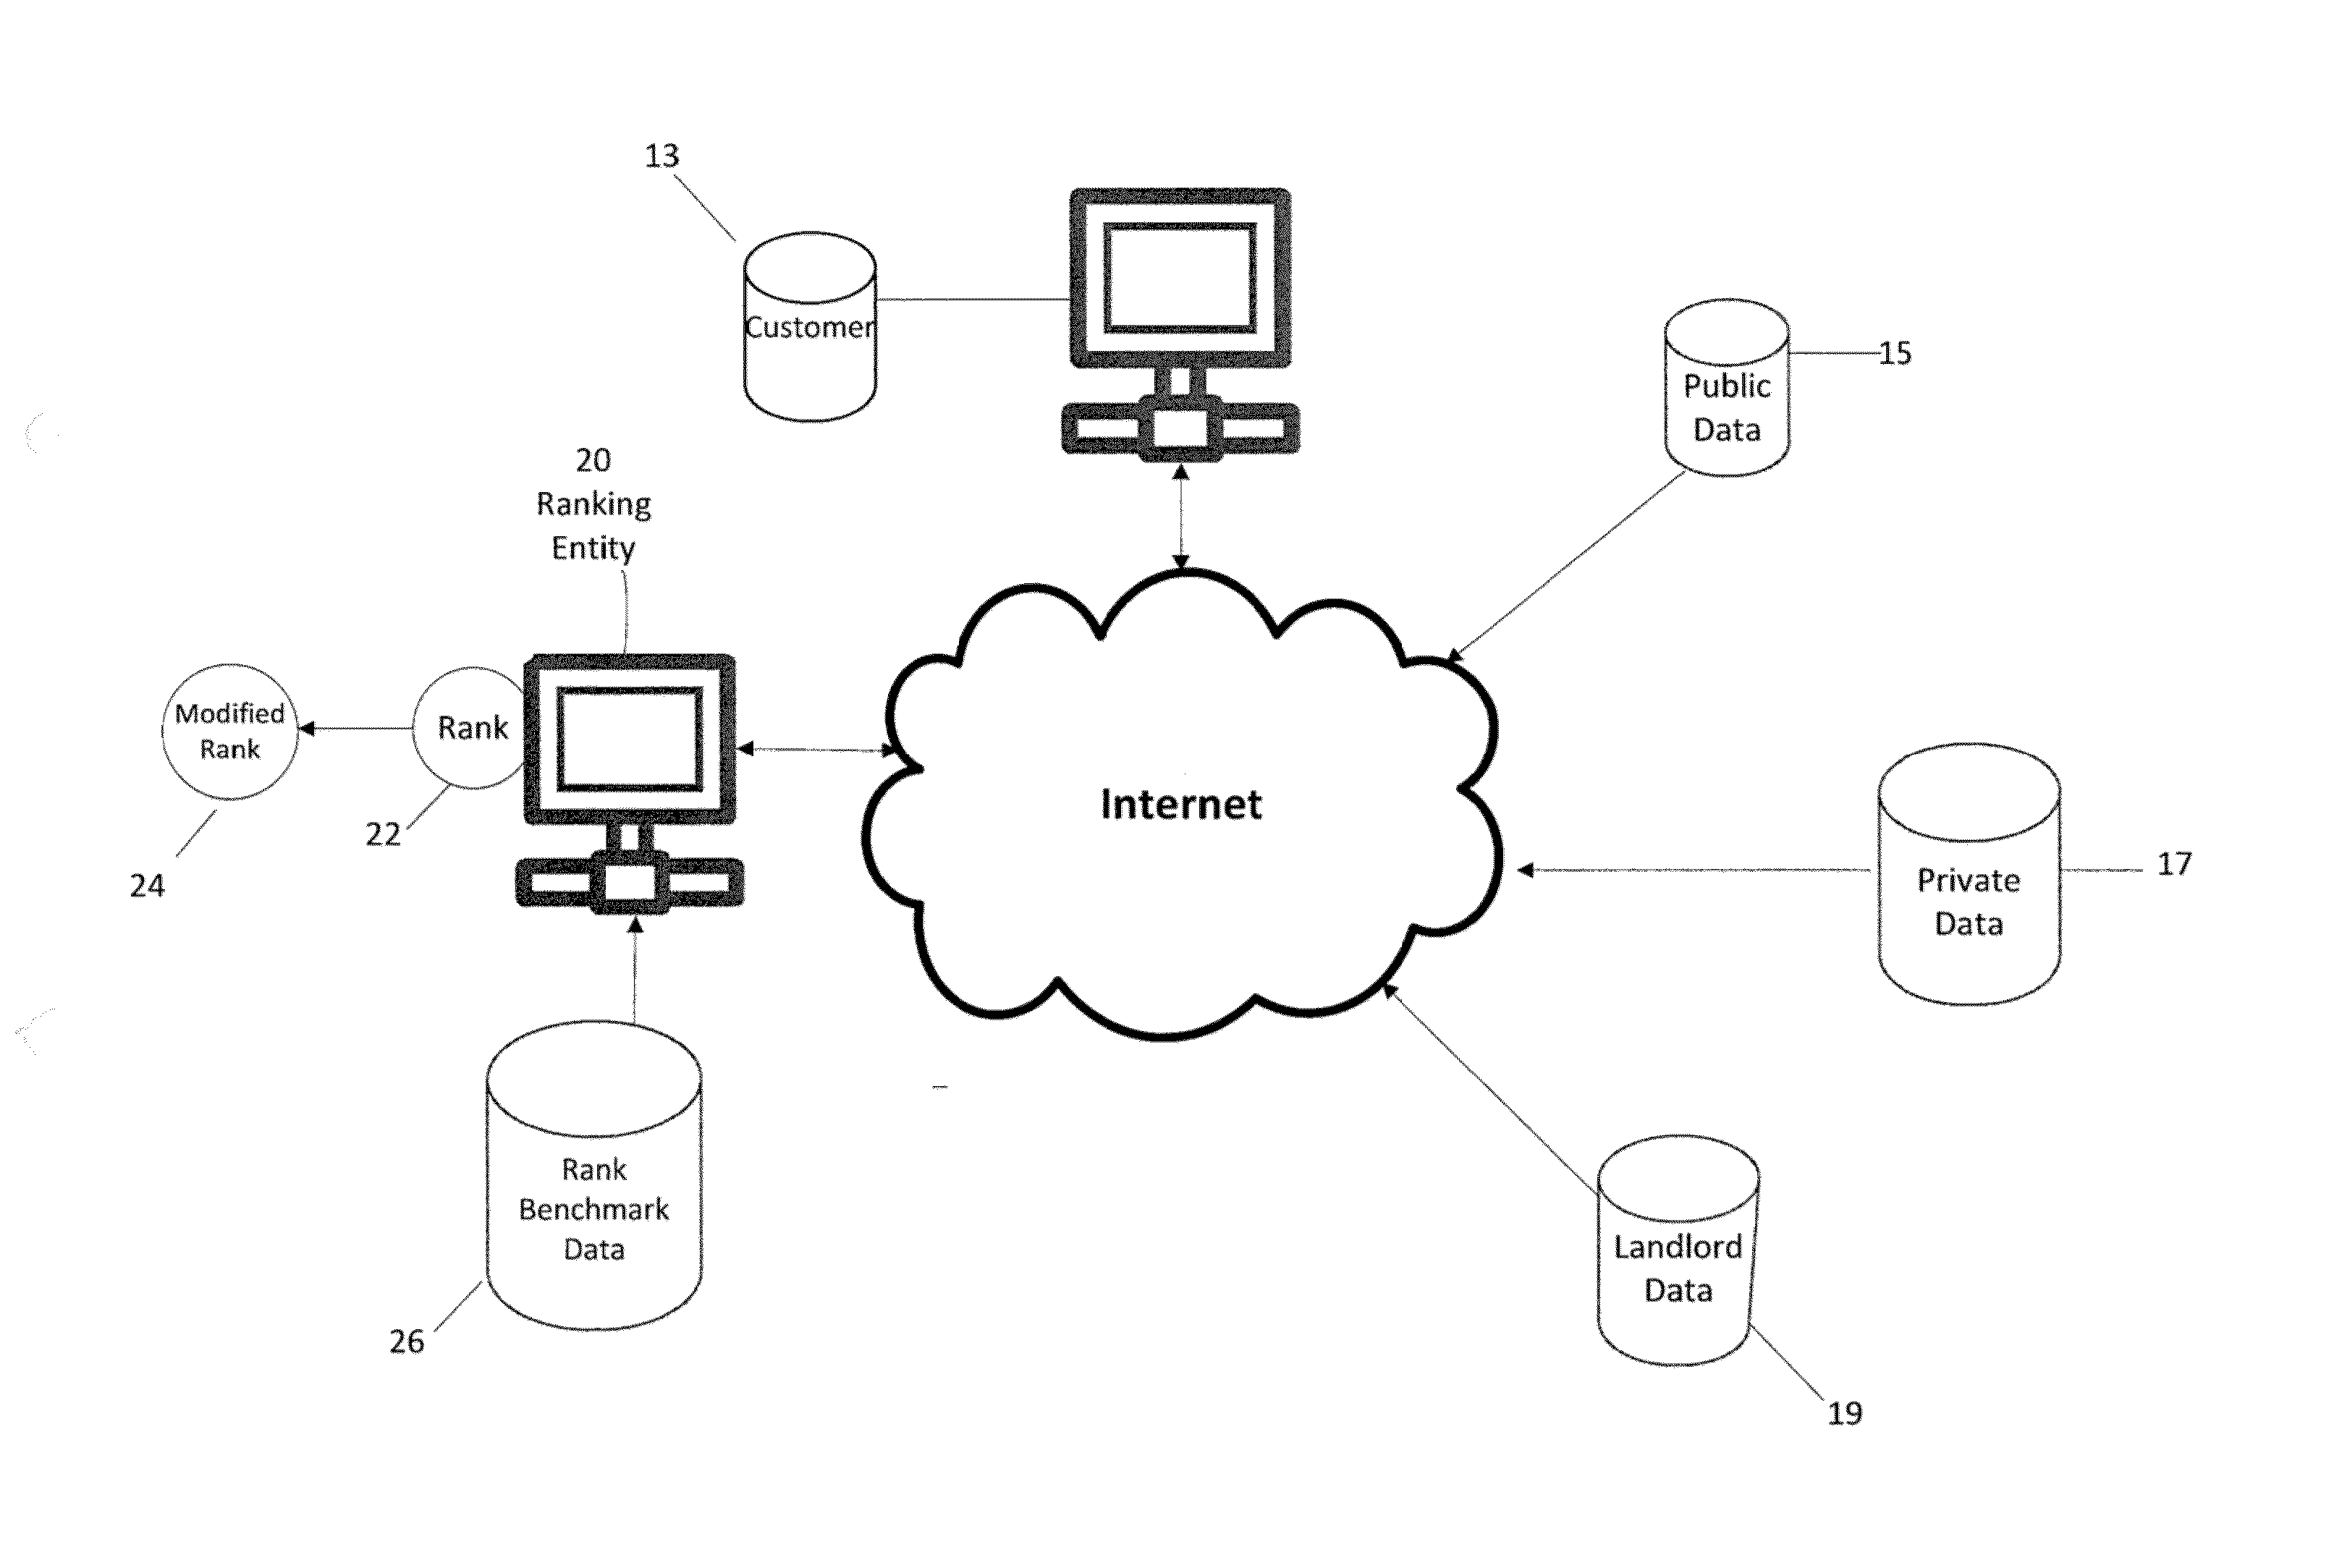
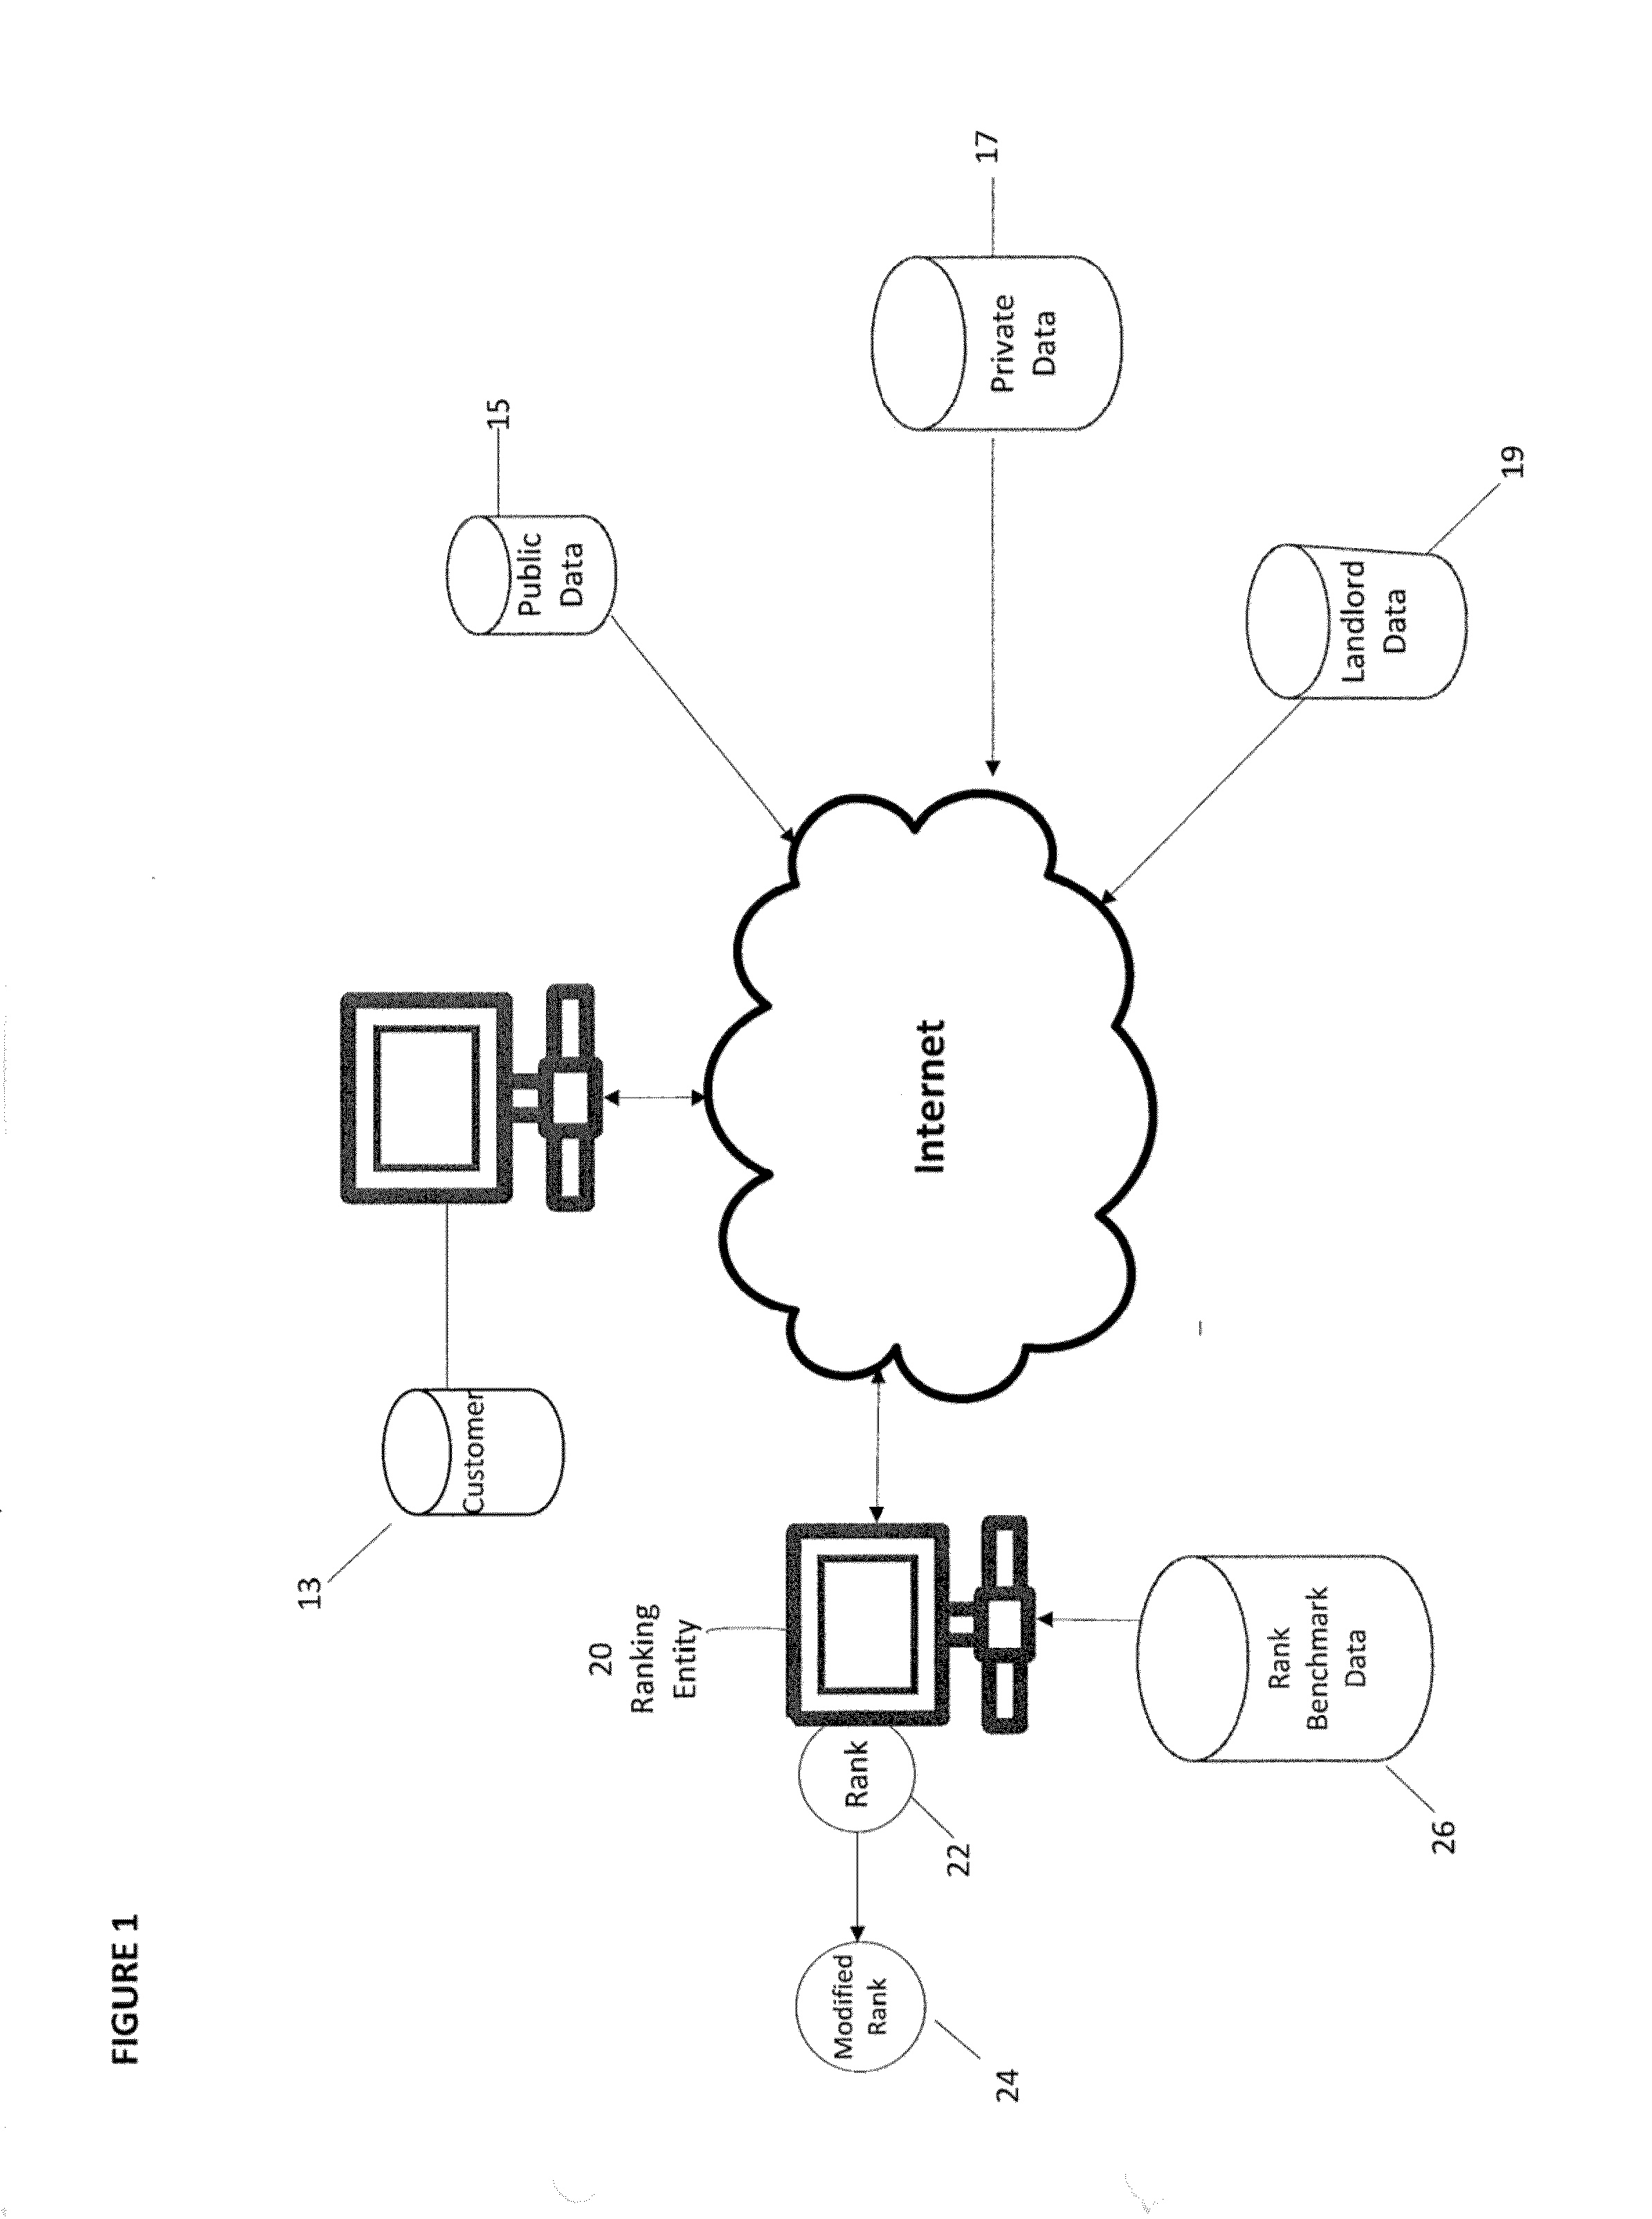
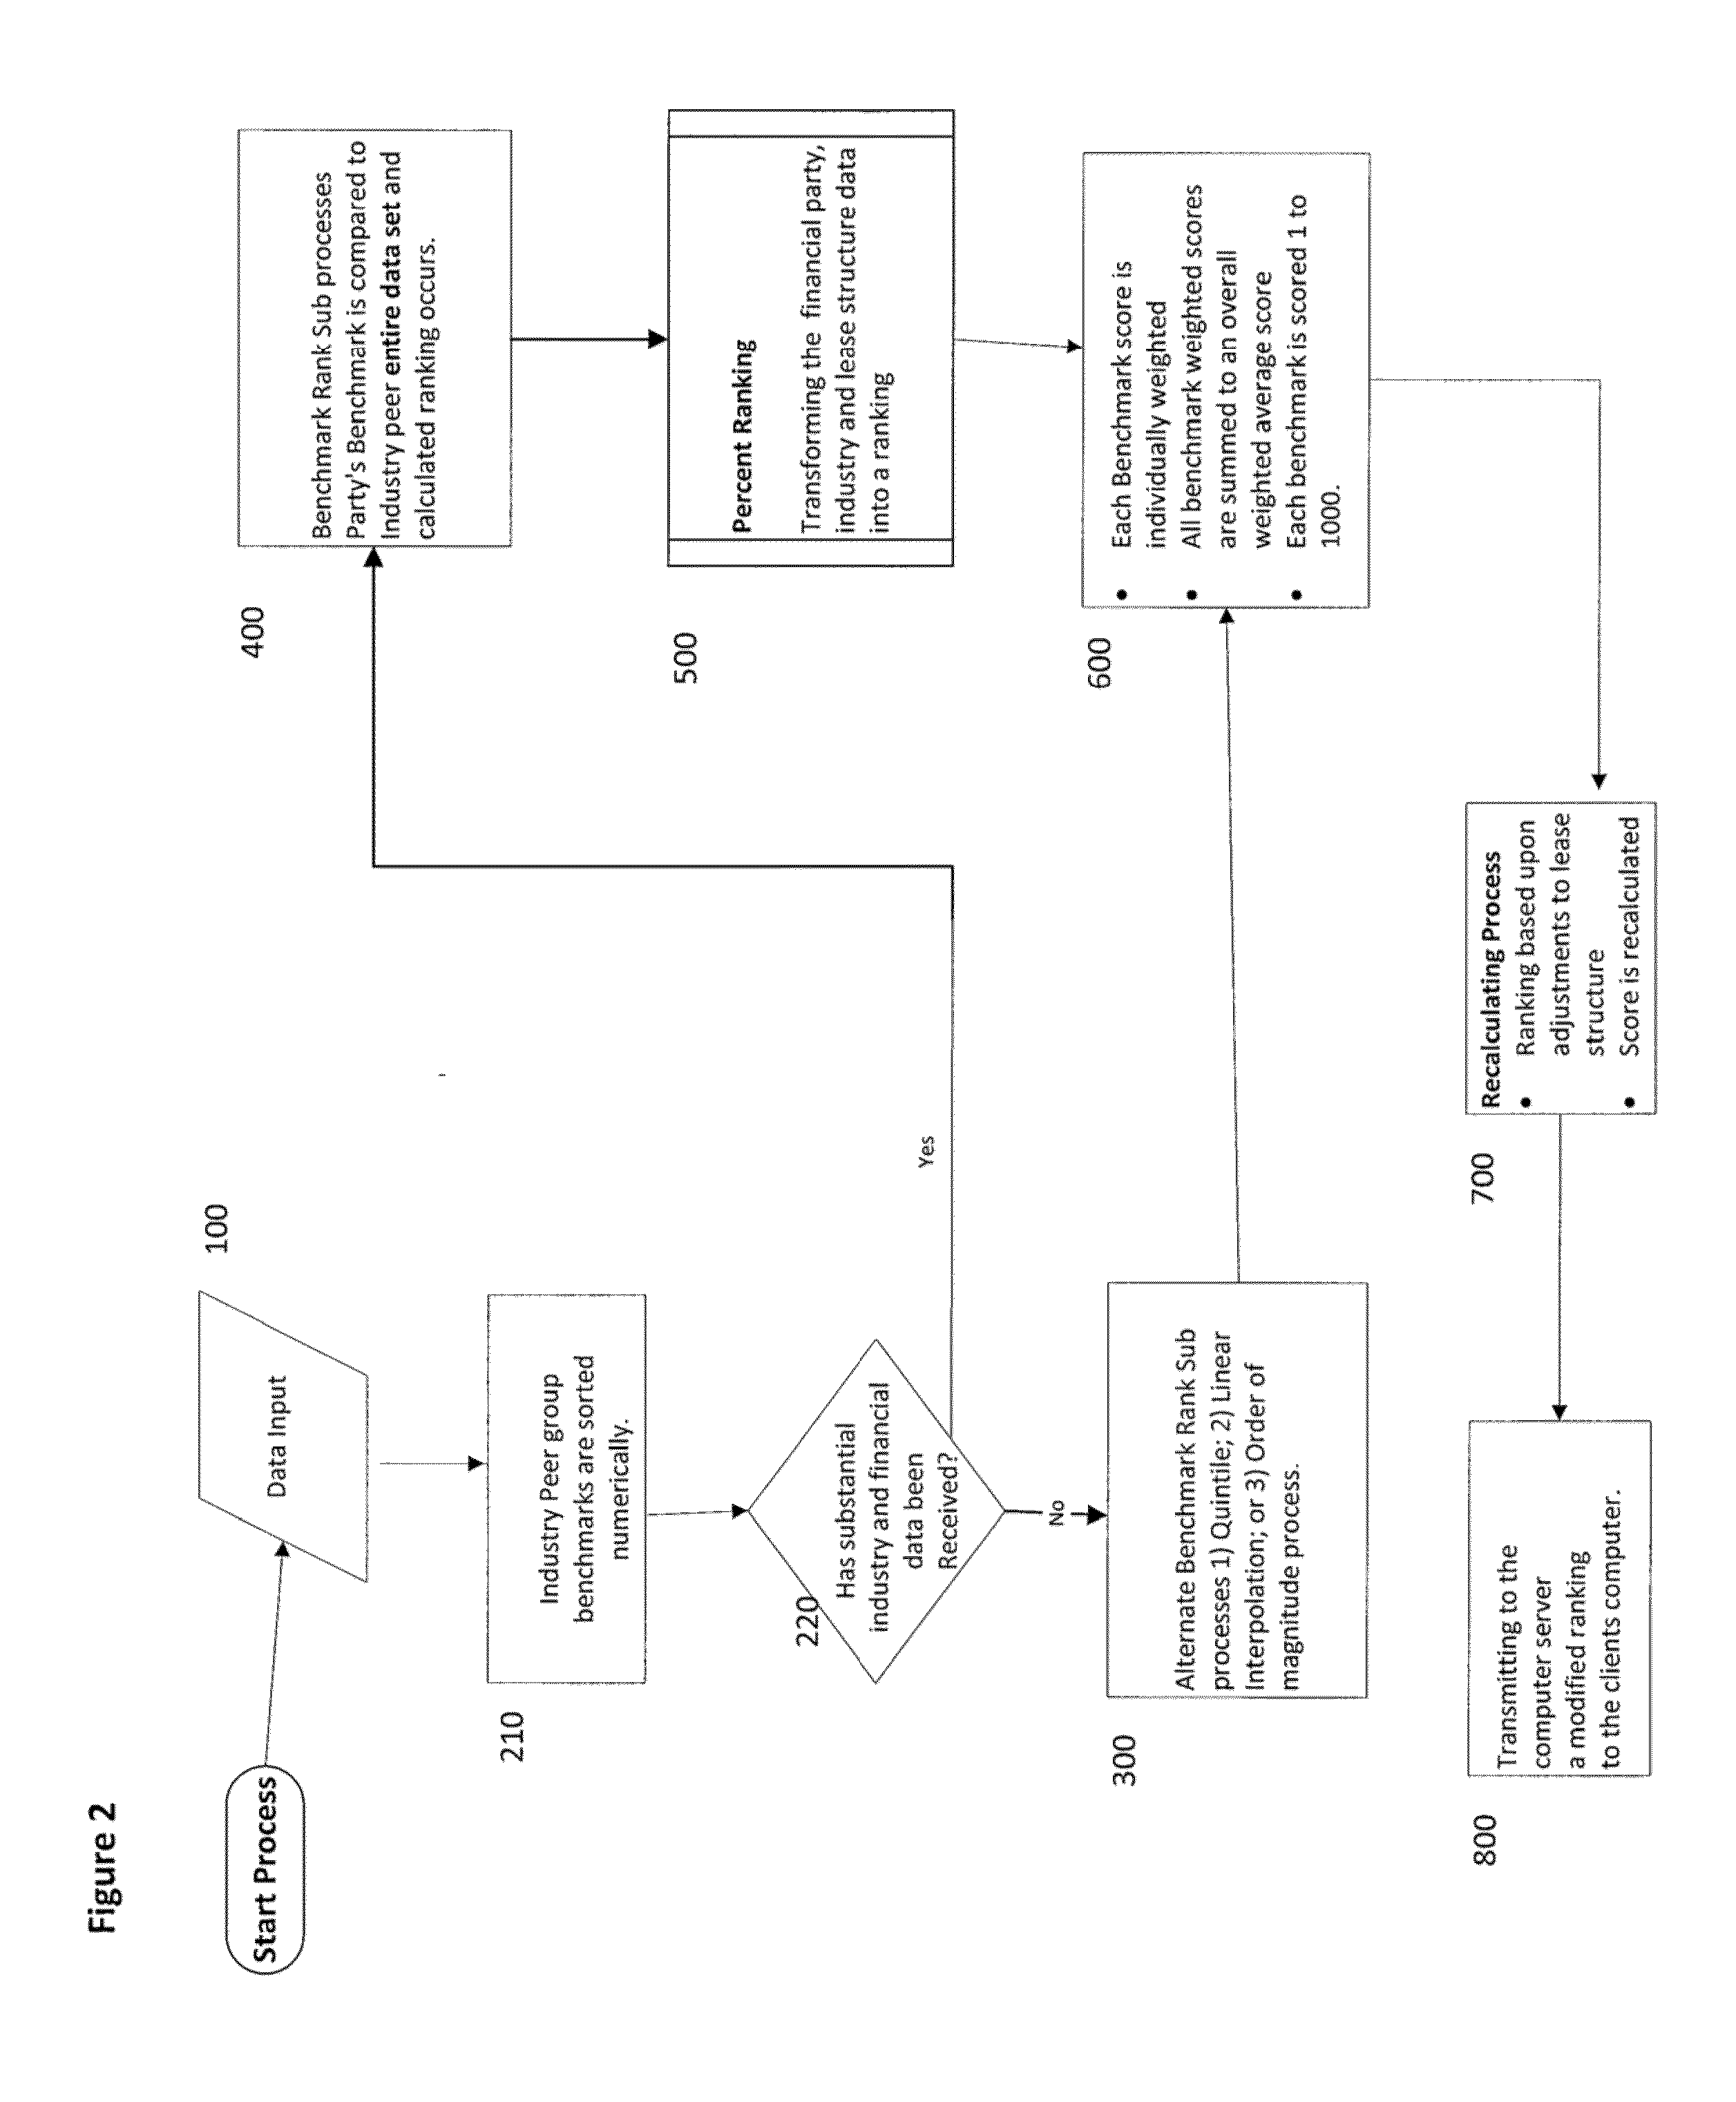
[0111]Turning to FIG. 2, at step 400 the benchmark rank process occurs by comparing a parties benchmark data to industry peer datasets and calculating a ranking. At step 500 the percent ranking system operates by transforming the financial party industry and lease structural data into a ranking. At step 600 the benchmark score is individually weighted, all benchmark weighted scores are summed to an overall weighted average score and each benchmark is scored from 1 to 1000. Step 600 also may be applied following the alternate sub processes of step 300. Thereafter at step 700 a recalculating process occurs where the ranking based upon step 600 are adjusted based on lease structure information. The score is r...


PUM


Abstract

A method for displaying a credit score for financial transactions can be used for such business endeavors such as a lease or purchasing property. The weighting system display financial data scoring with respect to industry information in order to transform financial data and industry information to a score by establishing numeric benchmark values and display a score with regard to financial factors related to the business transaction.

Description

[0001]This application claims priority to and is a continuation of U.S. application Ser. No. 14 / 476,9n, filed Sep. 4, 2014.[0002]A display system for business weighting of a credit score provided for determining the credit of a business or individual in order to display a score with respect to financial criteria.BACKGROUND[0003]Financial ranking systems are known with respect to ranking credit worthiness of businesses. For example, Dun & Bradstreet (D&B) is well known for providing financial data with respect to businesses. However, the D&B system relies mainly on scoring how well a business pays their creditors. There's very little other information about the financial practices or financial risk such companies have taken. D&B receives its information on a volunteer basis from companies and as a result only collects data from about 4% of U.S. businesses. A Paydex score is provided also but it only uses approximately 2% of all bills paid by a company to measure credit risks. Current...

Claims


Application Information

Patent Timeline
Patent Type & Authority Applications(United States)
IPC IPC(8): G06Q40/02
CPCG06Q40/025G06Q40/03
Inventor OPENLANDER, SCOTT, H.
Owner REMETER
Why Eureka
Try Eureka