Semantic distance-based assignment of data elements to visualization edges

Active Publication Date: 2016-03-31
ORACLE INT CORP
View PDF2 Cites 38 Cited by
  • Summary
  • Abstract
  • Description
  • Claims
  • Application Information

AI Technical Summary

Benefits of technology

[0009]Some embodiments provide techniques (e.g., a method, a system, non-transitory computer-readable medium storing code or instructions executable by one or more processors) for presenting a same set of data in a visualization of another type in an effective and intuitive manner. One such technique can include receiving existing edge information for an existing visualization, the existing visualization having a first set of edges, where the first set of edges identifies that the existing visualization is of a first visualization type

Problems solved by technology

Generating graphic visualizations that can be readily intuitive to a user presents significant challenges as there are countless variations in which data can be assembled and presented to the user.
For example, while a type of visualization (e.g., a bar chart, a pie chart) may accommodate multiple dimensions of data (e.g., revenue, company

Method used


Image

  • Semantic distance-based assignment of data elements to visualization edges
  • Semantic distance-based assignment of data elements to visualization edges
  • Semantic distance-based assignment of data elements to visualization edges

Examples


Example

[0024]In the following description, for the purposes of explanation, specific details are set forth in order to provide a thorough understanding of embodiments of the invention. However, it will be apparent that various embodiments may be practiced without these specific details. The figures and description are not intended to be restrictive.

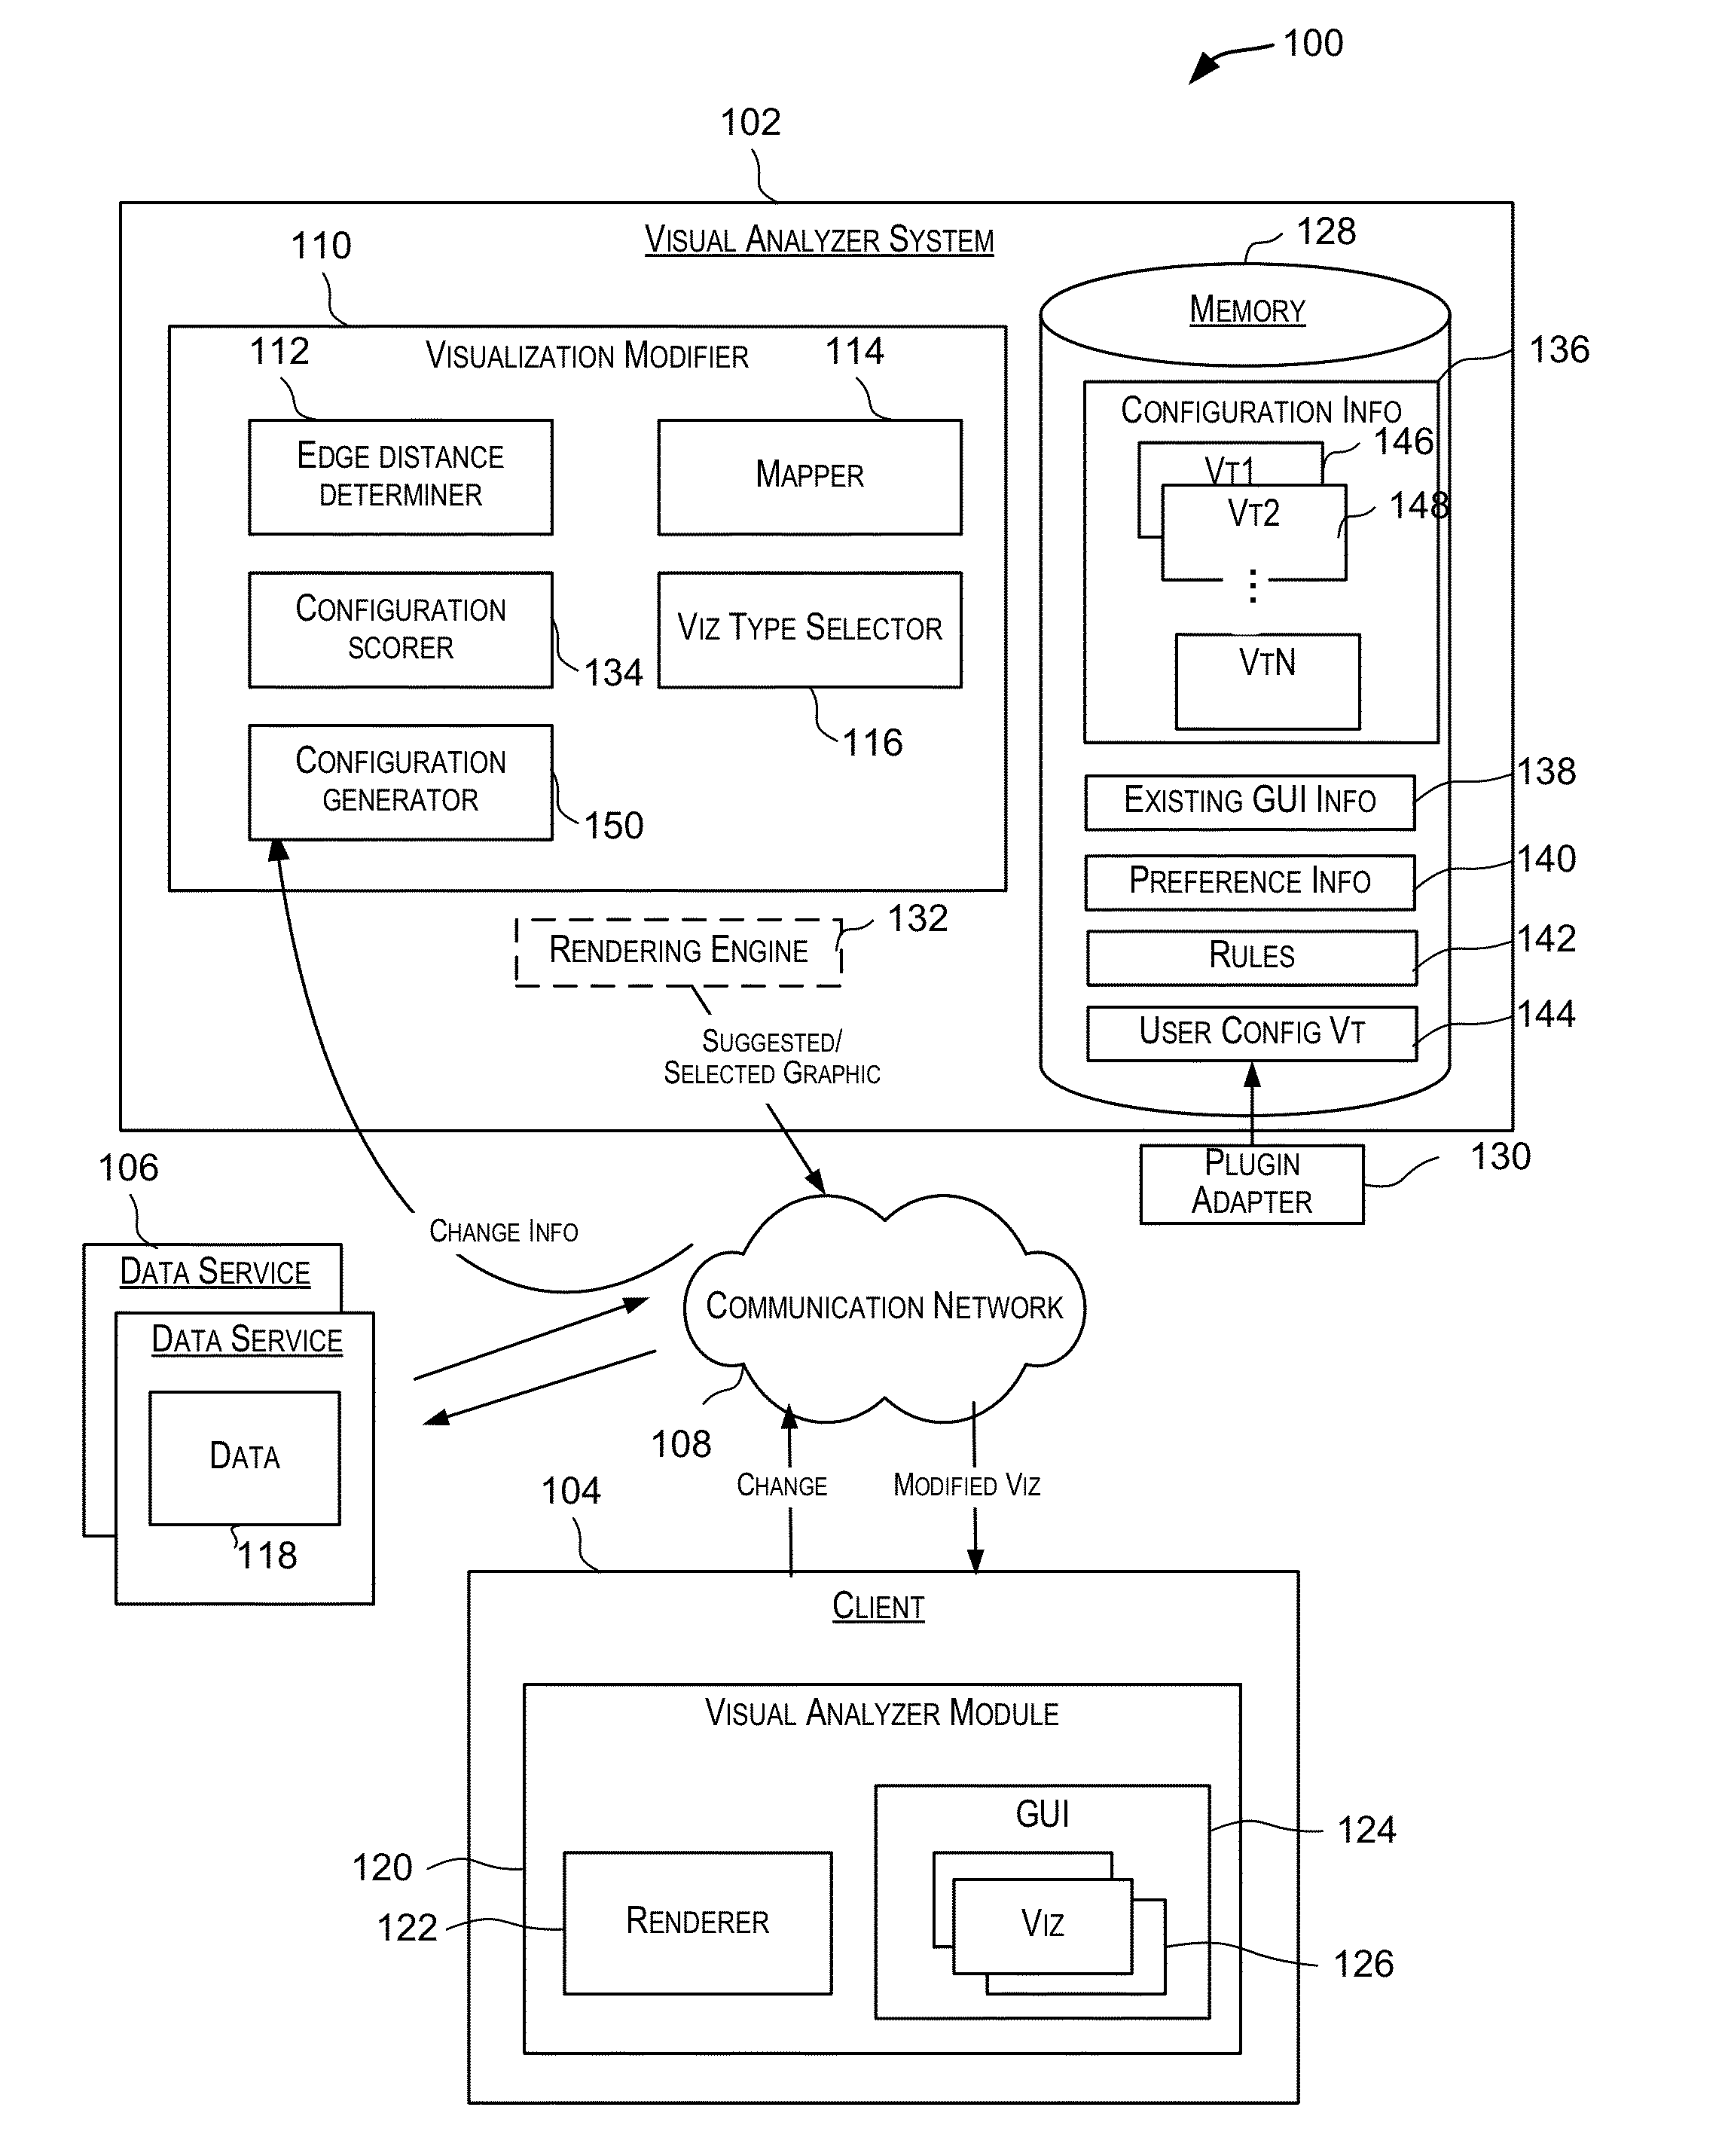
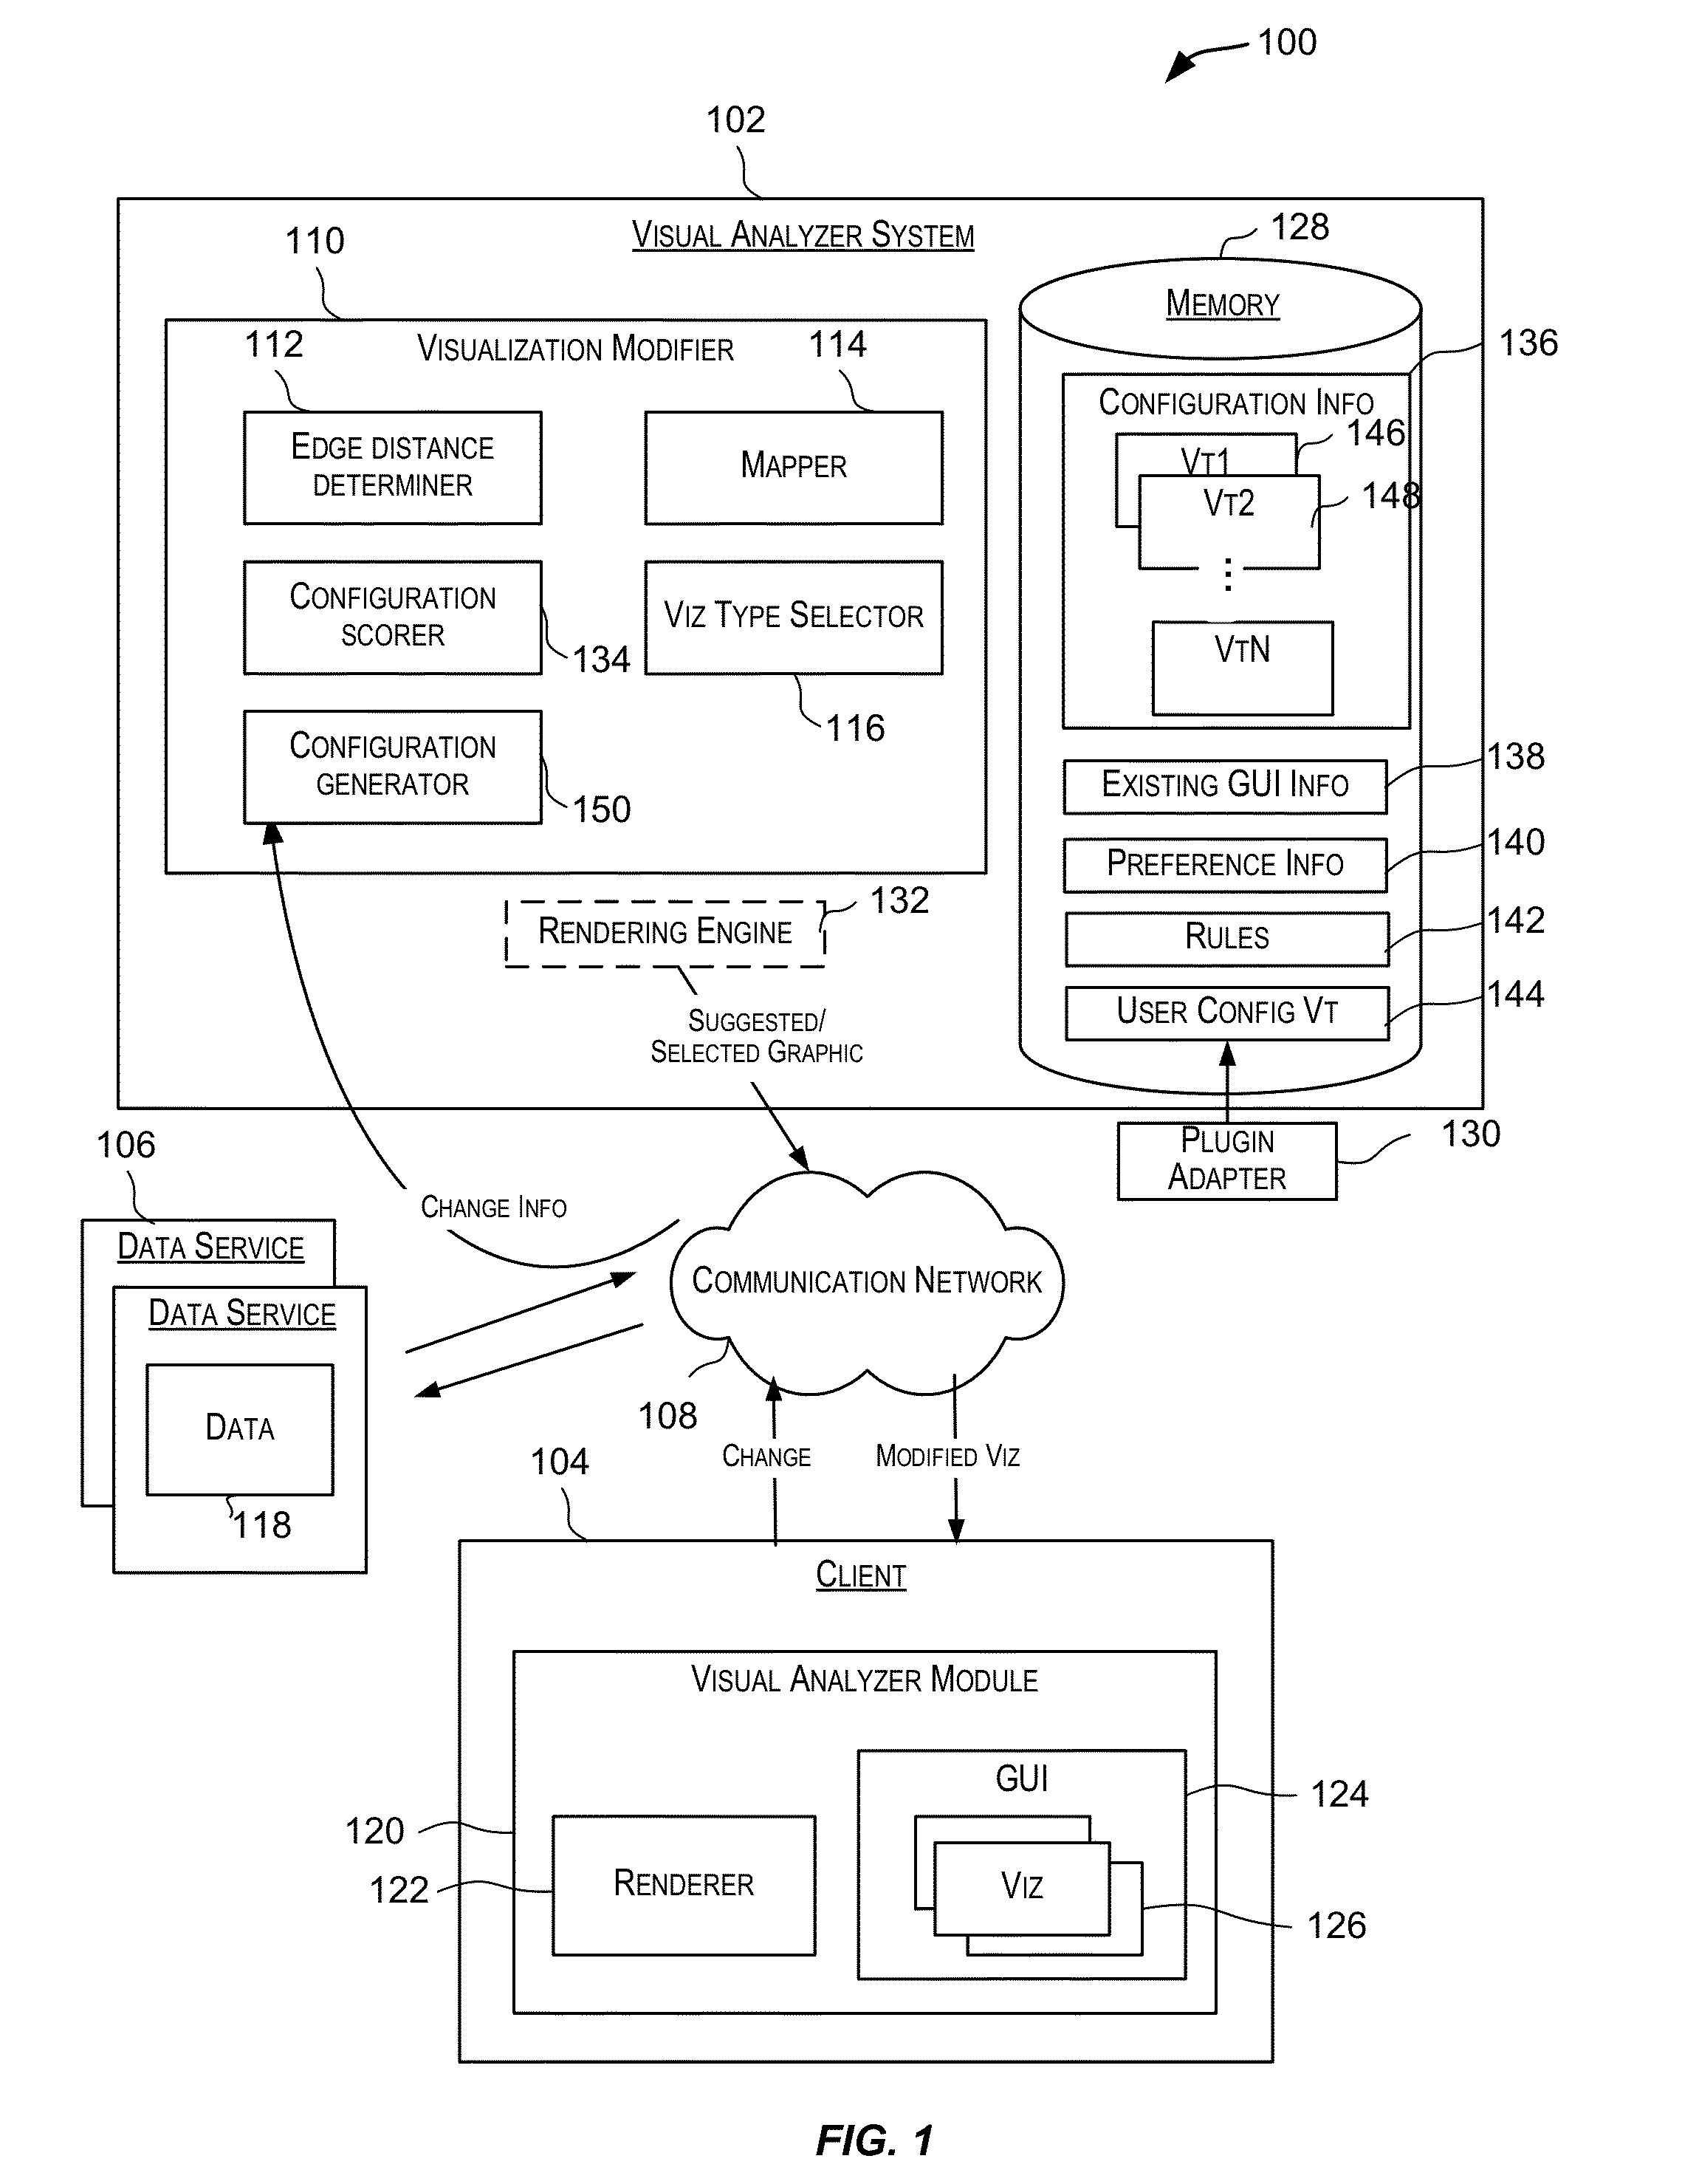
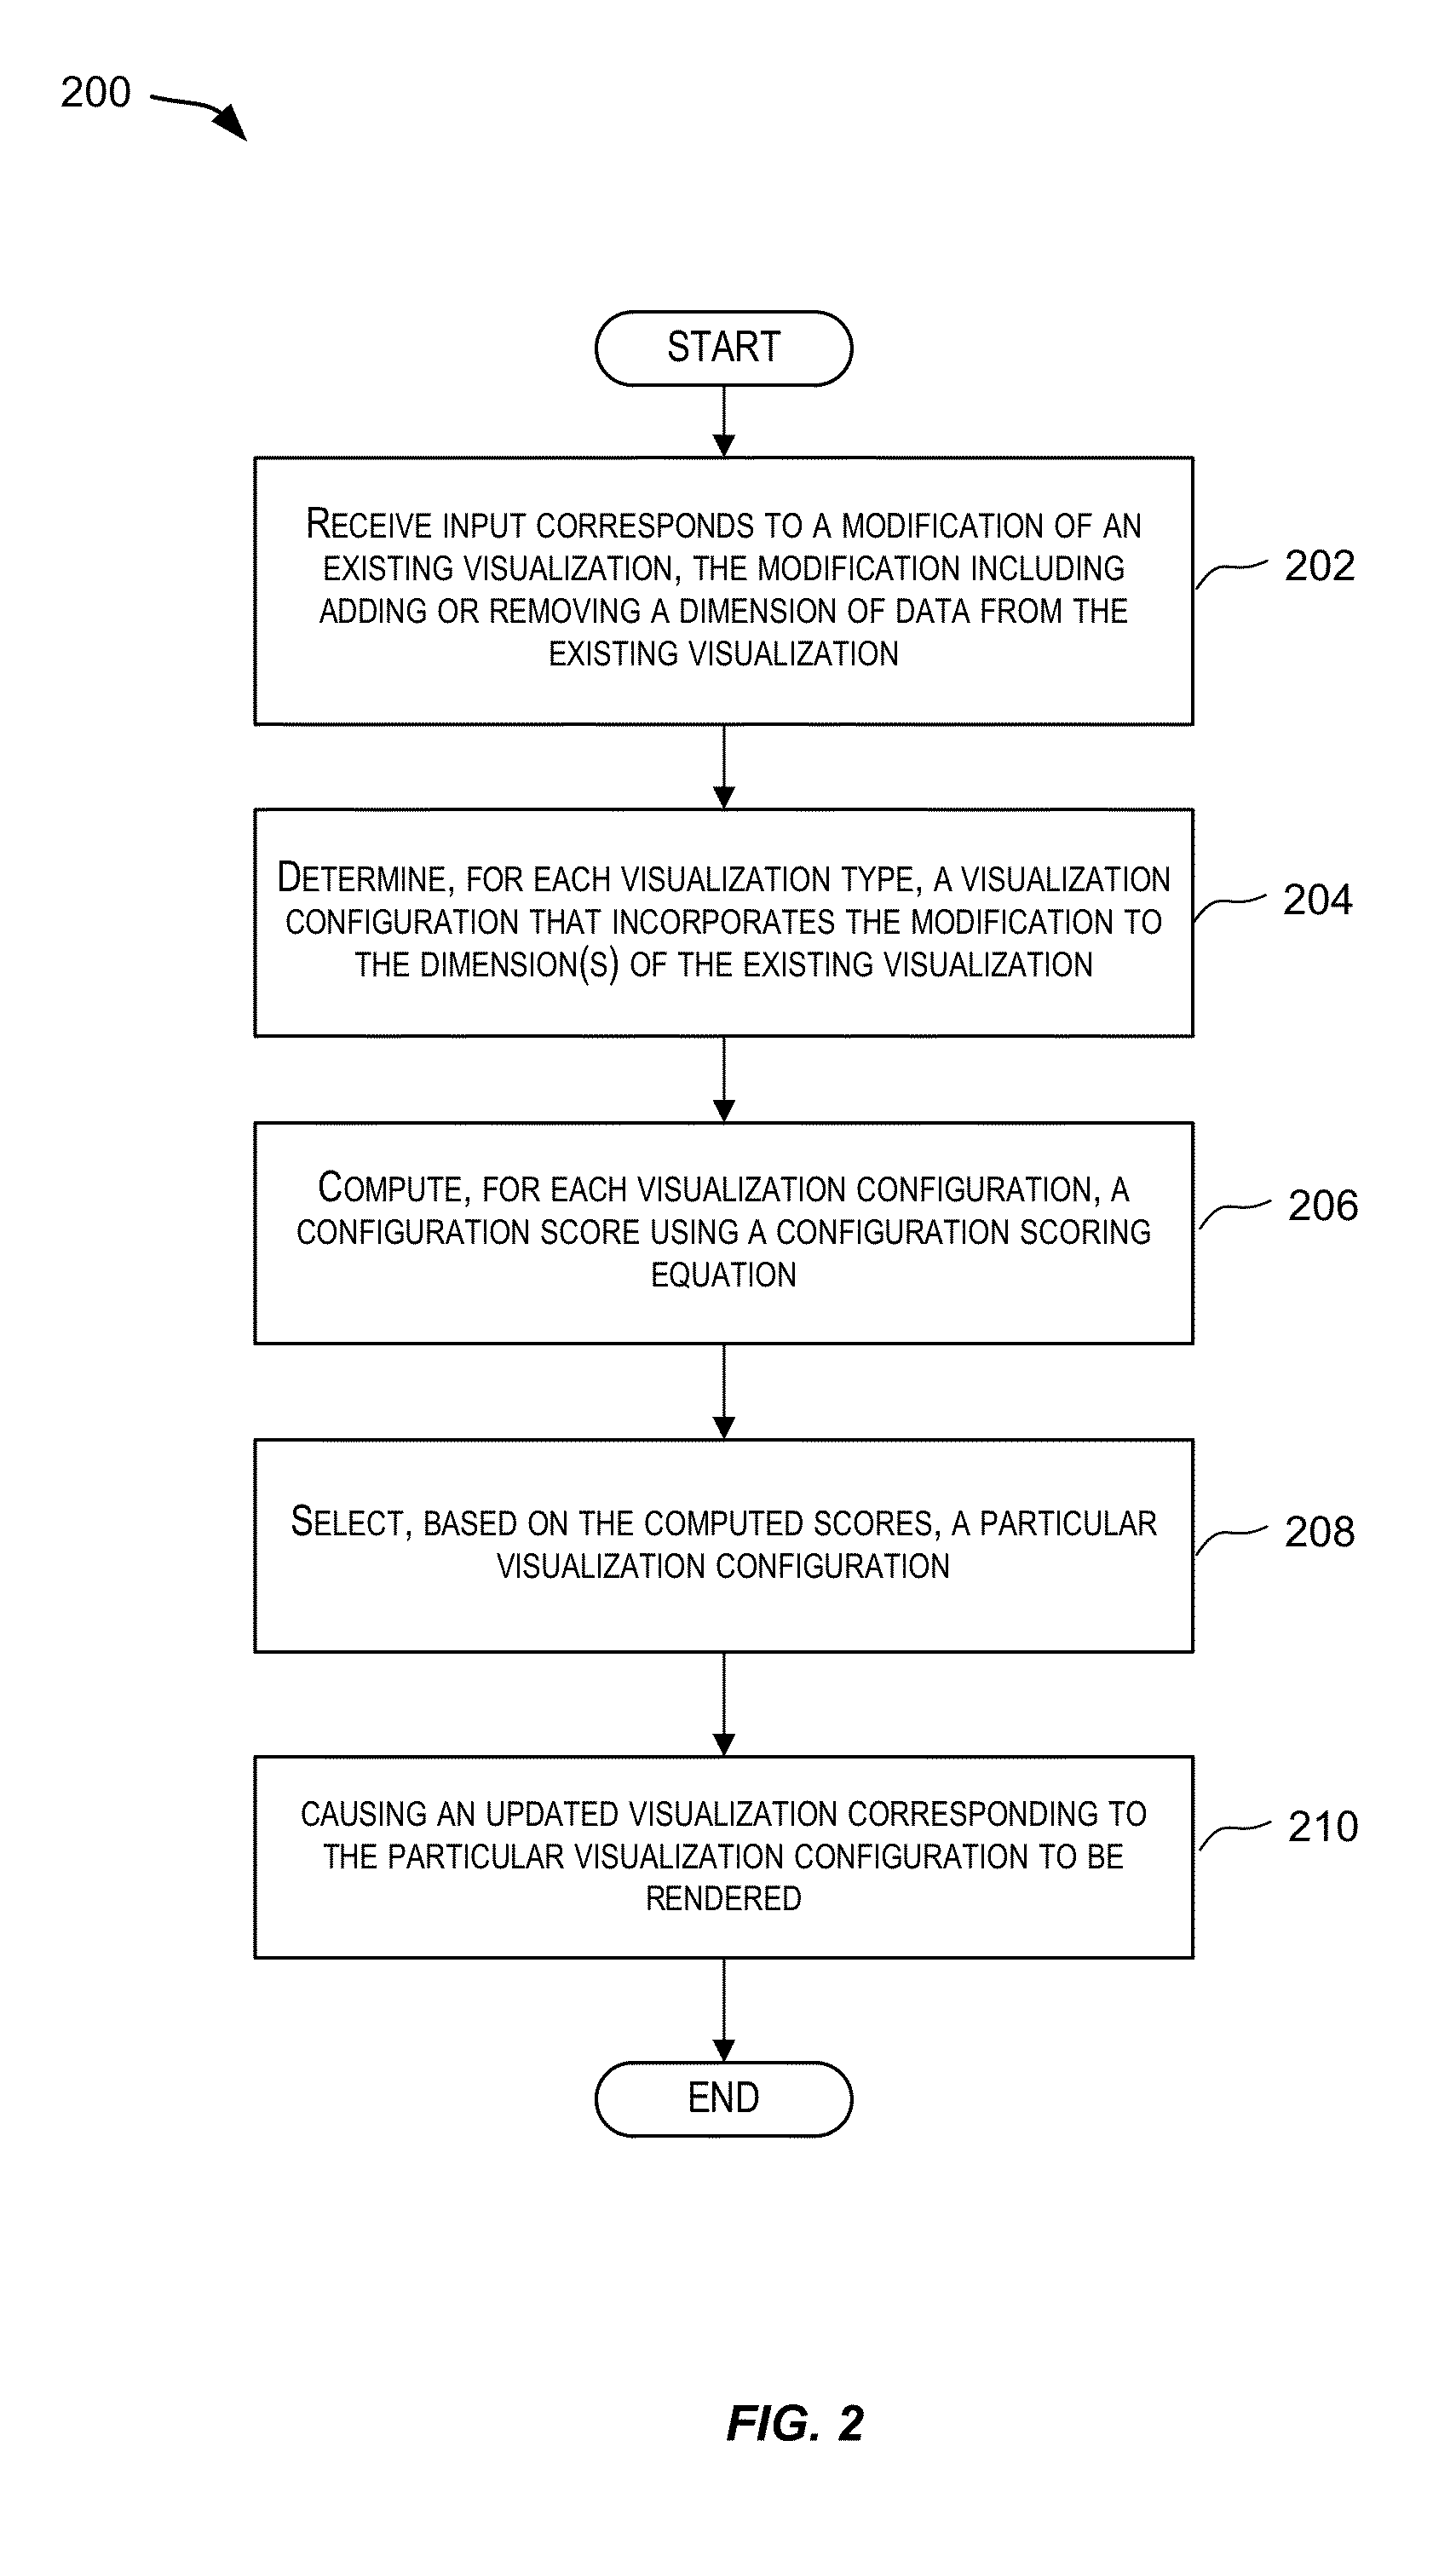
[0025]In certain embodiments, techniques (including systems, devices, methods, code or program instructions executed by one or more computer processors) are provided for effective presentation of data to a user using a graphic visualization. Some embodiments provide a visual analyzer system that can update an existing visualization upon receiving a user request to modify one or more dimensions of the data being presented by the visualization. In some embodiments, the user input can correspond to the addition or a removal of a dimension of data to an existing visualization. In certain embodiments, the visual analyzer system can determine multiple...


PUM


Abstract

Embodiments provide a visual analyzer system that can update an existing visualization upon receiving a user request to modify a dimension of data being presented by the visualization. Embodiments may provide an updated visualization, possibly of a different visualization type and/or with pre-existing dimensions mapped to different edges, without requiring any user specification of which dimensions to be mapped to which edges of the visualization. The system can determine configurations for the various visualization types and compute, for each configuration, a visualization score. Based on the scores, the system can select a configuration and render the updated visualization on a graphical user interface (GUI) to the user. Further, in response to user specification to change a representation of data from one visualization type to another, embodiments may determine an effective and intuitive manner in which to present the same set of data in the visualization of the other type.

Description

CROSS-REFERENCES TO RELATED APPLICATIONS[0001]This application is a non-provisional application and claims the benefit and priority of U.S. Provisional Application No. 62 / 056,404, filed on Sep. 26, 2014, titled “SEMANTIC DISTANCE-BASED ASSIGNMENT OF DATA ELEMENTS TO VISUALIZATION EDGES,” and U.S. Provisional Application No. 62 / 079,363, filed on Nov. 13, 2014, titled “VISUAL ANALYZER SYSTEM,” both of which are herein incorporated by reference in their entirety for all purposes.BACKGROUND[0002]Generating graphic visualizations that can be readily intuitive to a user presents significant challenges as there are countless variations in which data can be assembled and presented to the user. For example, while a type of visualization (e.g., a bar chart, a pie chart) may accommodate multiple dimensions of data (e.g., revenue, company, year), changes in the values or the numbers of the dimensions of data to be presented by the visualization often cause the presentation of the data to be dif...

Claims


Application Information

Patent Timeline
IPC IPC(8): G06F3/0484G06F17/21
CPCG06F17/212G06F3/04842G06F3/04847G06F16/904G06F40/106
Inventor LAGERBLAD, BO, JONAS, BIRGERRAJ, ALVIN, ANDREWDYAR, SAMUEL, STEPHEN
Owner ORACLE INT CORP
Why Eureka
Try Eureka