System and method and graphical interface for performing predictive analysis and prescriptive remediation of patient flow and care delivery bottlenecks within emergency departments and hospital systems

a technology for emergency departments and hospital systems, applied in the field of hospitals, can solve the problems of inefficiency of alert management, no system that identifies, no system presently exists that measures the queue depth of each process step,

Active Publication Date: 2018-11-01
DREYER JEFFREY RANDALL
View PDF7 Cites 15 Cited by
  • Summary
  • Abstract
  • Description
  • Claims
  • Application Information

AI Technical Summary

Benefits of technology

[0031]The present invention has a set of uniquely structured graphical user interfaces comprised of multiple display screens to visualize the bottlenecks, current and historic patient arrival and acuity patterns, patients who have left without being seen (LWBS), and bed resource status and opportunities. These specifically structure interfaces allowing users and management to quickly prioritize and mobilize resources to improve patient flow, therefore improving quality of care and patient safety.
[0032]The present invention facilitates the management of resources by providing an integrated dashboard view that allows users to easily visualize the conditions of the emergency room in combination with the status of the beds in the emergency room, to quickly assess the situation, and to assist in managing ED resources.
[0037]The present invention also analyzes operating room schedules and admission and discharge queues and patterns, assisting in planning of inpatient bed resources. For example, every day, each hospital nursing unit inputs the discharges for that day, anticipated and definite. The surgical schedule notes potential and definite admissions and which type of nursing floor the patient will need to go. The ED has an anticipated daily admission volume and types of beds needed. The present invention performs a demand capacity model for the above and will alert the user or management of possible bottlenecks and of which patients. The surgical schedule can then be reordered to assist in patient flow from surgery to recovery to hospital bed.

Problems solved by technology

There is currently no system that identifies, in a live environment, variations in testing and treatment flow.
Furthermore, no system presently exists that measures queue depth of each process step, and alert's management, in an escalating fashion, when queue depth, time in queue or a combination of the two is above specified levels.
As a result, hospitals and emergency departments (ED) are inefficient, causing patients to wait for care.
Waiting for care decreases the quality of care and increases morbidity, mortality and expense.
The cause is multifactorial and includes inefficient utilization of hospital and emergency department bed resources, due to poor processes in testing, treating and dispositioning patients and management of these resources.
Inefficient hospital bed turnover leads to bottlenecks in transporting ED admitted patients and other admitted patients to these beds. in most hospitals, between 60 and 80% of the patients in hospital beds come through the ED.
Inefficient ED flow causes patients to IL BS which impacts the hospital's reputation, revenue reimbursement, and effects patient care quality.
Managing the flow of hospitalized patients discharge and subsequent bed turnover a management challenge as most admissions and discharges occur between 11 am and 9 pm.

Method used


Image

  • System and method and graphical interface for performing predictive analysis and prescriptive remediation of patient flow and care delivery bottlenecks within emergency departments and hospital systems
  • System and method and graphical interface for performing predictive analysis and prescriptive remediation of patient flow and care delivery bottlenecks within emergency departments and hospital systems
  • System and method and graphical interface for performing predictive analysis and prescriptive remediation of patient flow and care delivery bottlenecks within emergency departments and hospital systems

Examples


Embodiment Construction

)

[0072]The following detailed description of the example embodiments refers to the accompanying figures that form a part thereof. The detailed description provides explanations by way of exemplary embodiments. It is to be understood that other embodiments may be used having mechanical and electrical changes that incorporate the scope of the present invention without departing from the spirit of the invention.

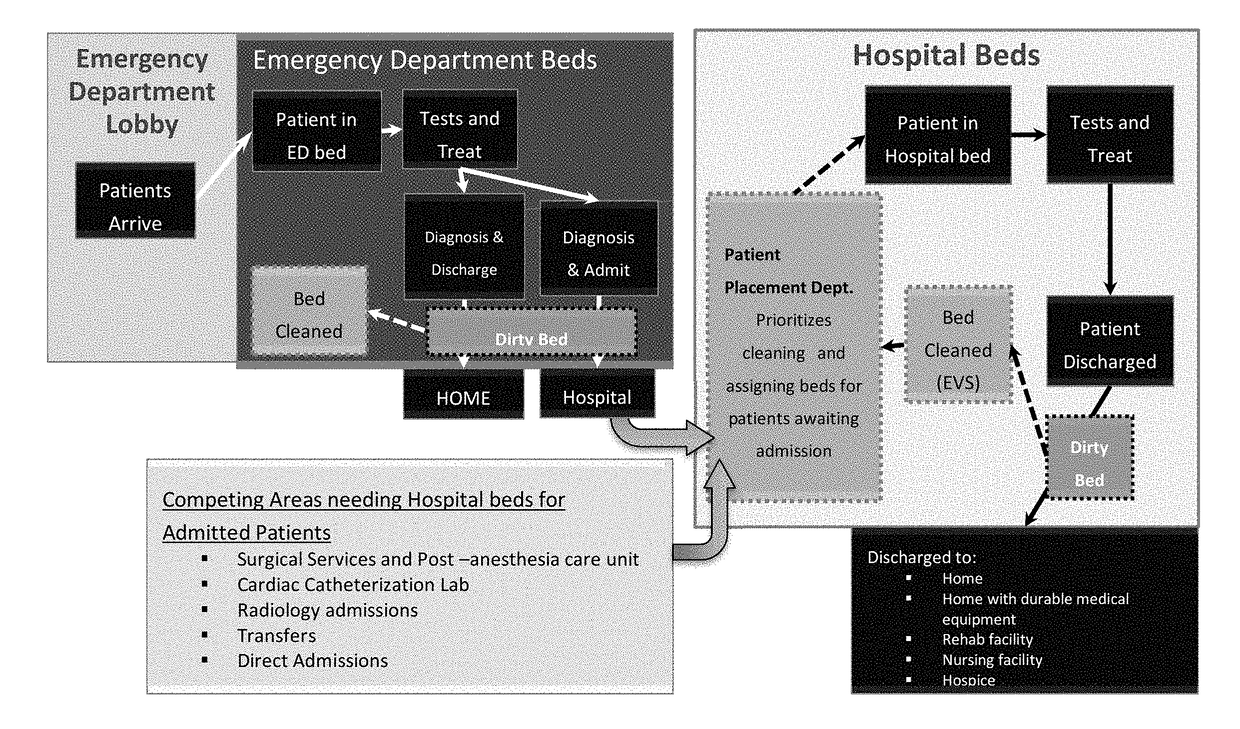
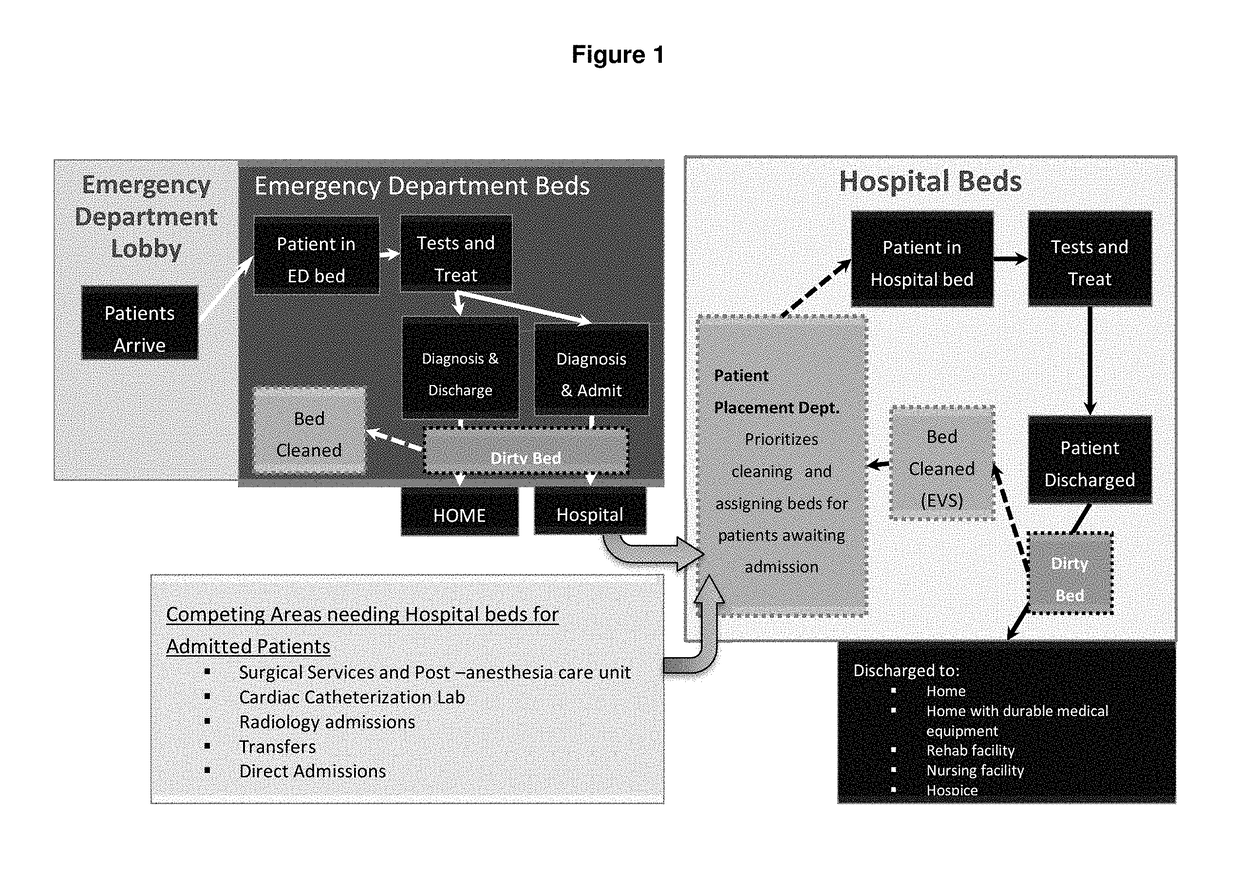
[0073]The present invention uses time stamp data to analyze and identify arrival patterns, processes, and patient acuity variations causing bottlenecks and inefficient use of bed resources, testing resources, staff resources, and pharmacy resources. The processes involve multiple components. These components are the hospital, the emergency department, the operating room and post-anesthesia care unit, the cardiac catheterization laboratory, and the radiologic procedure room, transfers to the hospital from other hospitals and direct admissions to the hospital.

[0074]FIG. 1 illustra...


PUM


Abstract

A system and method for tracking emergency room patients, resources and queues and for providing a unified graphical interface structure for facilitating process flow improvements and resource management. The system has a graphical user interface adapted to display in a first screen, the graphical interface having a triage region, bed status region, and patient arrival and acuity surge regions. The specific structure and layout of the graphical user interface aids the hospital staff in quickly and efficiently providing a graphical and unified view of hospital process bottlenecks and resource availability and opportunities. The system analyzes resources and predicts needed actions and alerts appropriate staff and notifies of prescribed actions.

Description

BACKGROUND OF THE INVENTIVE FIELD[0001]The present invention is directed to field of managing resources in hospitals. More specifically, the present invention relates to a system and method for facilitating the identification of bottlenecks and problem areas in emergency room and patient care processes by tracking and providing a unique graphical user interface structure that presents a unique combination of features and data in an interactive, unified, graphical manner. The present invention also provides a uniquely structured interface for presenting hospital demand and capacity versus daily planned occupancy and for providing escalating alerts to predetermined hospital staff based on combinations of information. The present invention tracks patient arrival demand and capacity, arrival volume and hospital demand capacity by time of day to prescribe actions by staff and management.[0002]Currently, live streaming multisource data that analyzes, identifies, monitors and alerts users ...

Claims


Application Information

Patent Timeline
Patent Type & Authority Applications(United States)
IPC IPC(8): G06F19/00
CPCG16H40/20G16H40/63
Inventor DREYER, JEFFREY RANDALL
Owner DREYER JEFFREY RANDALL
Why Eureka
Try Eureka