Method for determining indicators regarding the polluting nature of mobility taking real usage into account

Active Publication Date: 2019-04-04
INST FR DU PETROLE
View PDF0 Cites 10 Cited by
  • Summary
  • Abstract
  • Description
  • Claims
  • Application Information

AI Technical Summary

Benefits of technology

[0126]The method can be used to record, over a trip, the data nec

Problems solved by technology

However, for a given vehicle and a given route, pollutant emission levels can vary significantly as a function of the manner in which the vehicle is driven.
Although it is real, relatively little is yet known about this impact, as it is still difficult to quantify apart from using extremely expensive laboratory instrumentation.
However, that method only takes trips in a motorized vehicle into account, and not the user's style of driving, and does not allow eco-driving guidance to be generated.
The most widely known implementation of this approach is known as COPERT, but that approach does not take real use into

Method used


Image

  • Method for determining indicators regarding the polluting nature of mobility taking real usage into account
  • Method for determining indicators regarding the polluting nature of mobility taking real usage into account
  • Method for determining indicators regarding the polluting nature of mobility taking real usage into account

Examples


example 1

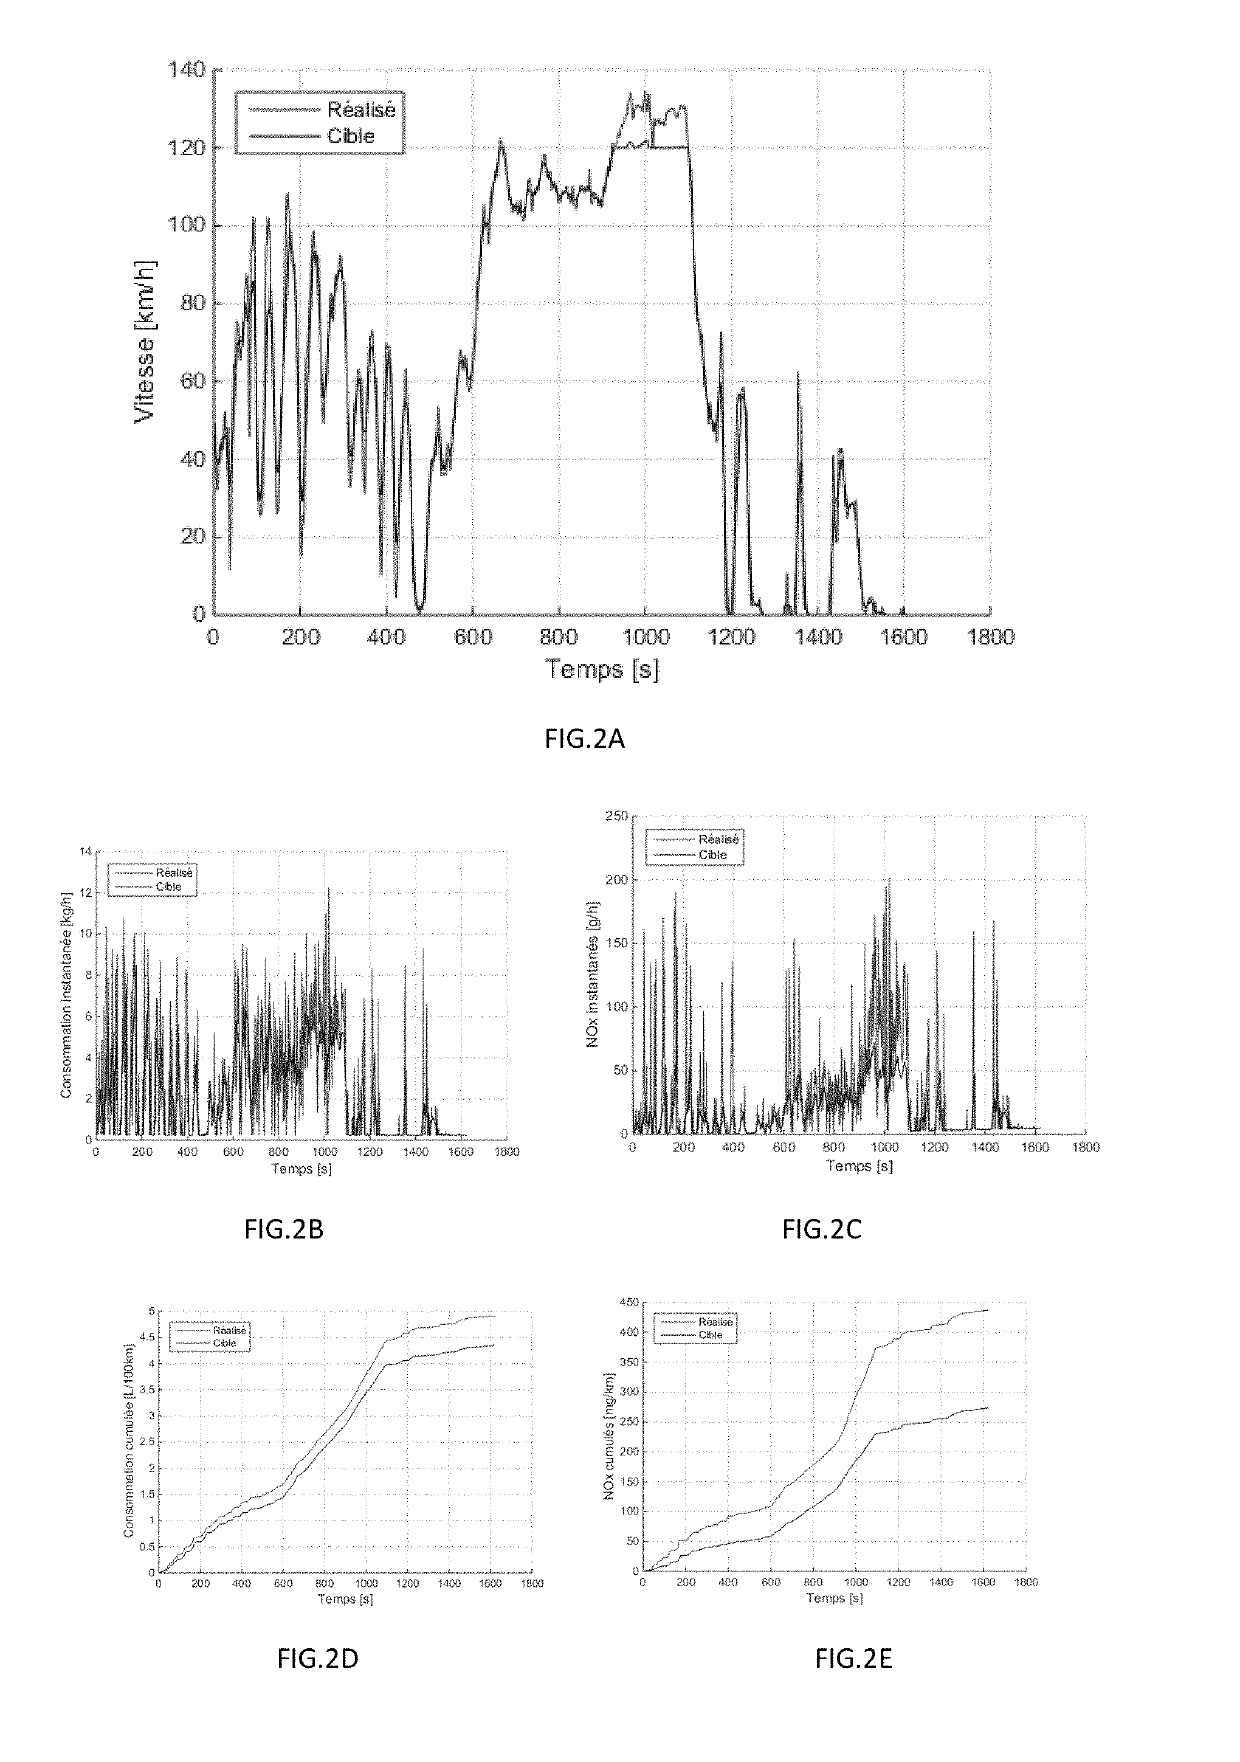
[0127]Example 1 below illustrates a real case of breaking down the pollution footprint determined for each motorized vehicle trip as well as the determination of the potential for improvement. By generating a target speed profile representative of an optimal style of driving, the method in accordance with the invention can be used to precisely quantify the potential for improvement linked to the style of driving for a route travelled with a given vehicle. FIG. 2 illustrates a comparison between a generated target speed profile and a real speed profile for the same route (FIG. 2A) and the potential savings in fuel consumption (instantaneous in kg / h FIG. 2B, and cumulative in L / 100 km, FIG. 2D) and oxides of nitrogen emissions (instantaneous in g NOx / h in FIG. 2C, and cumulative emissions in mg NOx / km, FIG. 2E) as a function of time (in s) for a diesel vehicle. It will be observed that it is possible to significantly reduce pollution emissions with minor modifications to the way of dr...

example 2

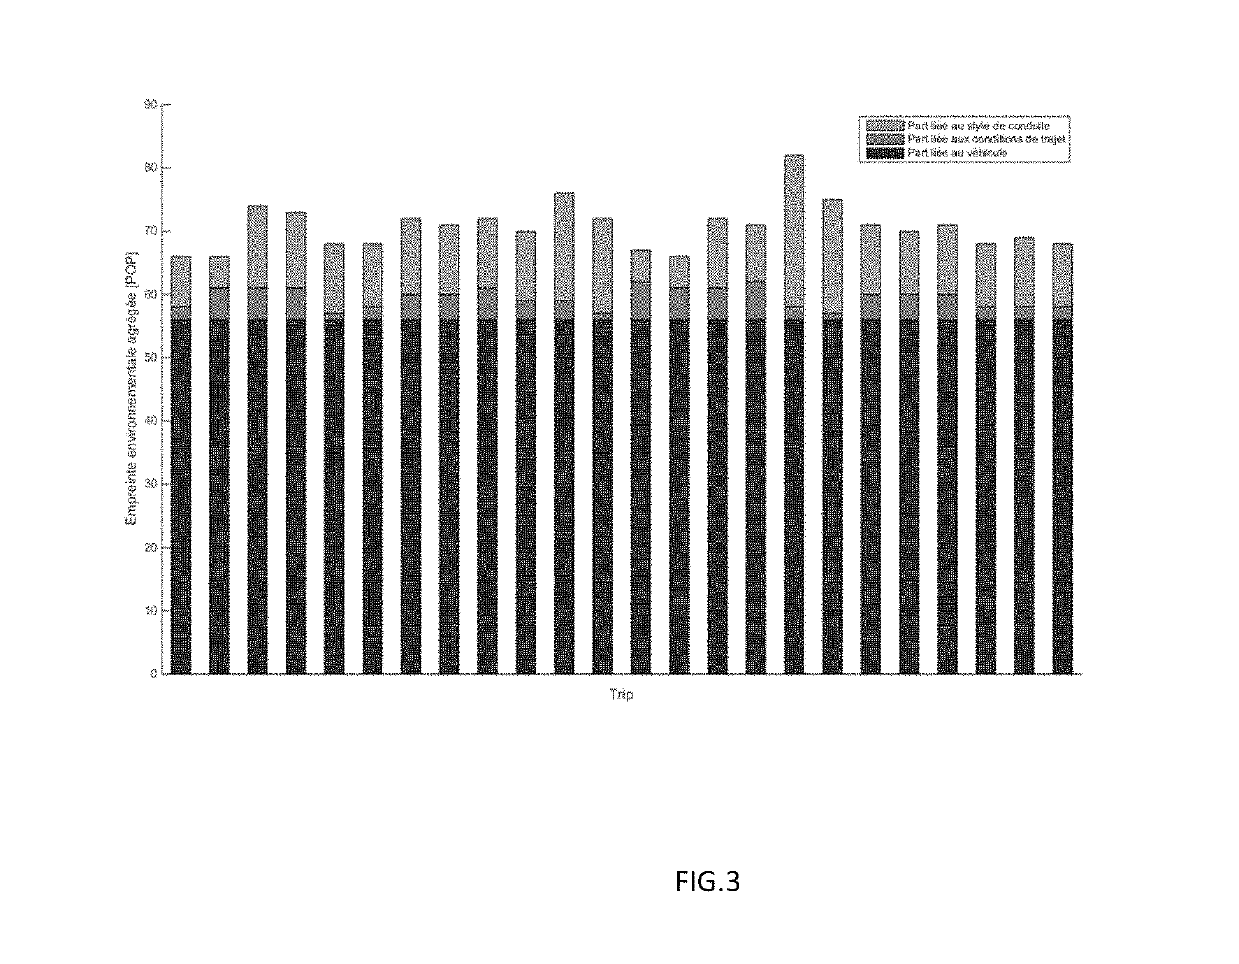
[0128]Example 2 illustrates the breakdown of factors having an impact on pollution emissions for 24 different users driving the same vehicle over the same route. FIG. 3 represents, in the form of histograms, the aggregated environmental footprint broken down into a portion linked to style of driving, a portion linked to the route conditions and a portion linked to the vehicle, as a function of the driver. This figure illustrates the function of the algorithm which can be used to determine the portion of pollution emissions linked to the style of driving in the overall pollution footprint (aggregated environmental footprint, POP). In fact, for the same route and the same vehicle, it will be observed that the pollution level varies substantially as a function of the driver. However, the difficulty is to estimate, from a single transit, whether there is a potential for improvement to the pollution emissions linked to improving the style of driving. It will be observed that for differen...


PUM


Abstract

The invention is a method for determining indicators of pollution from overall mobility of a user, comprising detecting trips in soft modes of transport and trips in motorized vehicles by use of a smart phone; determining a real environmental footprint linked to pollution emissions for each trip in a motorized vehicle by use of a model which estimates pollution emissions by accounting for macroscopic characteristics of the vehicle and a real speed profile representing the style of driving of the user; determining a target environmental footprint from each of the motorized vehicle trips by accounting for a target speed profile representing an optimal style of driving in the model for estimating pollution emissions; and breaking down the environmental footprint for each of the motorized vehicle trips into a footprint linked to the vehicle, and to a style of driving to a type of route and; determining an overall environmental footprint for the mobility of the user by accounting for all trips in soft modes of transport and trips in motorized vehicles over a given time interval, and determining at least one of driving indicators and environmental impact indicators for the user's overall mobility.

Description

CROSS REFERENCE TO RELATED APPLICATIONS[0001]Reference is made to French Application No. 17 / 59.129 filed Sep. 29, 2017, which is incorporated herein by reference in its entirety.FIELD OF THE INVENTION[0002]The present invention relates to the field of eco-driving, and more generally to that of qualifying the polluting nature of the overall mobility of a user.DESCRIPTION OF THE PRIOR ART[0003]Currently, improving air quality is a priority for cities. In order to arrive at this, the current prevailing solution is prohibiting certain vehicles deemed to be too polluting from going on the roads (for example, CRIT' AIR stickers). However, for a given vehicle and a given route, pollutant emission levels can vary significantly as a function of the manner in which the vehicle is driven. Although it is real, relatively little is yet known about this impact, as it is still difficult to quantify apart from using extremely expensive laboratory instrumentation.[0004]The Applicant's French patent ...

Claims


Application Information

Patent Timeline
IPC IPC(8): G07C5/08G07C5/00G01N33/00G01C21/36
CPCG07C5/0841G07C5/0808G07C5/008G01N33/0004G01C21/3697B60W50/00F02D41/1453F02D41/1462F02D41/1465F02D41/1467F02D2200/501F02D2200/101F02D2200/1004F02D2200/701F02D2041/1433G06Q10/08G06Q50/30B60W40/12B60W40/08B60W40/09
Inventor THIBAULT, LAURENTDEGEILH, PHILIPPECORDE, GILLES
Owner INST FR DU PETROLE
Why Eureka
Try Eureka