Failure analysis of a measuring sensor with an integrated temperature sensor
- Summary
- Abstract
- Description
- Claims
- Application Information
AI Technical Summary
Benefits of technology
Problems solved by technology
Method used
Image

Examples
Example
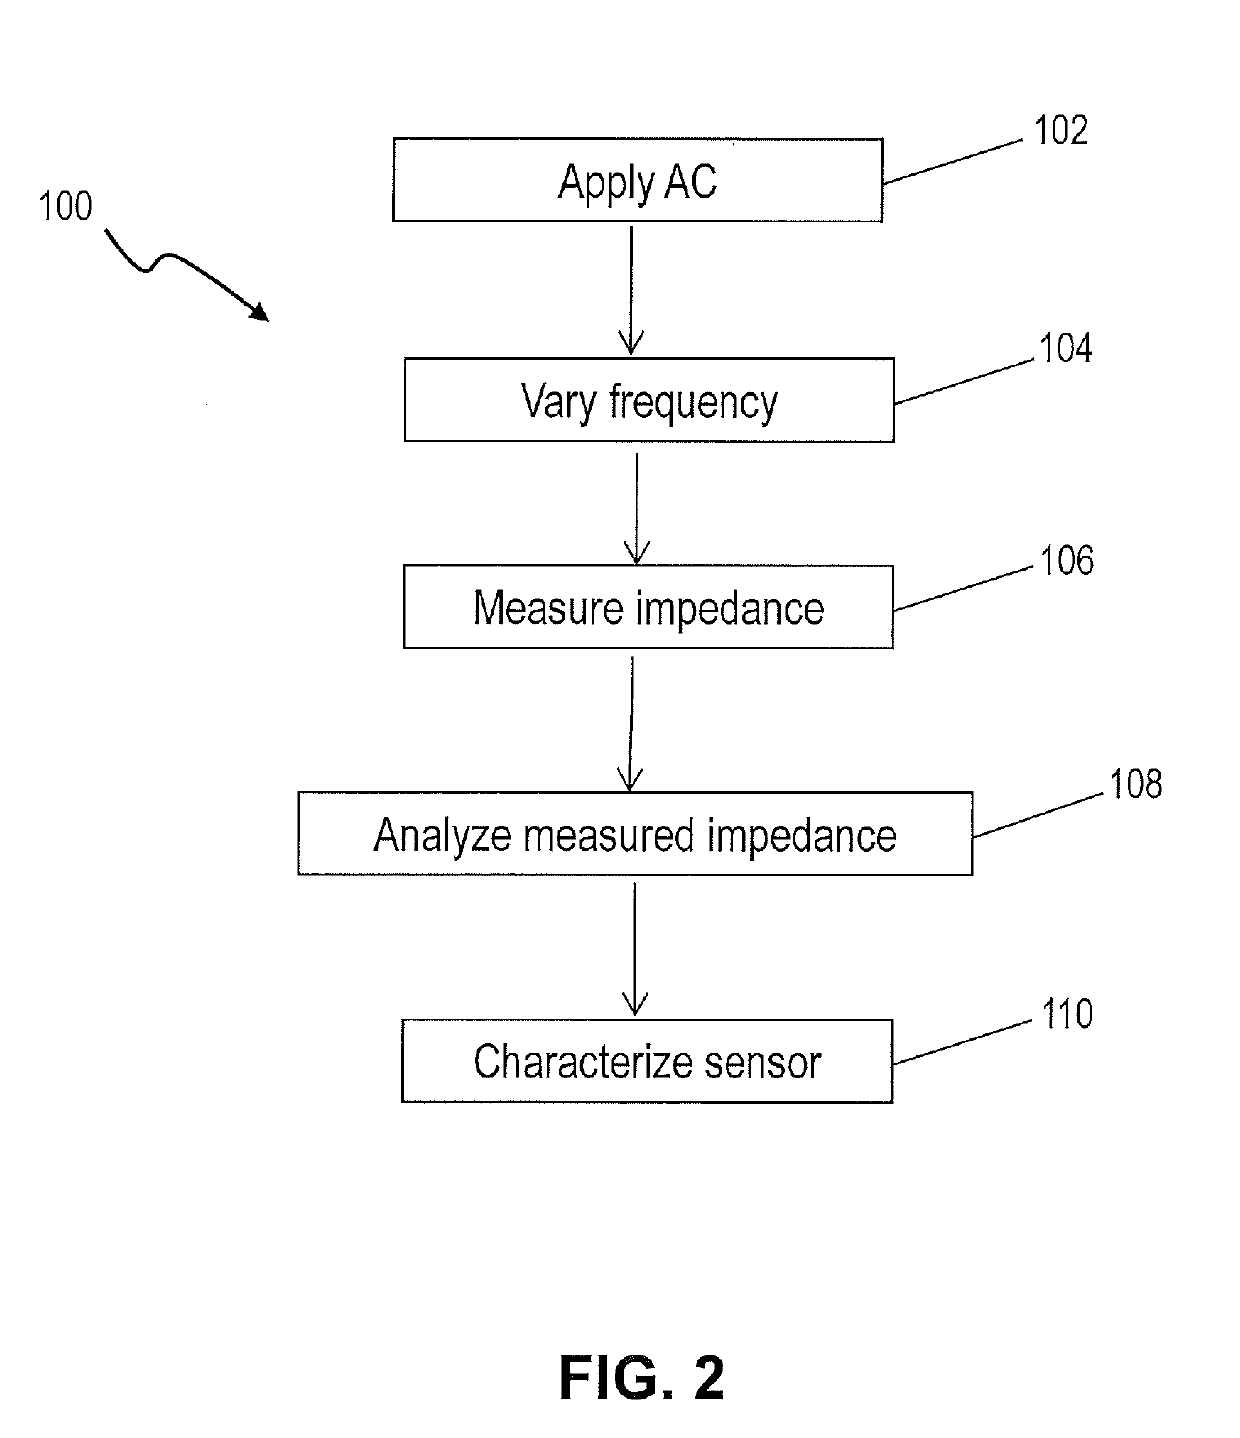
[0051]Experiment 1
[0052]Two sensor types (A: single junction pH sensor with liquid reference electrolyte; B: double junction pH sensor with wetted solid reference electrolyte) and totally six sensors were analyzed using the method 100. An initial pH test was conducted on each sensor in three buffer solutions, pH 4, 7 and 10 using the CM42 pH meter. The voltage output results (in mV) are contained in Table 1. The test data indicate that each of the sensors was not working properly except B-3, which was within specification in all three buffer solutions.
TABLE 1Initial pH Test DatamV reading in pH buffersmV readingmV reading4710impedance (MΩ)pH - Ref (ext.)Ref - Ref (ext.)Sensor177.5 ± 120 ± 12−177.5 ± 12in buffer 4in buffer 4in buffer 4A-1no reading064no readingA-2no reading0163no readingA-3124−45−21652517645B-110711−85583179no readingB-212824−124444175no readingB-3168−6−180759180no reading
[0053]Sensors A-1 and A-2 both showed zero impedance between pH and reference (Ref) electrodes, ...
Example
[0058]Experiment 2
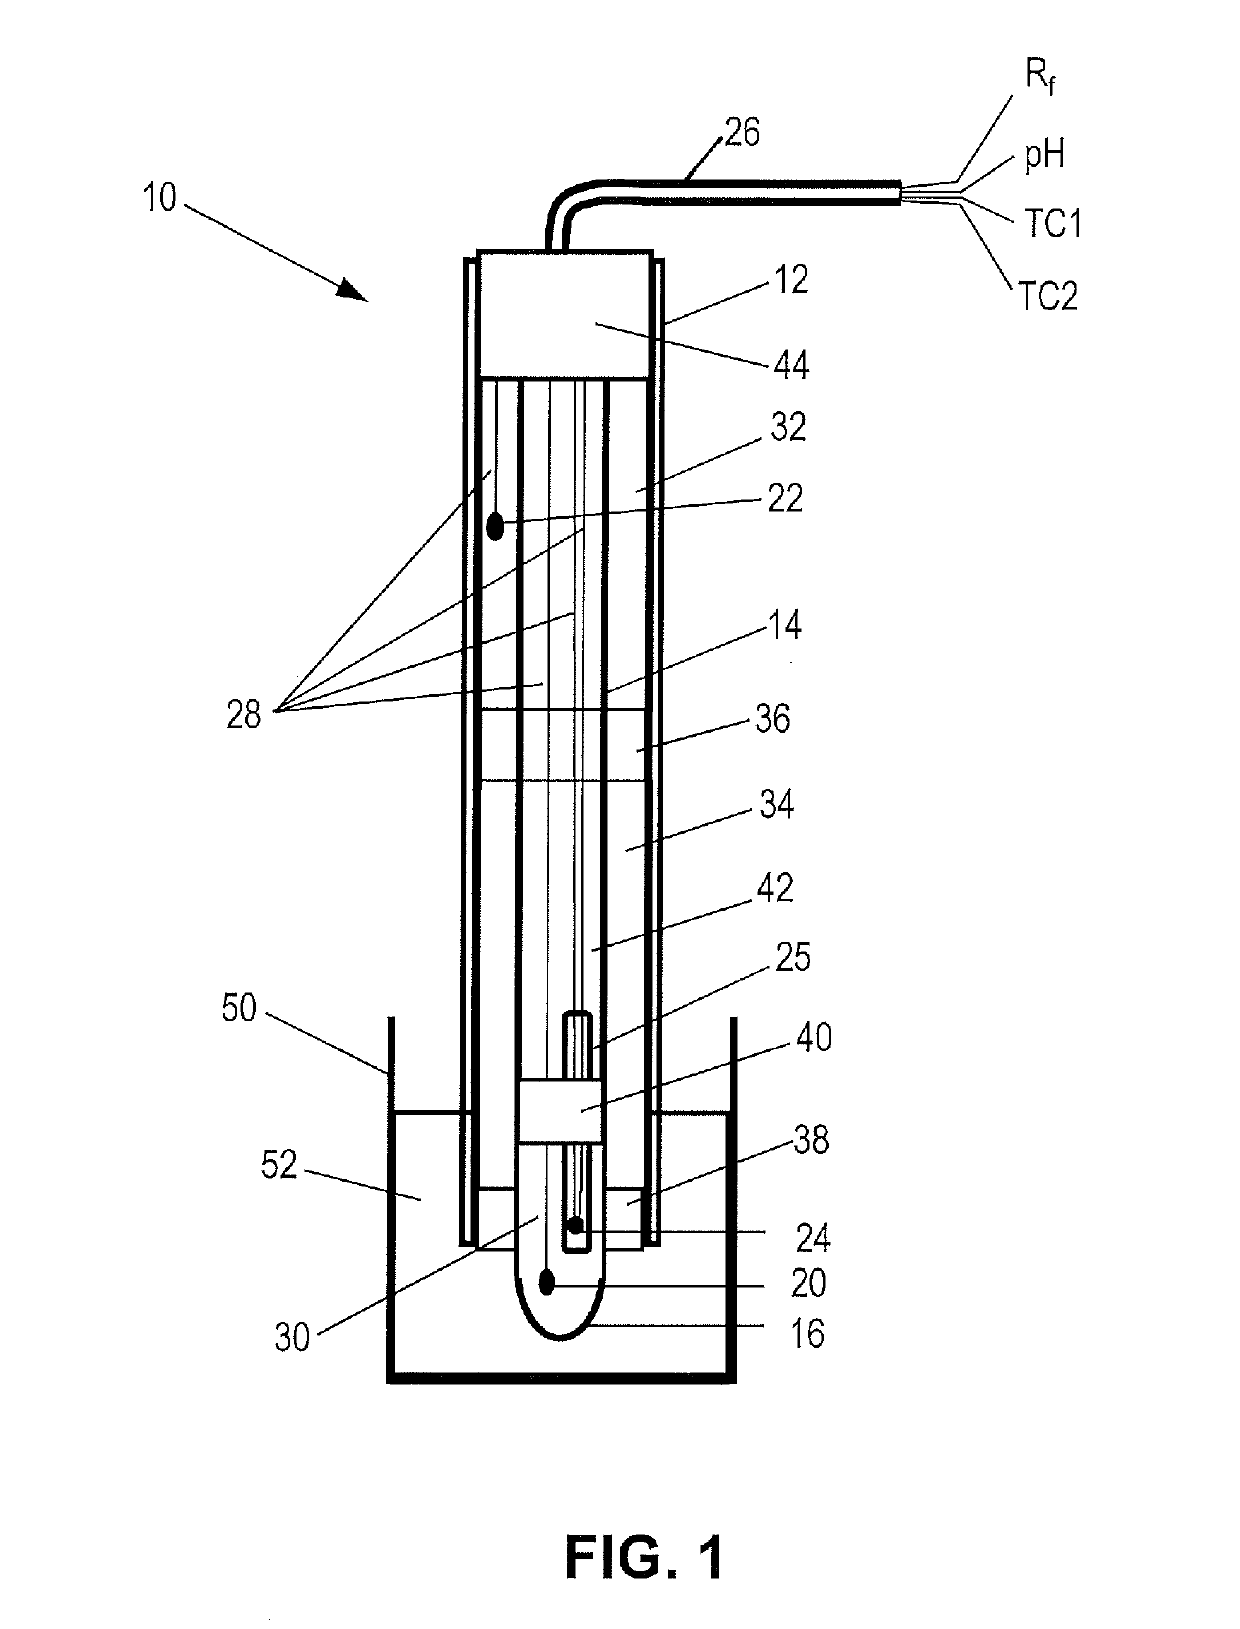
[0059]The method 100 was further applied to characterize and analyze the effects of steam sterilization on the glass membrane in a pH sensor, such as the sensor 10. Steam sterilizable (“SS”) pH sensors having membranes made with old SS glass and new SS glass were tested and compared with two SS pH sensors made by other manufactures (i.e., Sensors C1 and C2). The terms old SS glass and new SS glass simply indicate two different types of glass membranes used in the sensors under test. One means of simulating the effects of the steam sterilization process on a pH sensor is to condition the sensor in a steam-in-place (“SIP”) test. The SIP test used in each experiment disclosed herein included inserting at least the membrane of the pH sensor in a pipe conveying steam of at least 100° C. for 30 minutes, cooling the sensor down to room temperature, then repeating the steam exposure and cooling processes for a total of three cycles. After the SIP test, the sensors were soa...
Example
[0079]Experiment 4
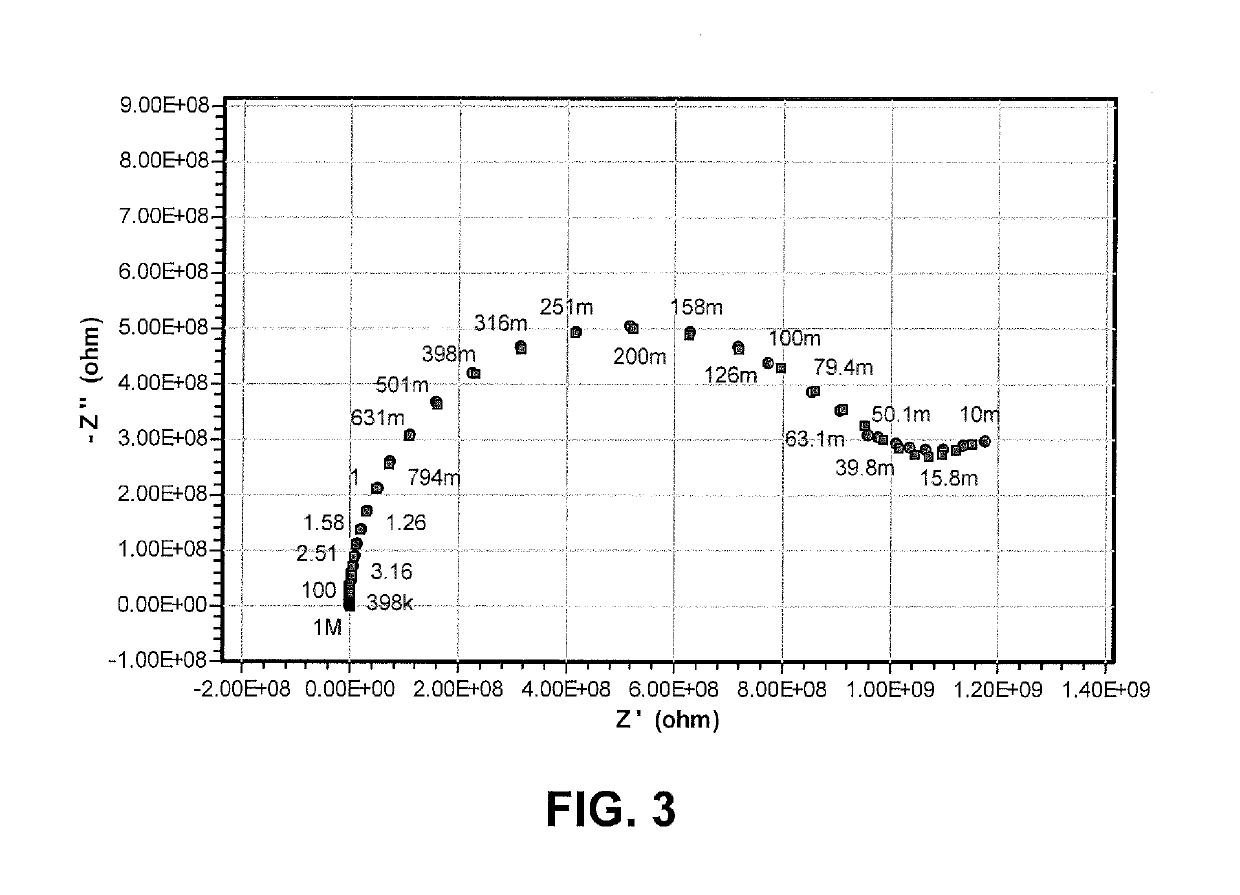
[0080]The method 100 was applied to several sensors returned from operation in the field. FIG. 13 shows a Nyquist plot of the measured impedance frequency response spectrum of the returned sensors, including sensors with defects, labeled A, B, C and D, and one without a defect, labeled F. The outer tips of the response curves indicate the response at the 1 Hz, low frequency end, extending toward the plot origin at a high-end frequency of 300 kHz. The sensor response labeled G shows the response of an idealized impedance between a working electrode and an integrated temperature sensor, represented by 10 linear feet of cable. As shown in FIG. 13, the plot for the idealized Sensor G shows a nearly vertical line with a large (e.g., greater than 250 MΩ) total impedance at 1 Hz including a positive imaginary component and a small, positive real component. Because in general a diameter of an impedance frequency response spectrum is proportional to the insulation resistanc...
PUM
 Abstract
Description
Claims
Application Information
 - R&D Engineer
- R&D Manager
- IP Professional
- Industry Leading Data Capabilities
- Powerful AI technology
- Patent DNA Extraction
Browse by: Latest US Patents, China's latest patents, Technical Efficacy Thesaurus, Application Domain, Technology Topic.
© 2024 PatSnap. All rights reserved.Legal|Privacy policy|Modern Slavery Act Transparency Statement|Sitemap