Immune age and use thereof
- Summary
- Abstract
- Description
- Claims
- Application Information
AI Technical Summary
Benefits of technology
Problems solved by technology
Method used
Image

Examples
example 1
nal Tracking of Multiple Immune-Features
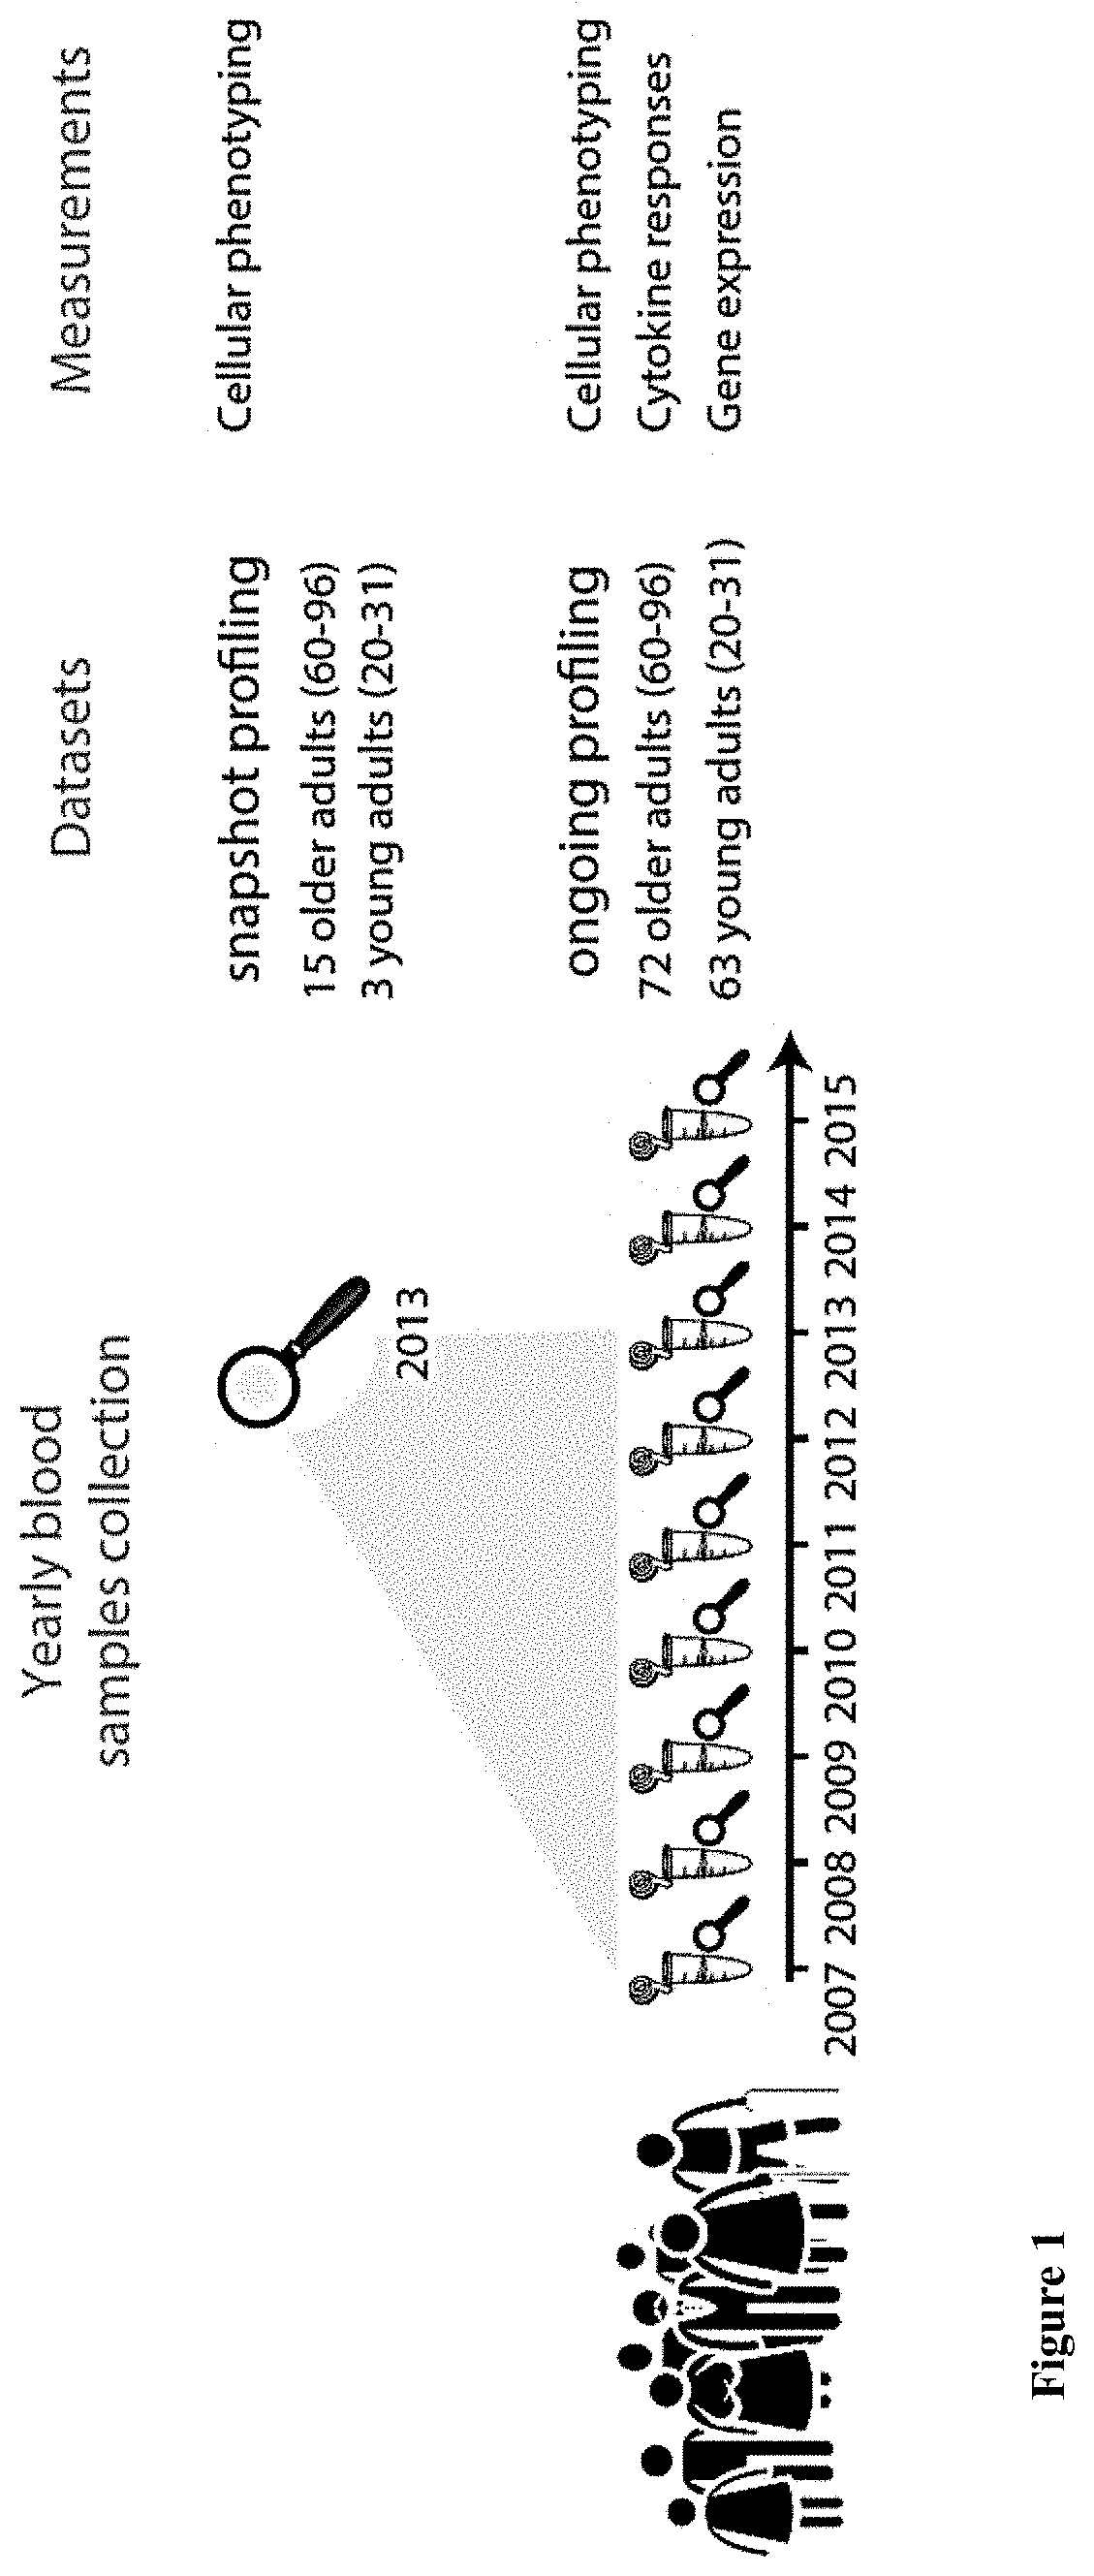
[0171]To assess at high-resolution the dynamics of older adults' immune-system, we conducted a multi-omics profiling of peripheral blood samples collected annually from young and older adults during the years 2007-2015 as part of Stanford-Ellison longitudinal aging study. The cohort included 135 healthy individuals: 63 young (aged 20-31 at enrollment) and 72 older adults (aged 60-96 at enrollment) (FIG. 7A-C, Methods). Samples were profiled by two experimental designs that yielded two datasets: An ongoing design, in which samples were profiled annually using a suite of technological platforms available at that time for measuring cellular phenotyping, cytokine-stimulation assays and whole-blood gene-expression (Methods); And a snapshot design, in which longitudinal samples of 18 participants of the ongoing dataset (3 young, 15 older-adults) were assayed simultaneously for deep phenotyping of blood cell subsets by mass-cytometry, thereby removin...
example 2
ls' Cellular Immune-Profiles Vary in their Baseline Values and Rates of Change
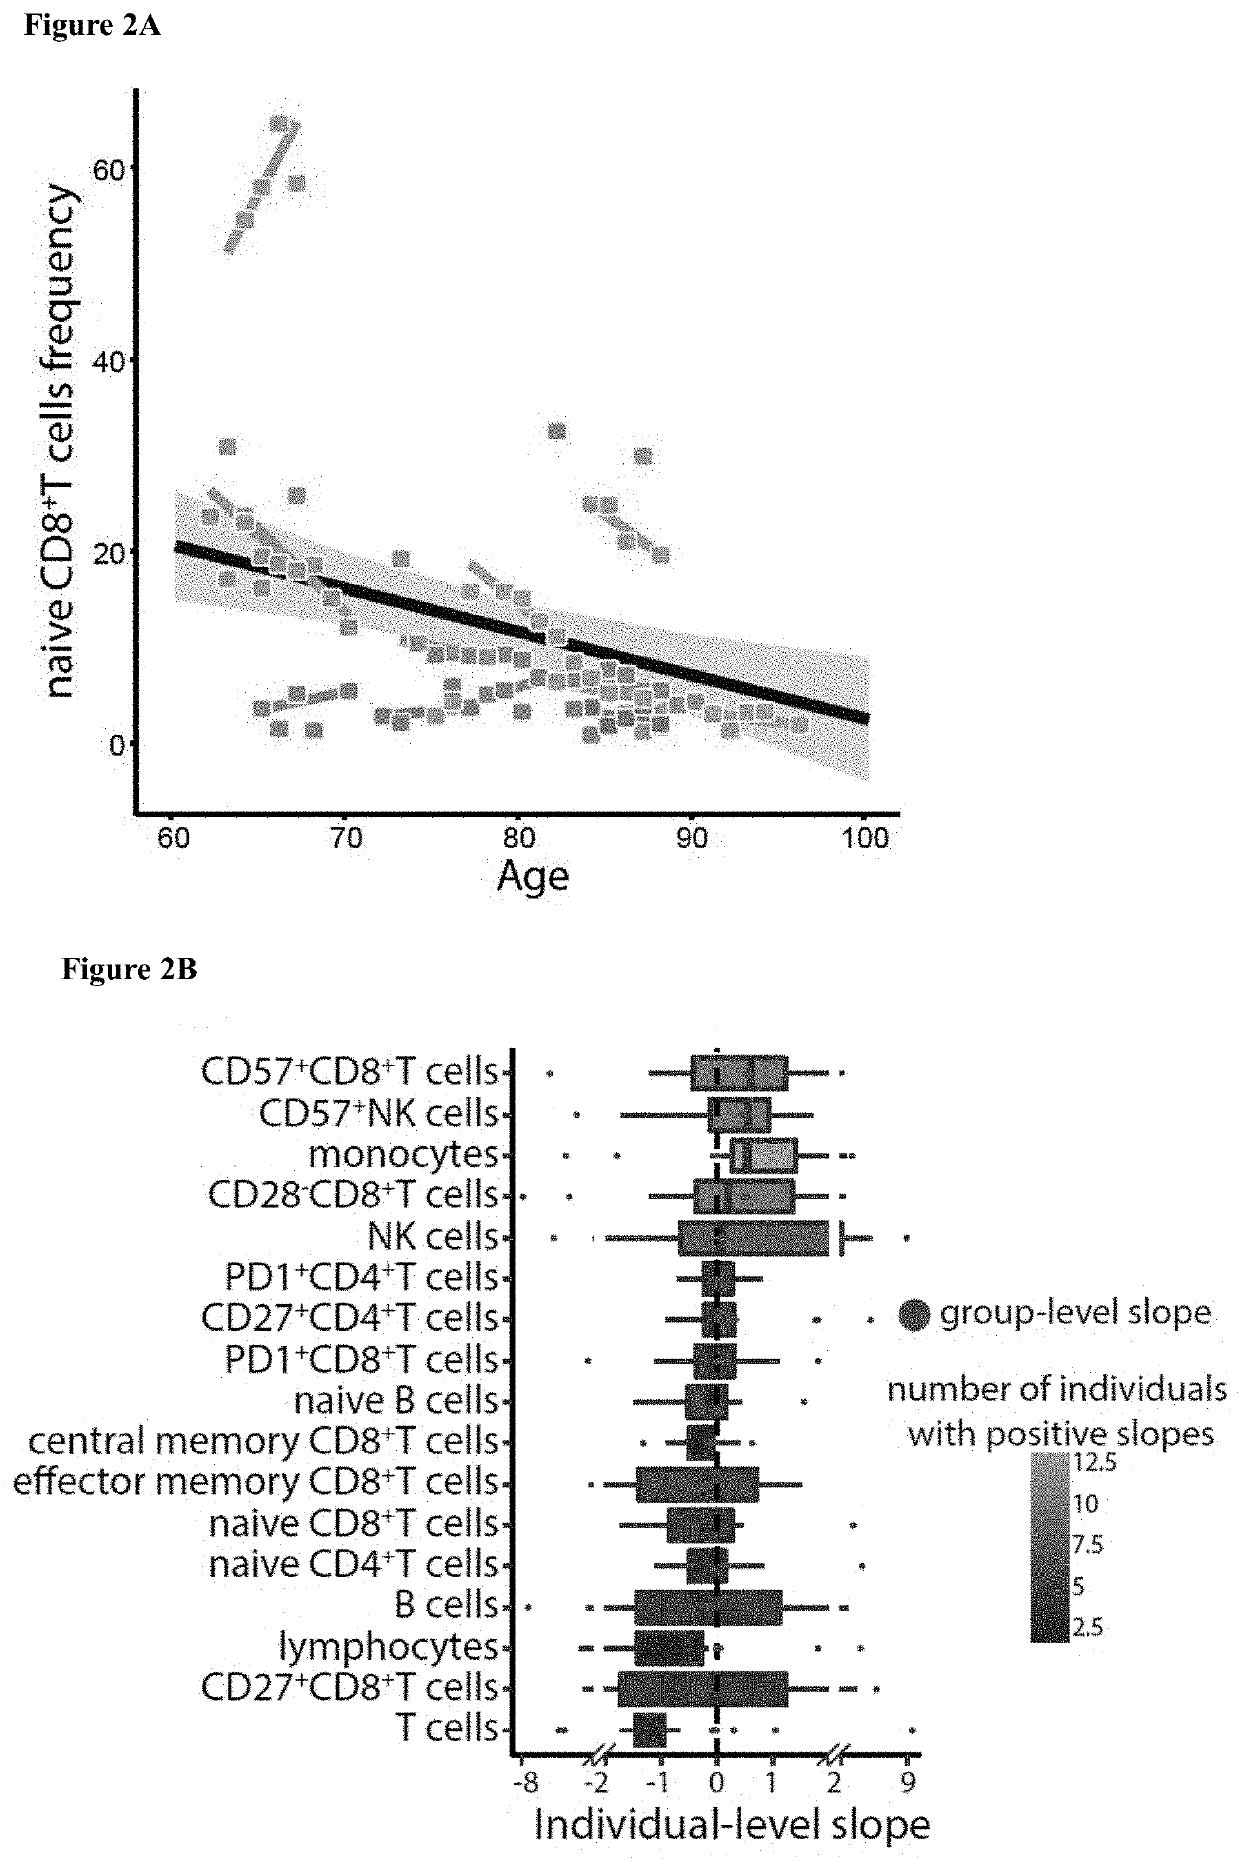
[0172]To understand the dynamics of immune-cells in healthy older adults, we first analyzed the snapshot-dataset profiled by single-cell mass-cytometry (CyTOF). We manually gated 73 immune cell-subsets and for each one of them we calculated the group- and individual-level longitudinal slopes in frequency for older adults (Methods). For most cell-subsets, the group-level longitudinal slopes matched the known directions of age-induced alterations. For instance, naïve CD8+ T-cells exhibited a decline over time at the group-level (FIG. 2A). However, though the longitudinal individual-slopes were skewed towards the direction of the longitudinal group-level slopes, they exhibited a high inter-individual variability including individuals changing in an opposite direction to the group-slope (FIG. 2A). This behavior was observed for multiple immune cell-subsets such as: B-cells, CD8+CD28− T-cells, NK and CD8+ T-cel...
example 3
lls in Older Adults Converge Towards Steady-State Levels in a Baseline Dependent Manner, Yielding an Attractor Point
[0175]To extend these findings quantitatively, we turned to the large ongoing dataset that includes longitudinal cell-subsets profiling of 135 individuals. We observed a large year-to-year variation that spanned both age groups due to technical issues inherent to the annual profiling (FIG. 7D, 9A). Leveraging the insight from the snapshot dataset regarding the longitudinal stability of the young immune-profiles, we used the young cohort to adjust the ongoing dataset, yielding an improvement of the correlation between the two datasets (Methods, FIG. 9).
[0176]We first identified by a cross-sectional analysis 33 cell subsets as consistently associated with age following CMV adjustment in the 9-years of the study (FIG. 3A, Methods, Benjamini-Hochberg adjusted combined P+ T-cell subsets lacking expression of CD28 or those expressing CD85j, CD57 or PD1, whose abundance incre...
PUM
 Abstract
Description
Claims
Application Information
 - Generate Ideas
- Intellectual Property
- Life Sciences
- Materials
- Tech Scout
- Unparalleled Data Quality
- Higher Quality Content
- 60% Fewer Hallucinations
Browse by: Latest US Patents, China's latest patents, Technical Efficacy Thesaurus, Application Domain, Technology Topic, Popular Technical Reports.
© 2025 PatSnap. All rights reserved.Legal|Privacy policy|Modern Slavery Act Transparency Statement|Sitemap|About US| Contact US: help@patsnap.com