
Graphical representation of impairment or other conditions in a data-over-cable system

a data-over-cable system and impairment technology, applied in the field of data communication and data-over-cable systems, can solve the problems of complex correlation, inability to plot impairment data on standard format graphs, and high cost of methods

Inactive Publication Date: 2004-06-29
HEWLETT-PACKARD ENTERPRISE DEV LP
View PDF4 Cites 43 Cited by
  • Summary
  • Abstract
  • Description
  • Claims
  • Application Information

AI Technical Summary

Problems solved by technology

This problem of correlation is further complicated if there are intermittent, or multiple, impairments on a given upstream path, or across multiple upstream channels.
Unfortunately, the collected impairment data does not lend itself well to plotting on standard format graphs.
There are several drawbacks with this approach.
First, the method is costly, as in order to get the resolution that is required a separate device is used for data collection.
In many cases, the data collection device is limited in how many channels it can monitor.
Secondly, the method gives the provider or user no information on active cable modems that may be the cause of the problem.
Thirdly, it does not sufficiently narrow down the problem to enable quick troubleshooting of the cause of the impairment.

Method used


Image

  • Graphical representation of impairment or other conditions in a data-over-cable system
  • Graphical representation of impairment or other conditions in a data-over-cable system
  • Graphical representation of impairment or other conditions in a data-over-cable system

Examples


Embodiment Construction

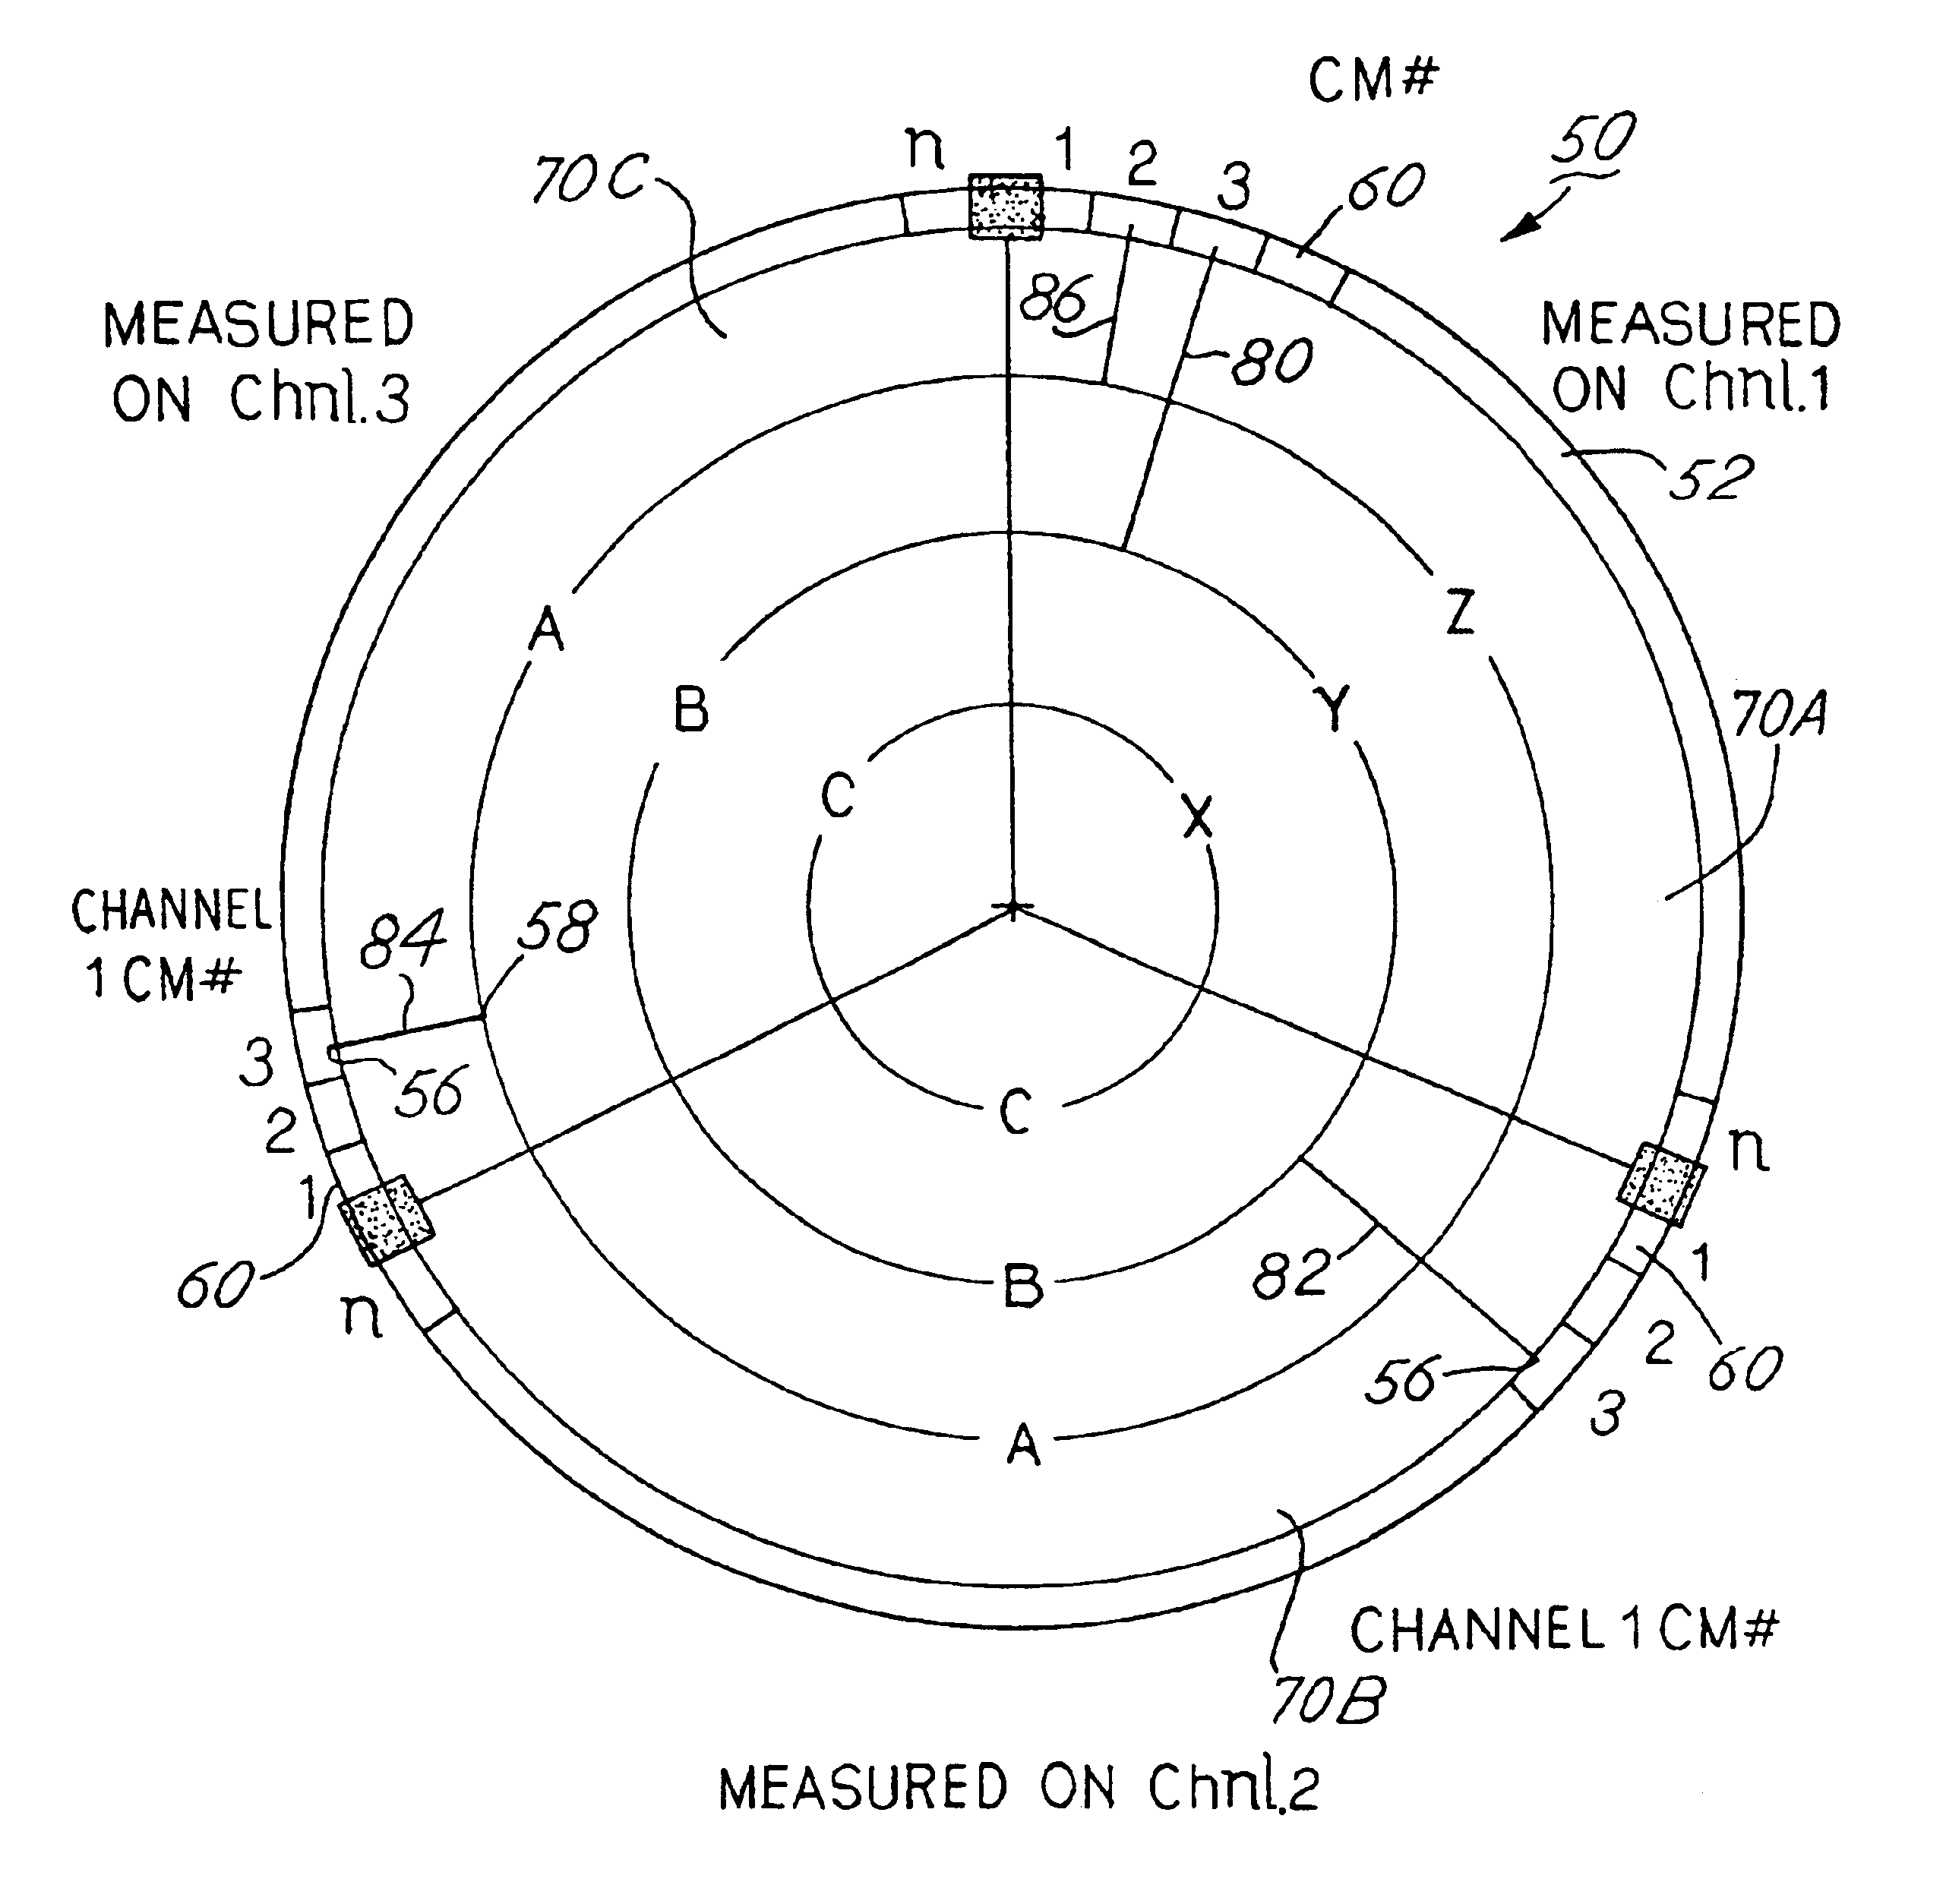
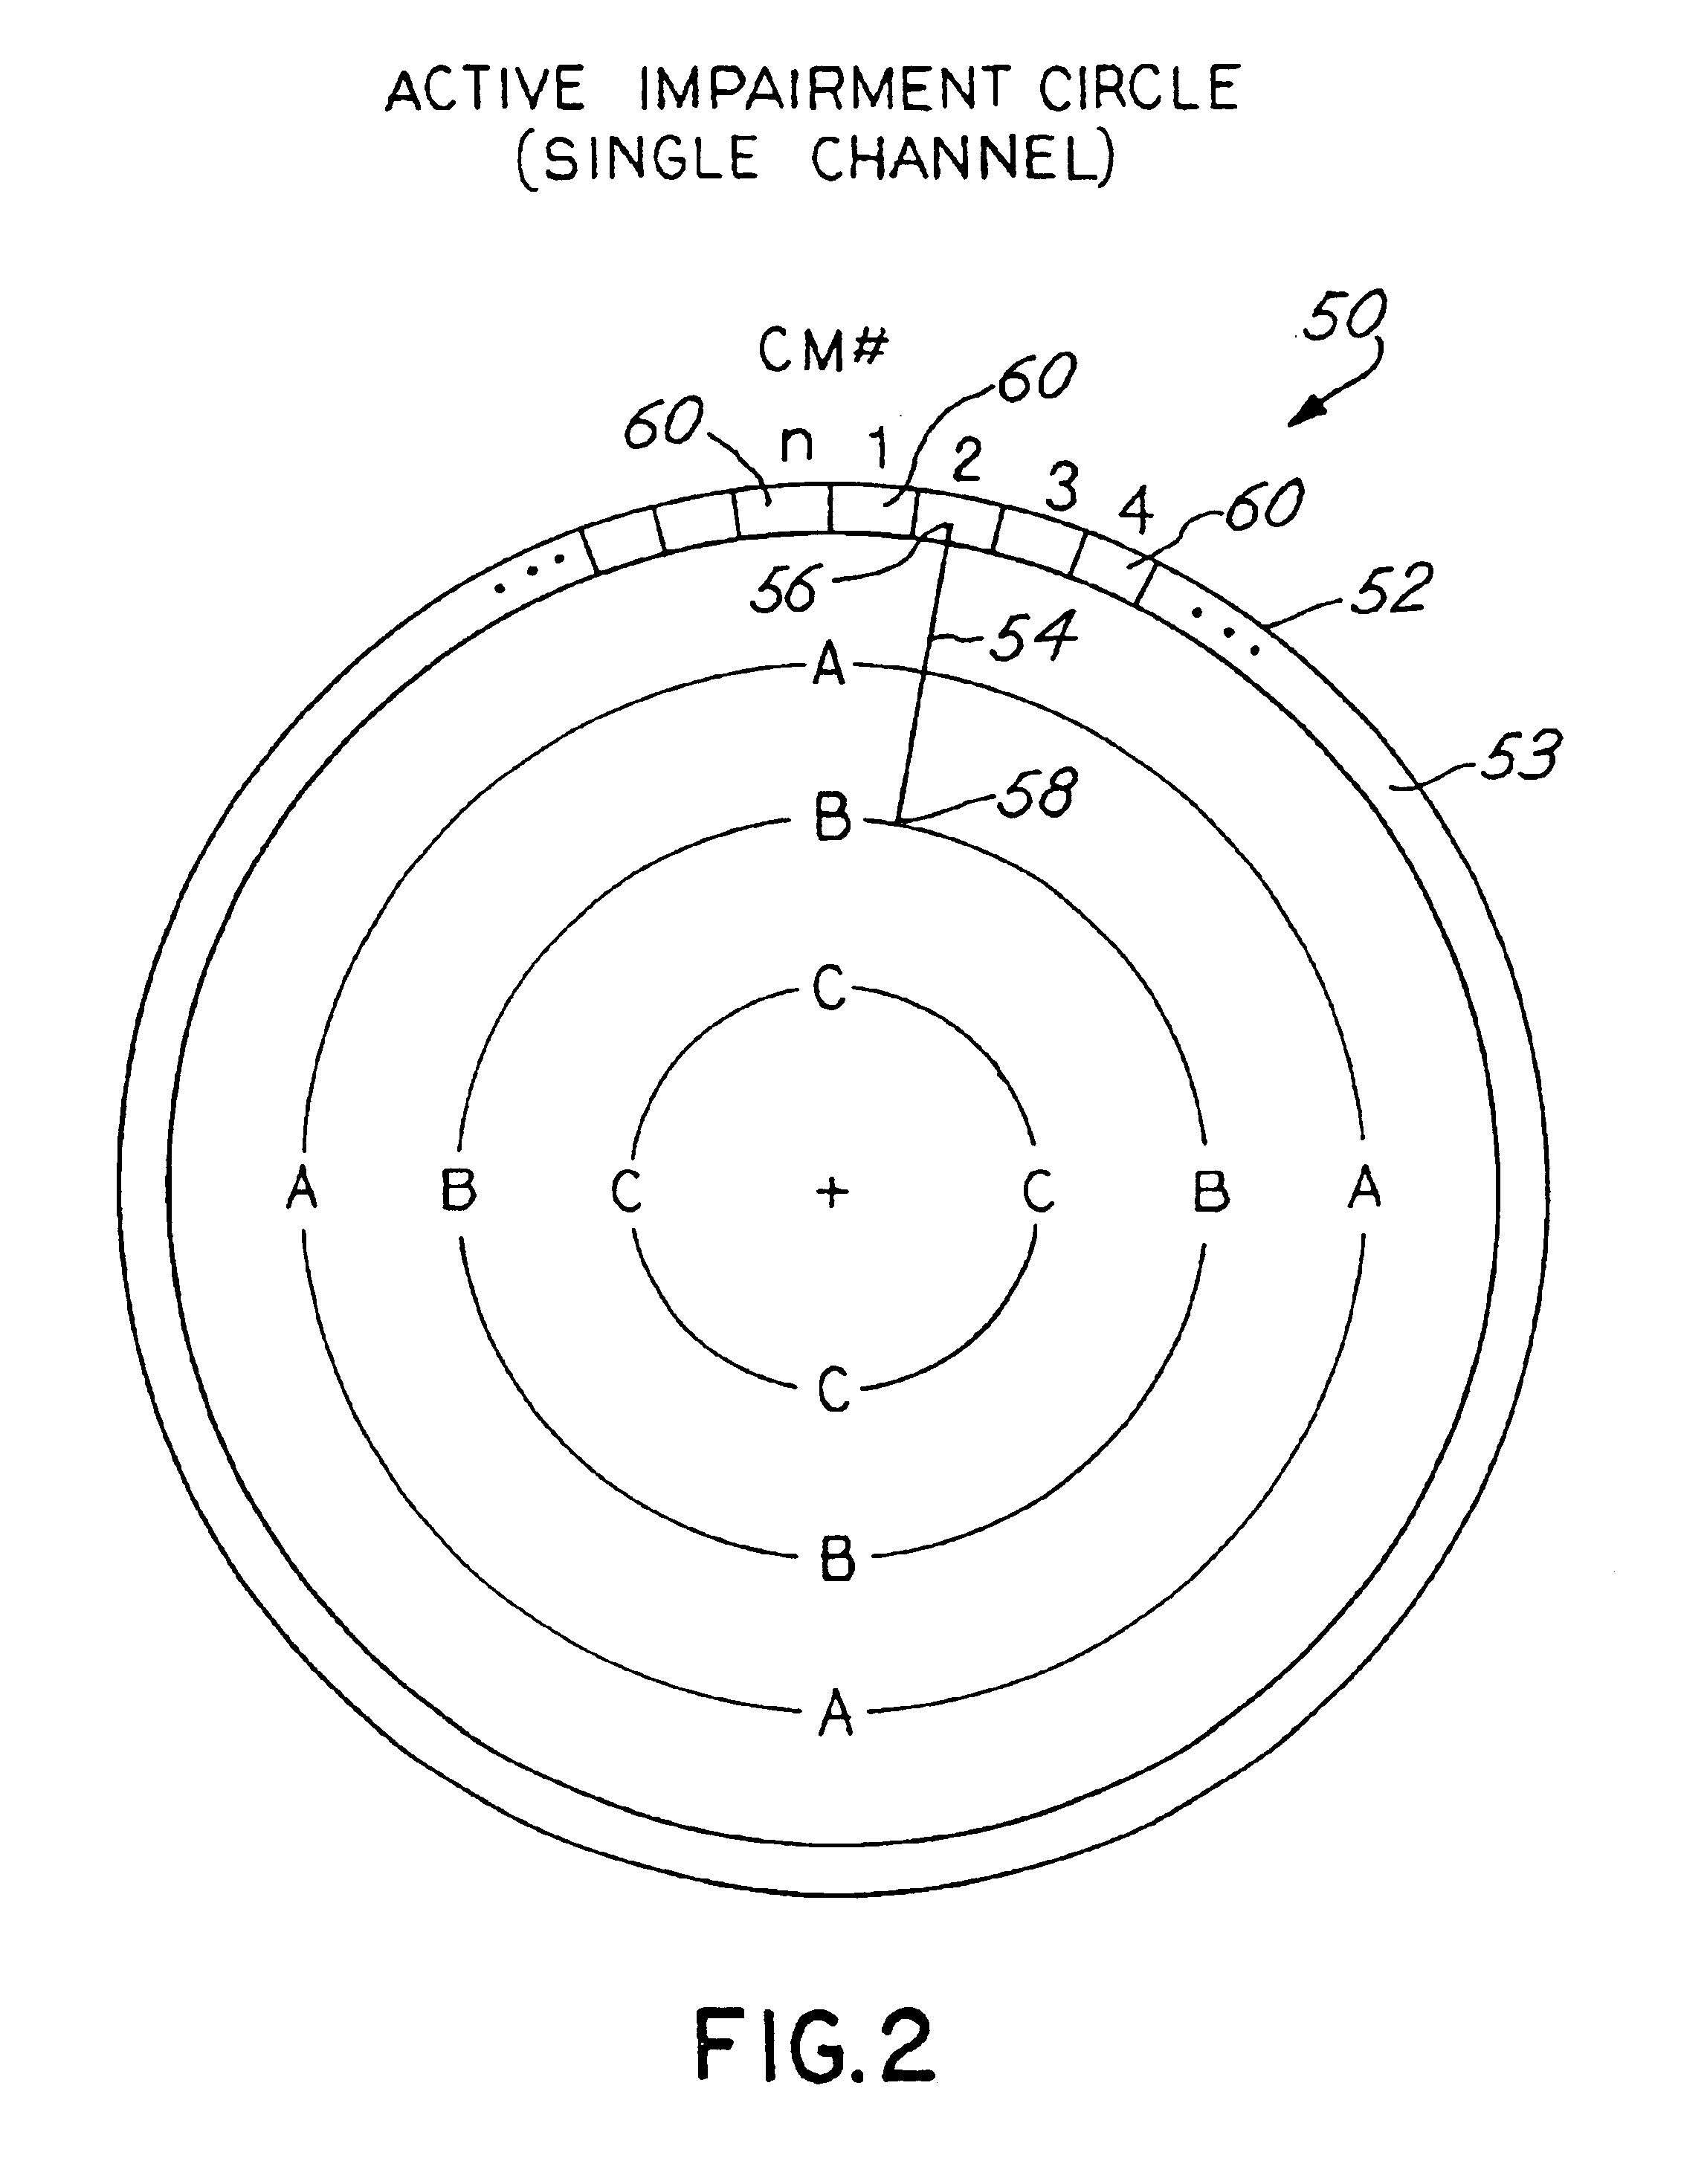
Several different embodiments of impairment circles will be described herein. The features of the impairment circles can vary considerably depending on the type of information that is conveyed. The impairment circle is preferably displayed on a visually perceptible medium, such as piece of paper or the screen display of a general-purpose computer. The impairment circle can be generated by hand, or, more preferably, by a graphics software program in accordance with the principles and methods described herein.

The impairment circle consists of a circle displayed on the medium, which may take the form of a template that is used over and over again, and a line segment (one or more) that is displayed on the medium and superimposed on the circle. The manner in which the line segment is drawn on the circle conveys information as to the impairment or condition being measured.

The line segment need not be drawn only when the measured condition (such as noise floor level) is of such a magnitude...


PUM


Abstract

Impairment or other conditions (e.g., signal to noise ratio or noise floor) in a data-over-cable system are represented graphically in an easy to use and comprehensible manner, enabling quick identification and isolation of the source of the impairment. The graphical representation of the condition, referred to herein as an "impairment circle", is in the form of a circular template with a line segment superimposed thereon representing the impairment. One end of the line segment is placed on the perimeter of the circle at a location associated with a particular cable modem or channel. The other end of the line segment either terminates in the interior of the circle or terminates on another portion of the perimeter. The perimeter of the circle can be divided into multiple sections, each section representing a channel in a transmission path. The sections can be further divided into multiple divisions, each division corresponding to a particular cable modem in the path or number of occurrences. In one type of the impairment circle, the location in which the line segment terminates within the interior of the circle indicates the magnitude of the impairment or other measurement. A single impairment circle can be used to represent impairments or other measurements of multiple channels and multiple cable modems. In another type of impairment circle, the line segment goes from one division of one section to another division of another section, indicating a condition of impairment of other channels when a particular cable modem in one channel is active. Different colors for the line segments and different widths of the line segments can convey additional information, such as the number of occurrences of the condition, or the magnitude of the impairment.

Description

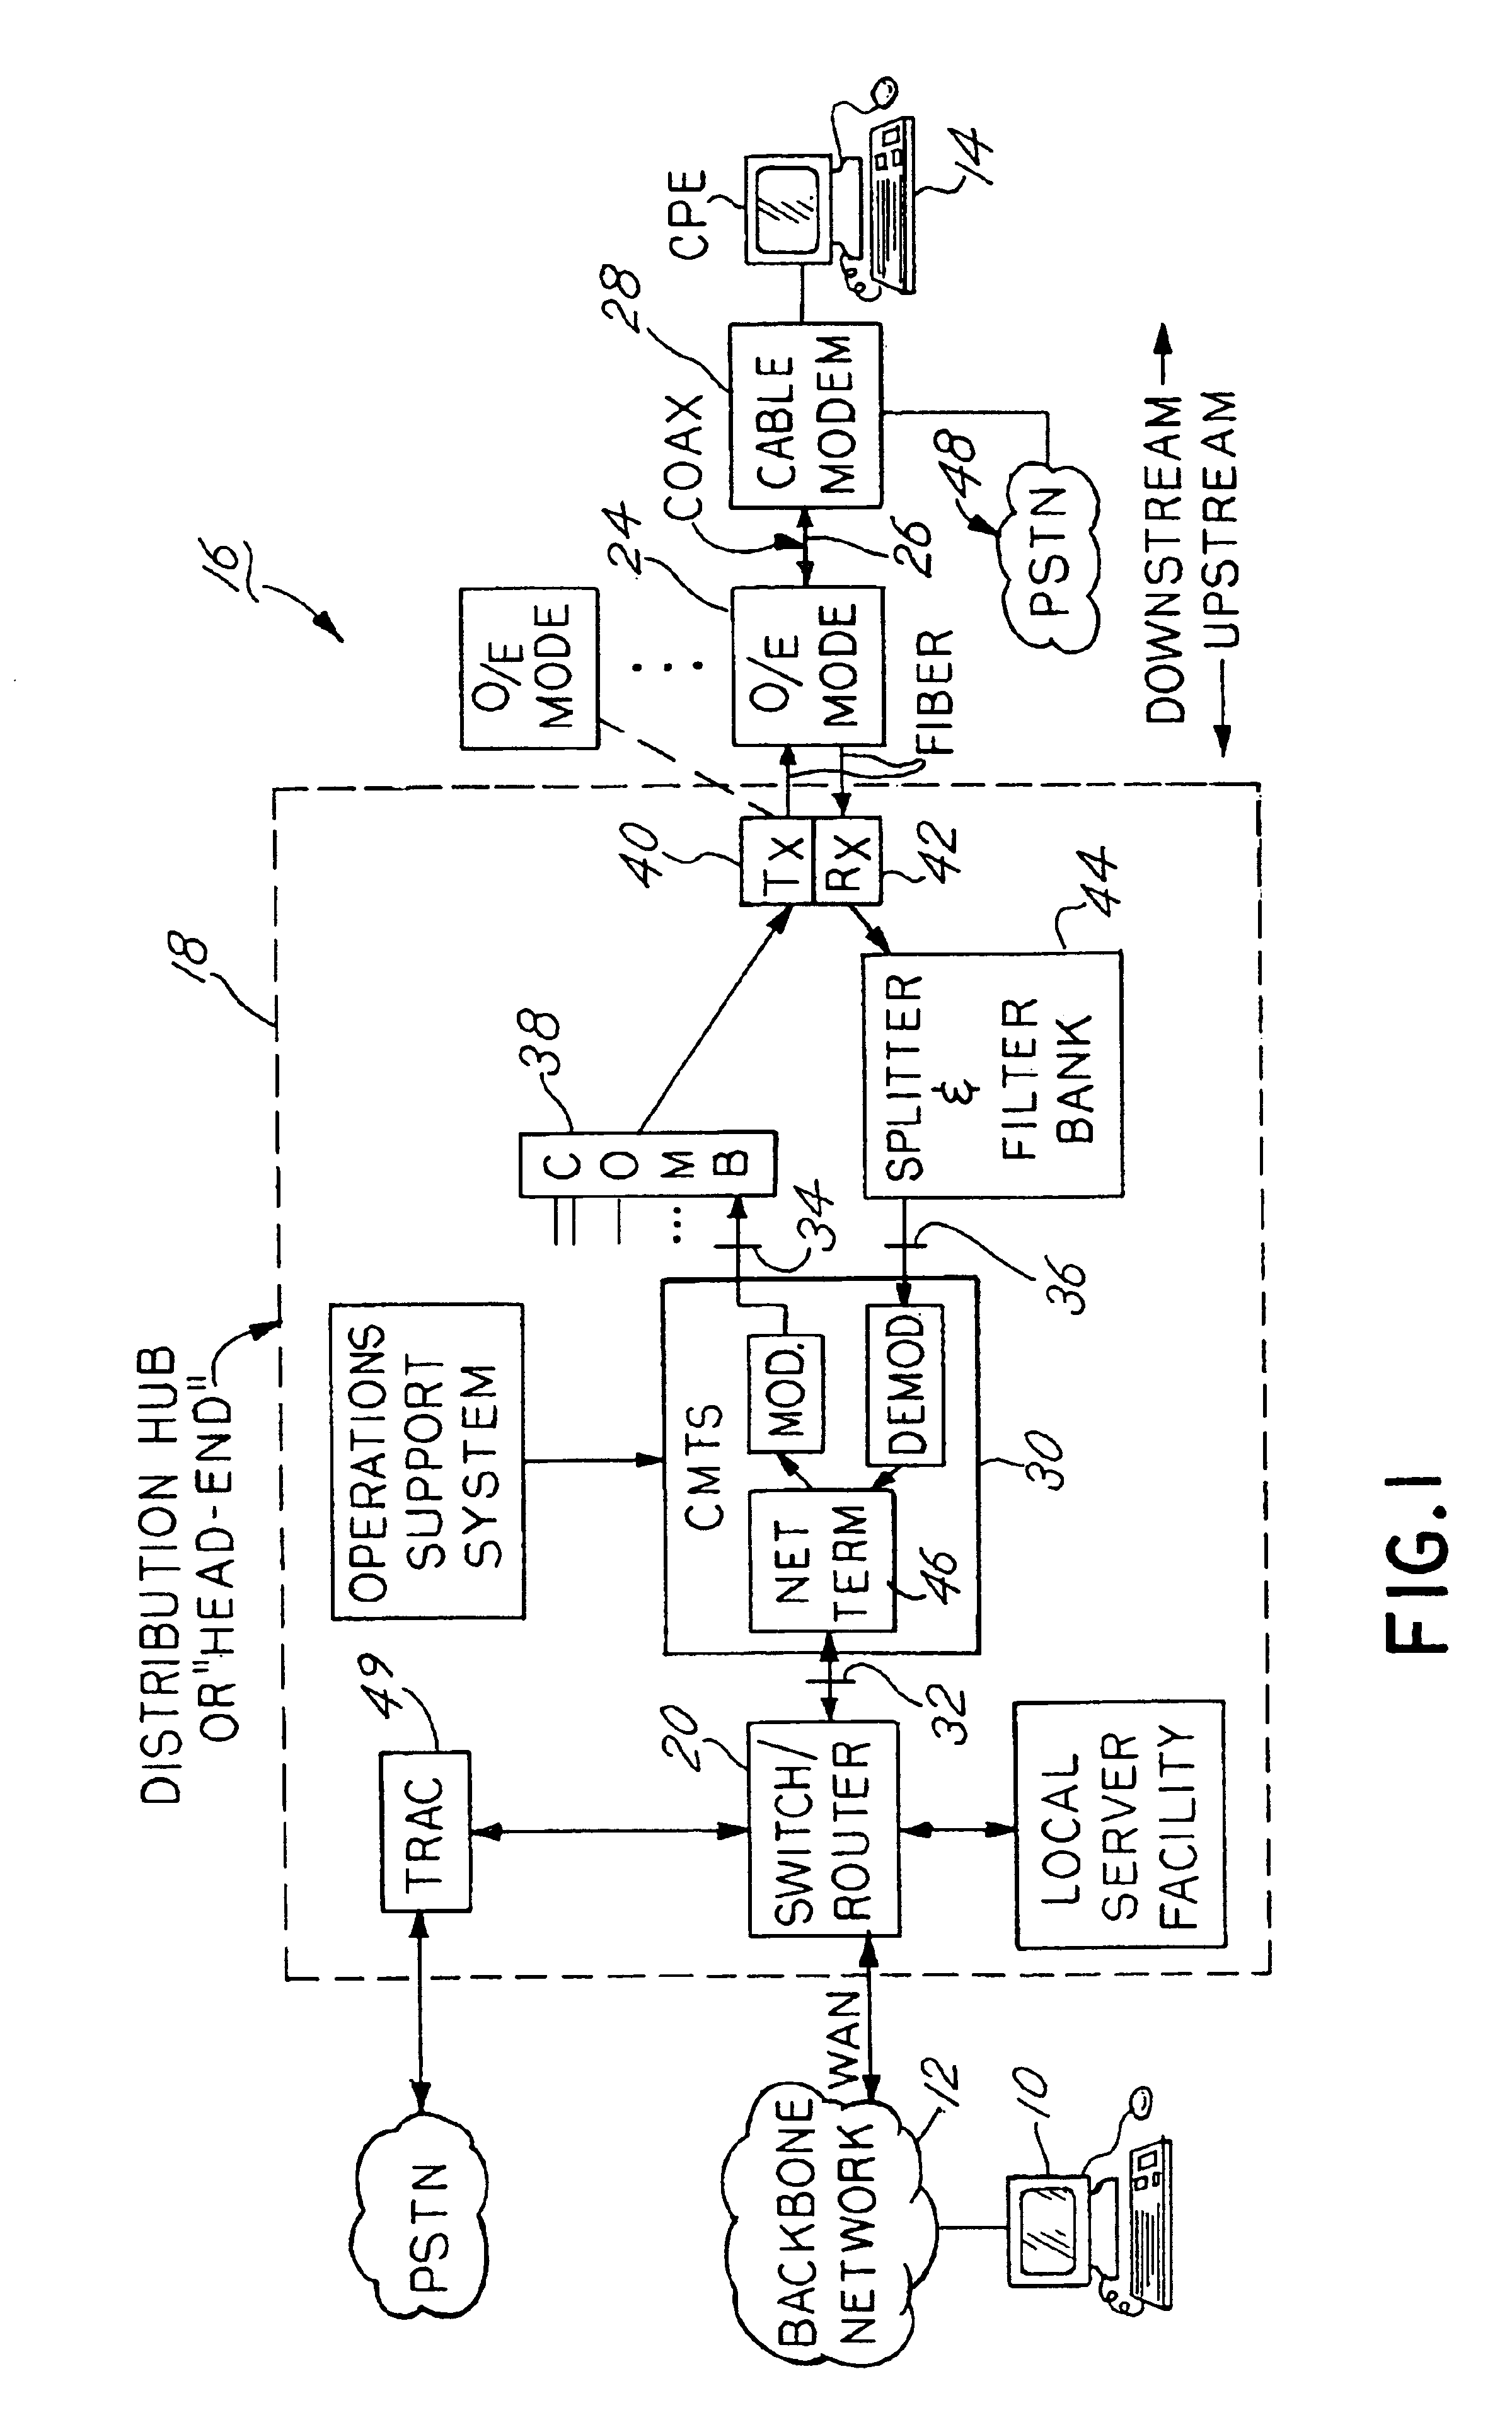
A. Field of the InventionThis invention relates to the field of data communication and data-over-cable systems. More particularly, the invention relates to a method of graphically representing conditions in such a system (such as signal to noise ratio, noise floor levels, or other types of conditions, which may or may not indicate an impairment in the system) in a convenient manner such that the source of the impairment to the system is easy to comprehend by a technician or human operator.B. Description of Related ArtCable modem systems for wide area network access, e.g., Internet access, are now being rolled out in selected metropolitan areas of the United States. Basically, these systems provide high-speed data communications over a cable television infrastructure. Background information related to cable modem systems in general is described in the Data-Over-Cable Service Interface Specifications (DOCSIS)--Radio Frequency Interface Specifications, Interim Draft, dated Jul. 24, 199...

Claims


Application Information

Patent Timeline
IPC IPC(8): H04N7/173H04L12/26
CPCH04L43/045H04L43/08
Inventor VOGEL, MARK O.
Owner HEWLETT-PACKARD ENTERPRISE DEV LP
Learn More