Method of analyzing marks made on a response sheet
a response sheet and mark technology, applied in the field of response sheet analysis, can solve the problems of inconsistent results, large number of challenges regarding accuracy, consistency, and general slowness of manual counting, and achieve the effect of accurate results
- Summary
- Abstract
- Description
- Claims
- Application Information
AI Technical Summary
Benefits of technology
Problems solved by technology
Method used
Image
Examples
example 1
FIG. 9 is an example of the response pixel value set derived from a typical check mark 140. The pixel counts for each row are displayed to the right of the image. The numbers under the heading “C”144, indicate the highest number of contiguous pixels in that row. The numbers under the heading “N”, 146 indicate the number of non-contiguous or total pixels in the row. This response pixel value set would match the indicated categories in the category table 148 in FIG. 9A.
In this example, category numbers 5 and 11 were matched. The last category matched—the identifying category 149 for this response pixel value set—was 11, which indicates that this user's mark type is a “Vote” having a mark code of V3.
example 2
FIG. 10 is an example of the response pixel value set derived from a thin horizontal line 150. This response pixel value set would match the indicated categories in the category table 152 in FIG. 10A.
Note that Category numbers 1, 2, 4 and 10 were all matched. Category 4 154 was matched which indicates an “Error” mark type. But since category 10(a “Vote” mark type) was also matched, category 10 is the identifying category 156 for this response pixel value set. The “Error” mark type associated with category 4 is overwritten and the mark is counted as a “Vote” having mark code V1.
example 3
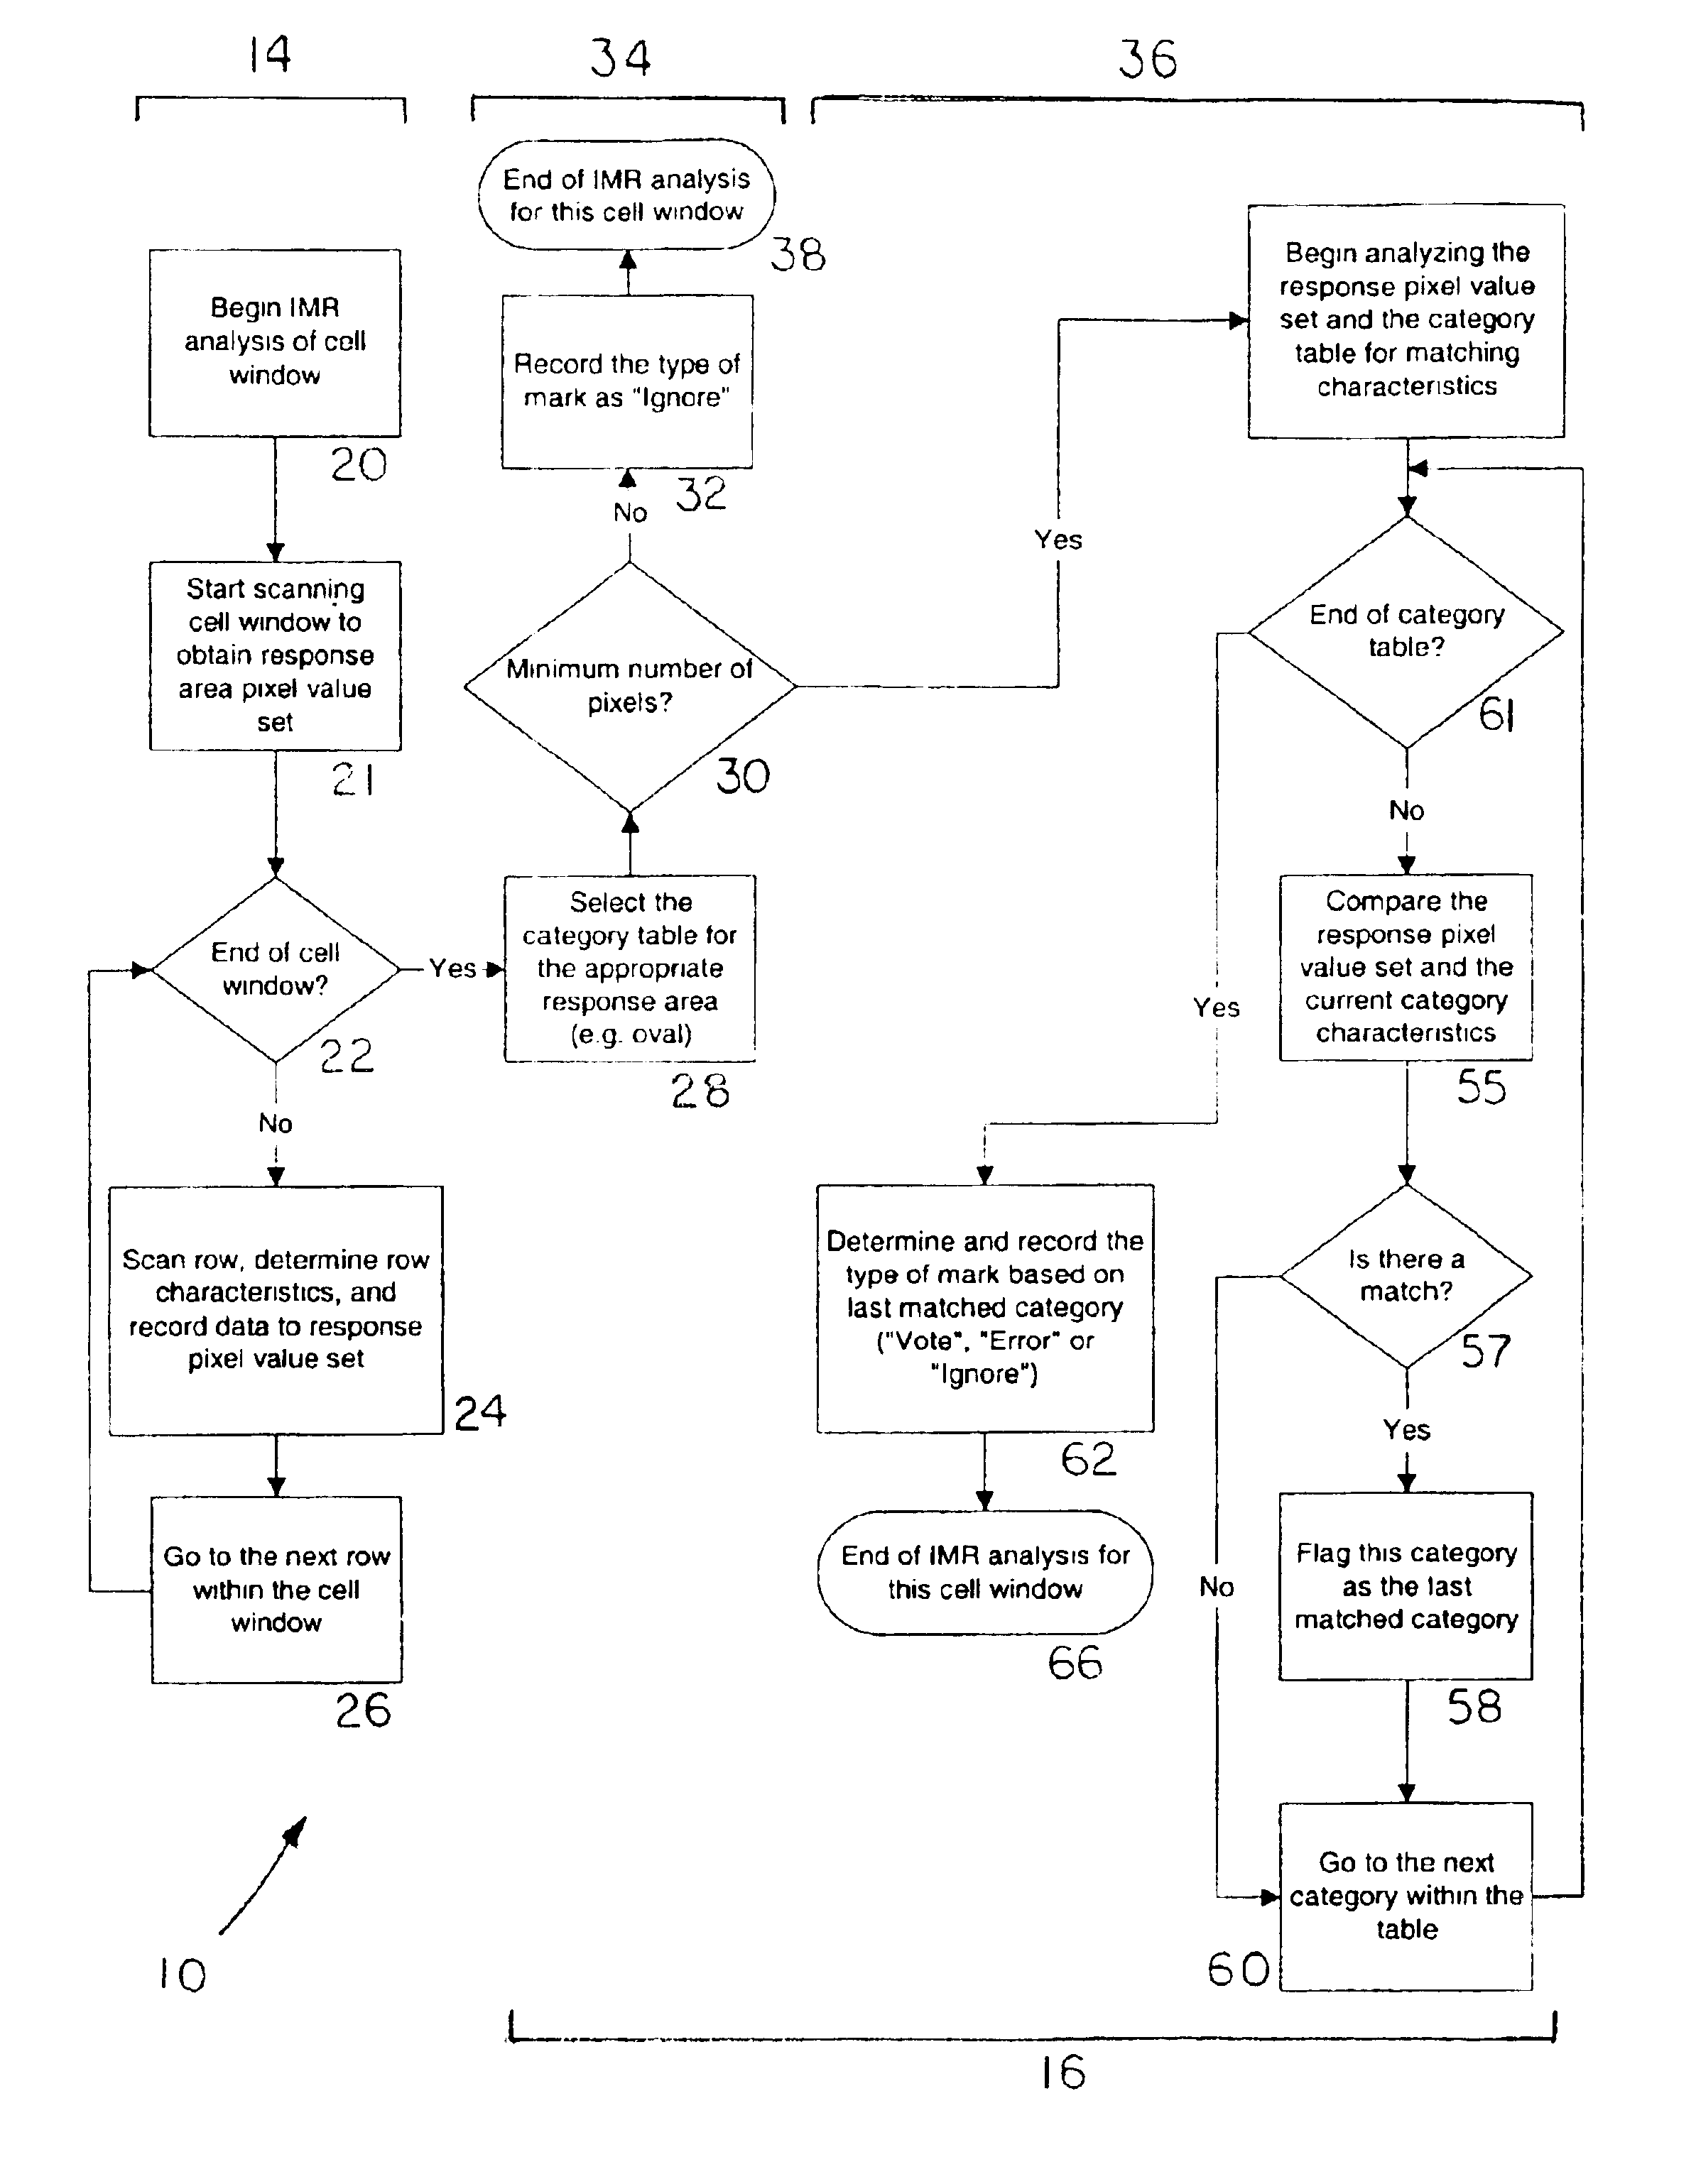
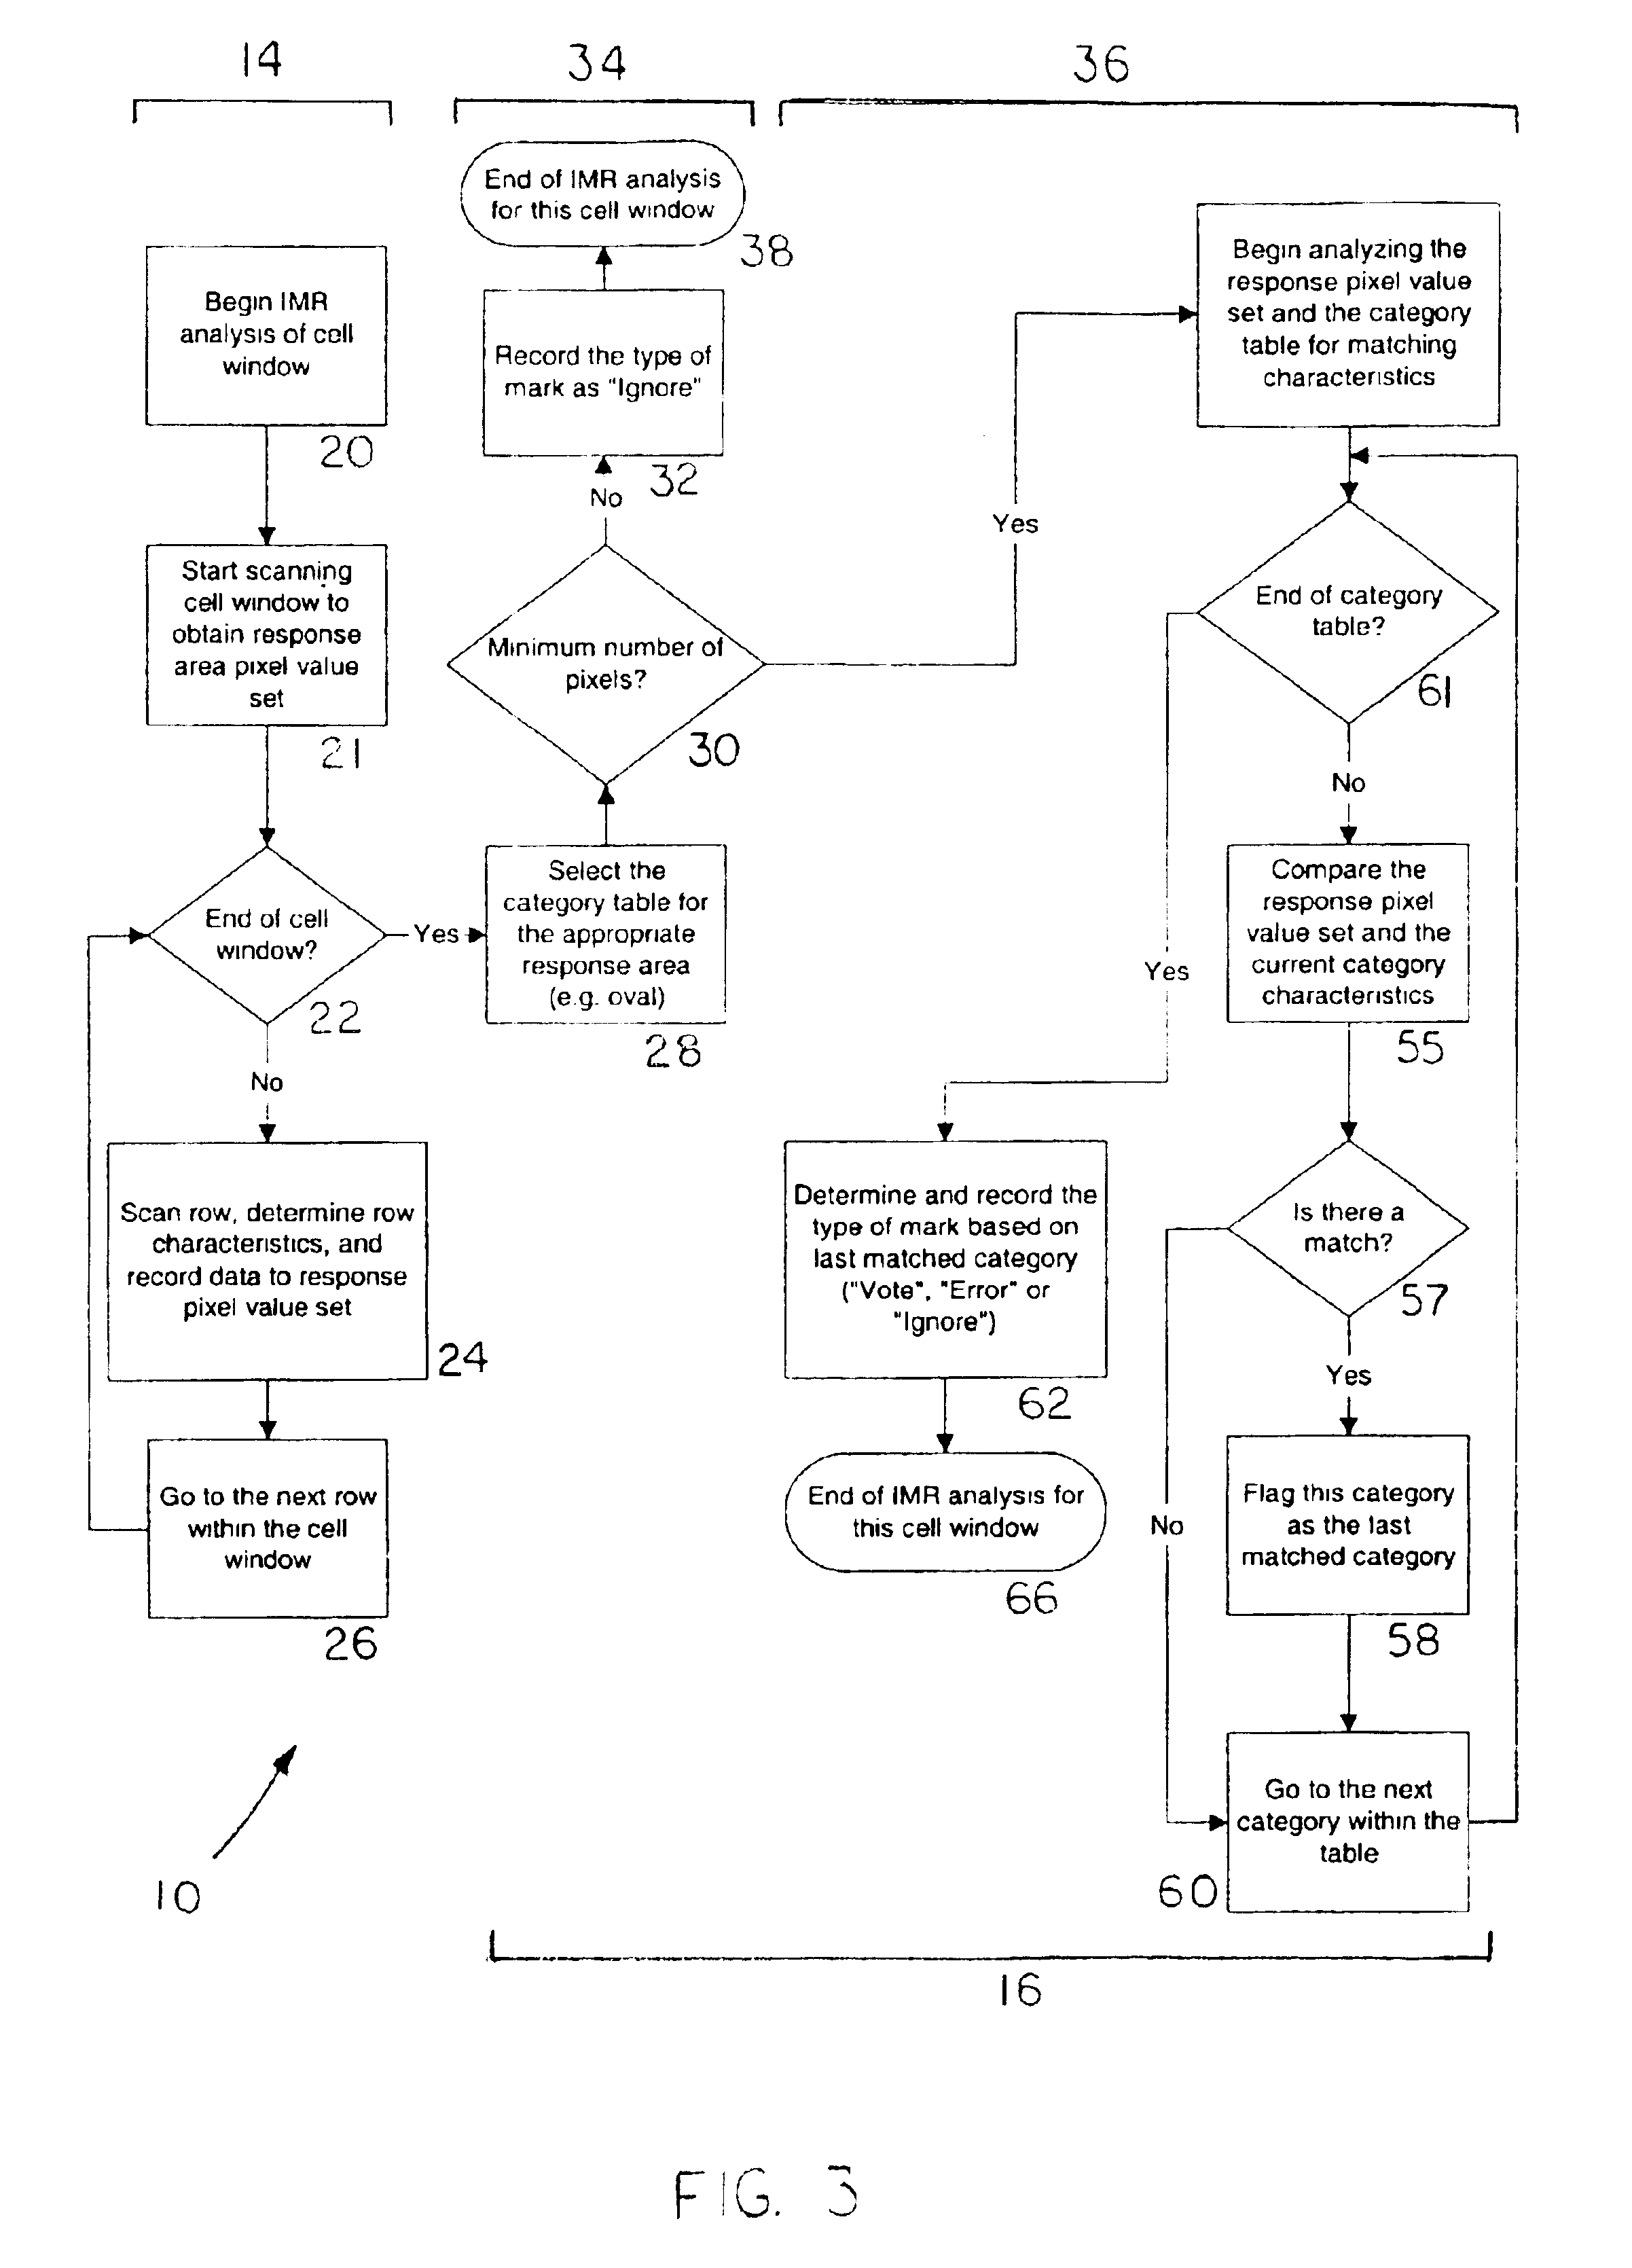
FIG. 11 is an example of the response pixel value set derived from a blank oval that is darker than normal 160. This can be the result of the ovals being printed with lines that are thicker than specifications, a dirty sensor, folds in the response sheet 2, system over-sensitivity, or any combination of these problems. The total pixel count from this sensor reading and from the sensor readings in Examples 4 and 5 are significant and display the capabilities of the IMR method 10. This response pixel value set in Example 3 would match the indicated categories in the category table 162 in FIG. 11A.
Note that only category numbers 1 and 2 were matched, and that category 2, as the last matched category is the identifying category 164 for the response pixel value set. These two categories only produce “Ignore” codes. This means that the IMR method 10 will disregard the reading of this blank oval 160. The effect of this flag will be demonstrated in Example 5.
PUM
 Abstract
Description
Claims
Application Information
 - R&D
- Intellectual Property
- Life Sciences
- Materials
- Tech Scout
- Unparalleled Data Quality
- Higher Quality Content
- 60% Fewer Hallucinations
Browse by: Latest US Patents, China's latest patents, Technical Efficacy Thesaurus, Application Domain, Technology Topic, Popular Technical Reports.
© 2025 PatSnap. All rights reserved.Legal|Privacy policy|Modern Slavery Act Transparency Statement|Sitemap|About US| Contact US: help@patsnap.com


