System and method for linear prediction

a linear prediction and system technology, applied in the field of linear prediction system and method, can solve the problems of greater delay, difficult task of transmitting to a mobile user over a time-varying multipath, and spectral estimation, so as to minimize the mutual data point, and minimize the mean square error

Active Publication Date: 2006-09-05
LEIDOS
View PDF17 Cites 32 Cited by
  • Summary
  • Abstract
  • Description
  • Claims
  • Application Information

AI Technical Summary

Benefits of technology

[0027]Yet another object of the present invention is to provide a system and method for linear prediction with uses fewer channels and hence, less noise variance, than full rank techniques.
[0028]Another object of the present invention is to provide a system and method for linear prediction which requires less sample support as compared to full rank methods.
[0032]According to the present invention, the method for linear prediction of information determinable from at least one input signal containing a plurality of data points, includes training a linear prediction filter by providing at least one reference signal comprising reference data having known values; collecting observed data corresponding to the at least one reference signal; identifying a reduced order data space comprising a reduced order Krylov subspace between the observed data and the reference data; and maximizing mutual data points between the observed data and the reference data in the reduced order data space to define a weight for use in the linear prediction filter. In a preferred embodiment, the reduced order data space is identified by applying a multi-stage Wiener filter to the observed data.
[0033]In another aspect of the invention, the method for linear prediction of information determinable from at least one input signal having a plurality of data points includes: providing at least one reference signal having a plurality of reference data points having known values; training a filter by collecting p observed data points corresponding to p reference data points from the reference signal, where p reference data points are selected from the plurality of reference data points, and training further includes processing the p observed data points through the filter to identify a reduced order data space comprising a reduced order Krylov subspace between the observed data points and the reference data points; and defining a weight for minimizing the mean squared error between a predicted p+1 observed data point and a p+1 reference data point. The weight is applied to the filter which is then used for filtering data collected from the at least one input signal. In a preferred embodiment, the reduced order data space is identified by applying a multi-stage Wiener filter to the observed data.
[0034]In still another aspect of the invention, a digital signal containing data is input into a digital signal processor (DSP) which includes a filter for finding the weight vector that best estimates a received signal by minimizing the mean squared error. The input data is configured as an observed data matrix containing data samples collected from at least one reference signal, where the at least one reference signal has a set of known data points. A received data matrix is formed by collecting data samples collected from the at least one received signal. A weight vector is applied to the observed data matrix. This weight vector is determined by (a) performing a rank reduction transformation produced by decomposition of the observed data matrix in a multi-stage Wiener filter having a plurality of stages, each stage comprising projection onto two subspaces, wherein a first stage comprises projecting the observed data matrix onto each of an initial first subspace comprising an initial normalized cross-correlation vector comprising a correlation vector between a known data point from the set of known data points and the observed data points and an initial second subspace comprising the null space of the initial normalized cross-correlation vector, and each subsequent stage comprises projecting data transformed by the preceding second subspace onto each of a first subspace comprising a normalized cross-correlation vector at the previous stage and a second subspace comprising the null space of the normalized cross-correlation vector of the current stage; and (b) minimizing the mean squared error in the reduced rank data matrix. The weight vector is then applied to the received data matrix.

Problems solved by technology

Specifically, spectrum estimation is a problem that involves estimating the power spectrum from a finite number of noisy measurements.
While beamforming to a fixed location over a line of sight may be performed with relative ease, the task of transmitting to a mobile user over a time-varying multipath is more difficult.
A larger p provides a more accurate spectral envelope, with the disadvantage of requiring more computation, resulting in greater delays, and where the signal is transmitted, more bits for the transmission of the prediction coefficients.
There is also a risk of over-modeling the process, which can lead to false peaks in the power spectral density.
On the other hand, selecting a value for p that is too small results in no correct peaks.
Each additional element of an array increases the resolution but may also give an additional false noise peak.
A fundamental limitation of the reduced rank PC-AR techniques is the need to work in a subspace having a rank that exceeds the unknown signal rank.
If the subspace rank selected is less than the number of spatial frequencies present, the PC-AR method provides very poor performance.
Further, the need to perform eigenvector decomposition, even in reduced rank, requires a significant amount of computation to perform the full covariance matrix eigenvector decomposition, introducing delays which, in some situations, may be critical where rapid results are required.

Method used


Image

  • System and method for linear prediction
  • System and method for linear prediction
  • System and method for linear prediction

Examples


example 1

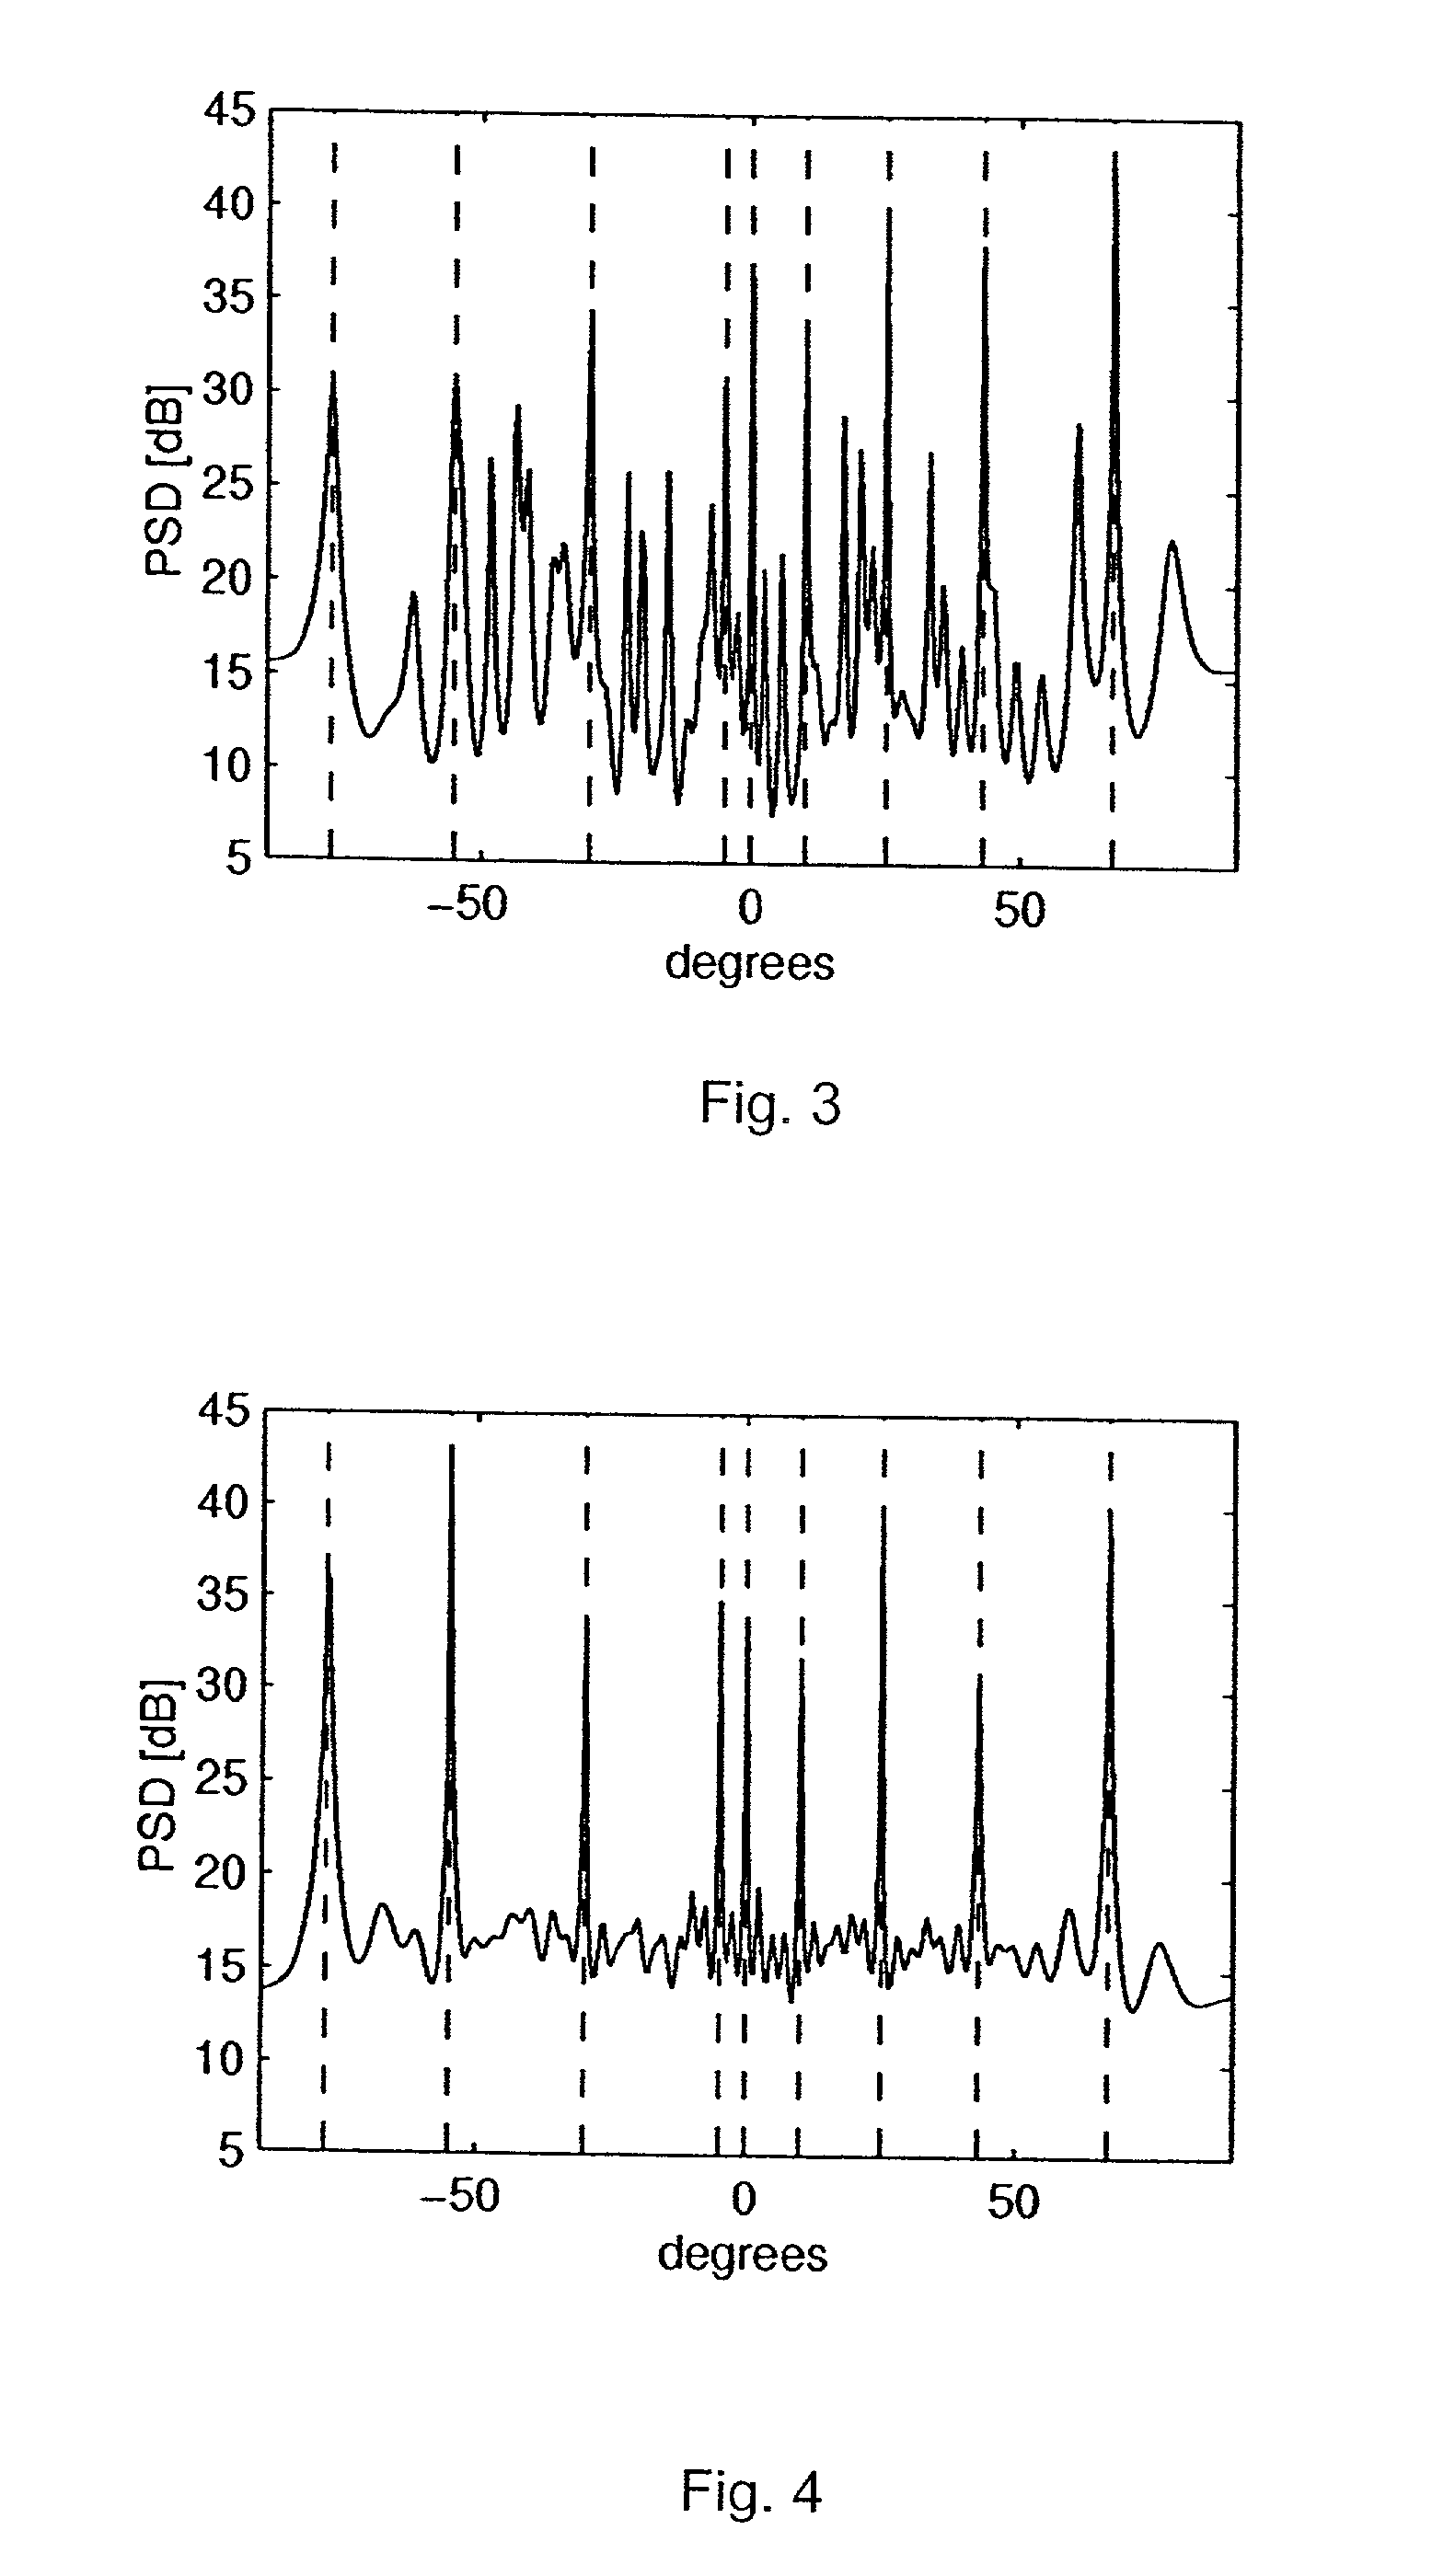
[0072]A plane wave impinging on a 50 element uniform line array (ULA). The array elements are spaced at half wavelength intervals and the angles of arrival are randomly selected from a non-repeating uniform distribution over the set of all resolvable angles, ranging from −90 degrees to 90 degrees. The signal-to-noise ratio (SNR) is 2 dB per element. Nine signals impinge upon the array from different angles. 100 snapshots are taken. The spectra generated by each of these algorithms are run through a detector that estimates the threshold for each spectrum. Any peaks above a certain threshold are considered detected. If any of these detected angles do not correspond to one of the original arrival angles, it is counted as a false alarm. If a true angle is not detected, it is counted as a miss. The PD and FAR are calculated and averaged over 500 trials. The performance as a function of rank is calculated with a sample covariance of 2 N samples.

[0073]Performance as a function of rank: A f...

example 2

[0075]In this simulation, differing signal quantities (10, 15 and 20 signals) impinge on a 50 element ULA at 0 dB SNR. FIG. 7a shows the RR-AR method's robustness to rank selection in the sense that its PD will meet or exceed the PD of FR-AR at almost any rank, regardless of how many signals are present. (Note that the FR-AR performance corresponds to the RR-AR performance at rank 50.) The signal dependent PC-AR method, shown in FIG. 7b, has similar peak performance but requires a subspace rank greater than or equal to the signal rank before good results are achieved. Further examination of FIG. 7a reveals that the peak PD for the RR-AR method is nearly invariant to the signal rank. In other words, selecting one low subspace rank will yield excellent PD for a wide range of frequencies present. This is in direct contrast to signal dependent PC-AR, where the peak PD as a function of subspace rank is directly tied to the number of spatial frequencies. The near invariance of the RR-AR m...

example 3

[0076]Performance as a function of SNR: To illustrate relative performance in low SNR environments, the simulation processes twenty signals received by a 50 element ULA. FIG. 8a–8c are plots of PD versus rank at different signal to noise ratios. As can be seen, FR-AR suffers greater degradation in PD in conditions of decreased SNR compared to the peak performances of signal dependent PC-AR and RR-AR. The same trends occur with FAR. These plots highlight the ability of reduced rank algorithms to focus on a subspace that captures the signal information while excluding a large portion of the noise, leading to enhanced PD and FAR. It is interesting to note that the RR-AR lower ranked subspace and the PC-AR higher rank subspace achieve roughly the same PD and FAR for the spatial frequencies used in the simulation. This may indicate that the relationship between a lower ranked subspace and a lower FAR is not as direct when the subspace rank is compressed below the signal rank.

[0077]Perfor...


PUM


Abstract

In a digital signal processor (DSP), input data is configured as a data matrix comprising data samples collected from an input signal. A weight vector is applied to the data matrix, where the weight vector comprises three parts including (a) a rank reduction transformation produced by decomposition of the data samples in a multistage Wiener filter having a plurality of stages, each stage comprising projection onto two subspaces. Each subsequent stage comprises projecting data transformed by the preceding second subspace onto each of a first subspace comprising a normalized cross-correlation vector at the previous stage and a second subspace comprising the null space of the normalized cross-correlation vector of the current stage, to form a reduced rank data matrix. Part (b) of the weight vector comprises minimizing the mean squared error in the reduced rank data space. The output is a linear estimate of the input data. In one embodiment, further processing produces an estimate of the power spectral density of the input signal.

Description

[0001]This application claims priority to U.S. provisional application Ser. No. 60 / 239,931, filed Oct. 13, 2000, the disclosure of which is incorporated herein in its entirety by reference.BACKGROUND[0002]Linear prediction is well known for processing of signals in a number of applications. Using this method, the p+1th sample of a signal is predicted by forming a linear combination of p previous samples of the signal. The linear combination is usually optimized by minimizing the square of the prediction error. One of the most widely used models for linear prediction is the autoregressive (AR) model.[0003]Perhaps the most widely recognized application of linear prediction is in the area of audio or speech coding, where an incoming signal stream is digitized, then samples of the digitized signal are processed by a variable linear predictive filter to determine relationships in the signal in order to calculate, i.e., predict, the value of the next output sample. This process of identif...

Claims


Application Information

Patent Timeline
Patent Type & Authority Patents(United States)
IPC IPC(8): G10L19/04G06F17/10G06K9/00
CPCG06K9/0057G10L19/04G10L25/12G06F2218/22
Inventor WITZGALL, HANNA ELIZABETHGOLDSTEIN, JAY SCOTT
Owner LEIDOS
Why Eureka
Try Eureka