System and method for logical view analysis and visualization of user behavior in a distributed computer network

user behavior technology, applied in the field of system and method for logical view analysis and visualization of user behavior in a distributed computer network, can solve the problems of little information to the marketer about who is coming to the web site, unprepared to face the complexity of the e-business environment, and low level of data collected by database tools, such as the one described abov

Inactive Publication Date: 2007-01-16
NETGENESIS CORP
View PDF22 Cites 148 Cited by
  • Summary
  • Abstract
  • Description
  • Claims
  • Application Information

AI Technical Summary

Problems solved by technology

Many marketing managers, however, are unfamiliar with the Web as a marketing medium and are unprepared to face the complexity of the e-business environment.
Such site statistics can be helpful for some uses, but they provide little information to the marketer about who is coming to the Web site and how they are behaving while they are there.
Generating the high-level user behavioral information necessary to visualize and act on user behavior is a challenging endeavor for at least two reasons.
First, the data collected by database tools, such as the one described above, is at a very low level.
However, the database of page views, visits, and users is tied very firmly to the design and structure of the Web site being analyzed, and the pages on Web sites are generally defined to enable basic navigation and presentation of content to users—not to facilitate later analysis of user activity from a higher-level, logical view.
As a result, providing marketers with the high level or logical view analysis of user behavior is difficult at best.
The second difficulty in using existing Web analysis tools to perform high level or logical view analysis of Web consumer behavior is that the sheer volume of data complicates analysis.
Over time, the numbers of individual page views, visits and users are too large to extract meaningful patterns to analyze commonality and segment user behavior.

Method used


Image

  • System and method for logical view analysis and visualization of user behavior in a distributed computer network
  • System and method for logical view analysis and visualization of user behavior in a distributed computer network
  • System and method for logical view analysis and visualization of user behavior in a distributed computer network

Examples


Embodiment Construction

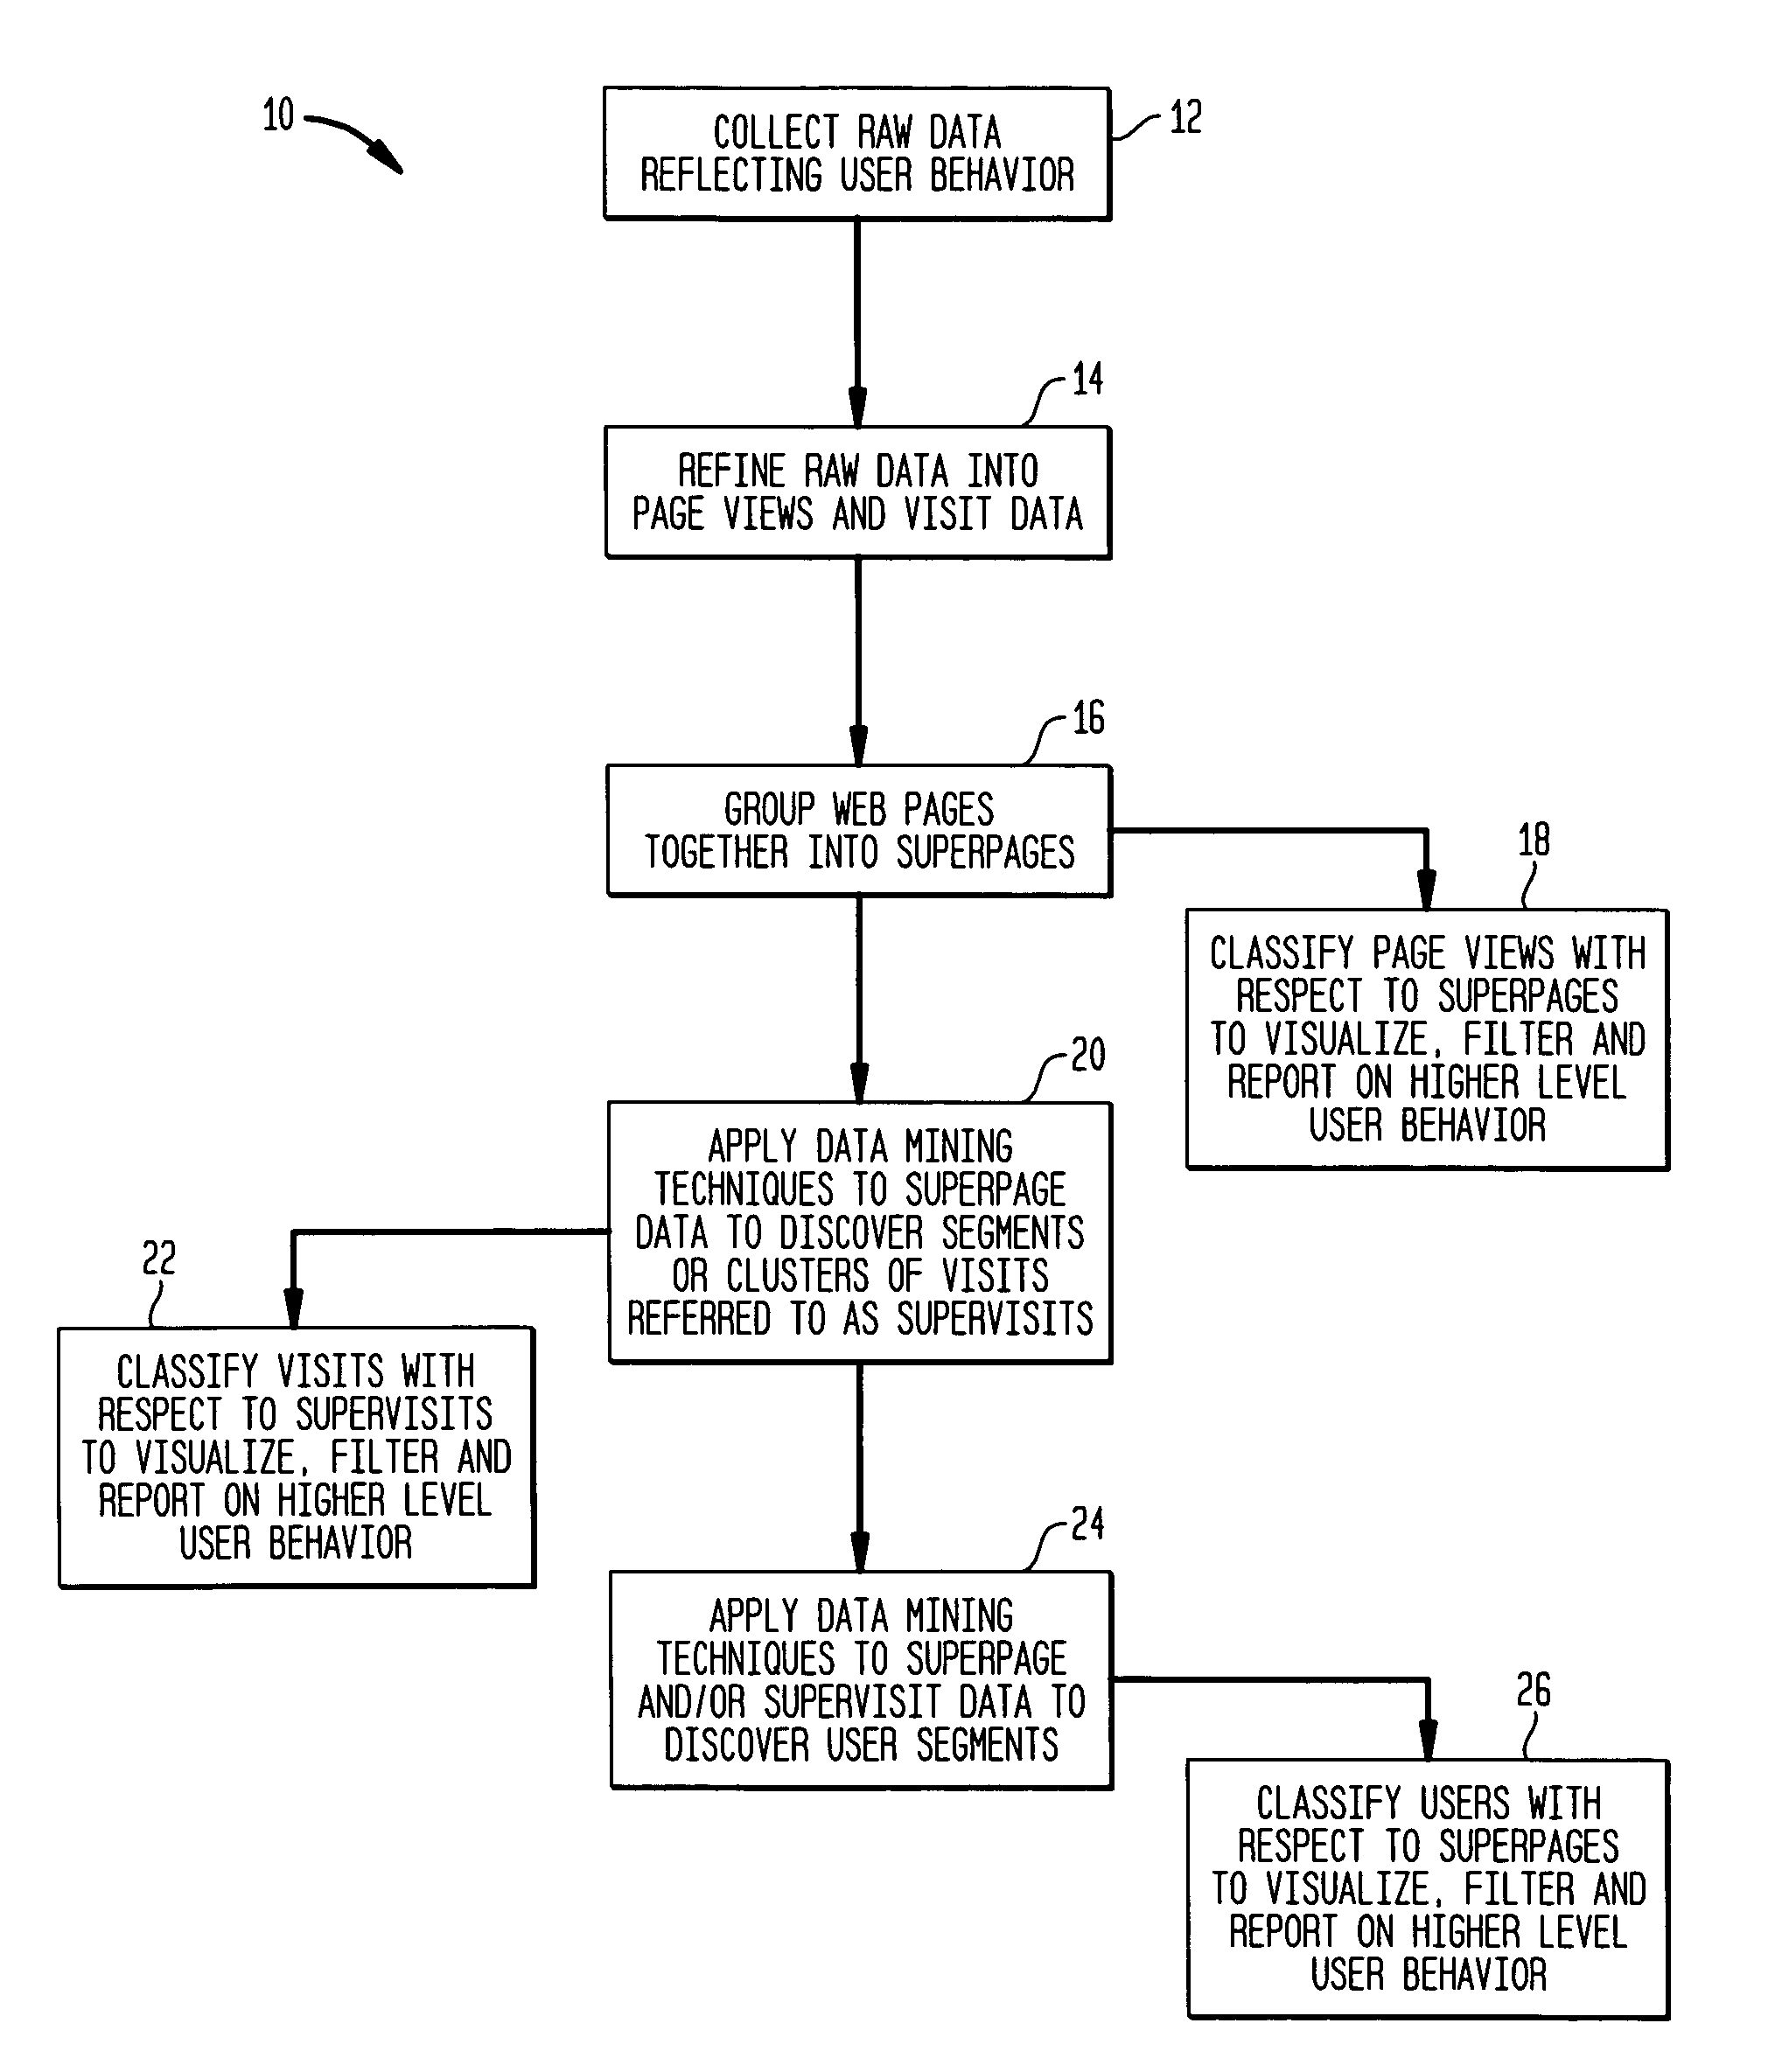
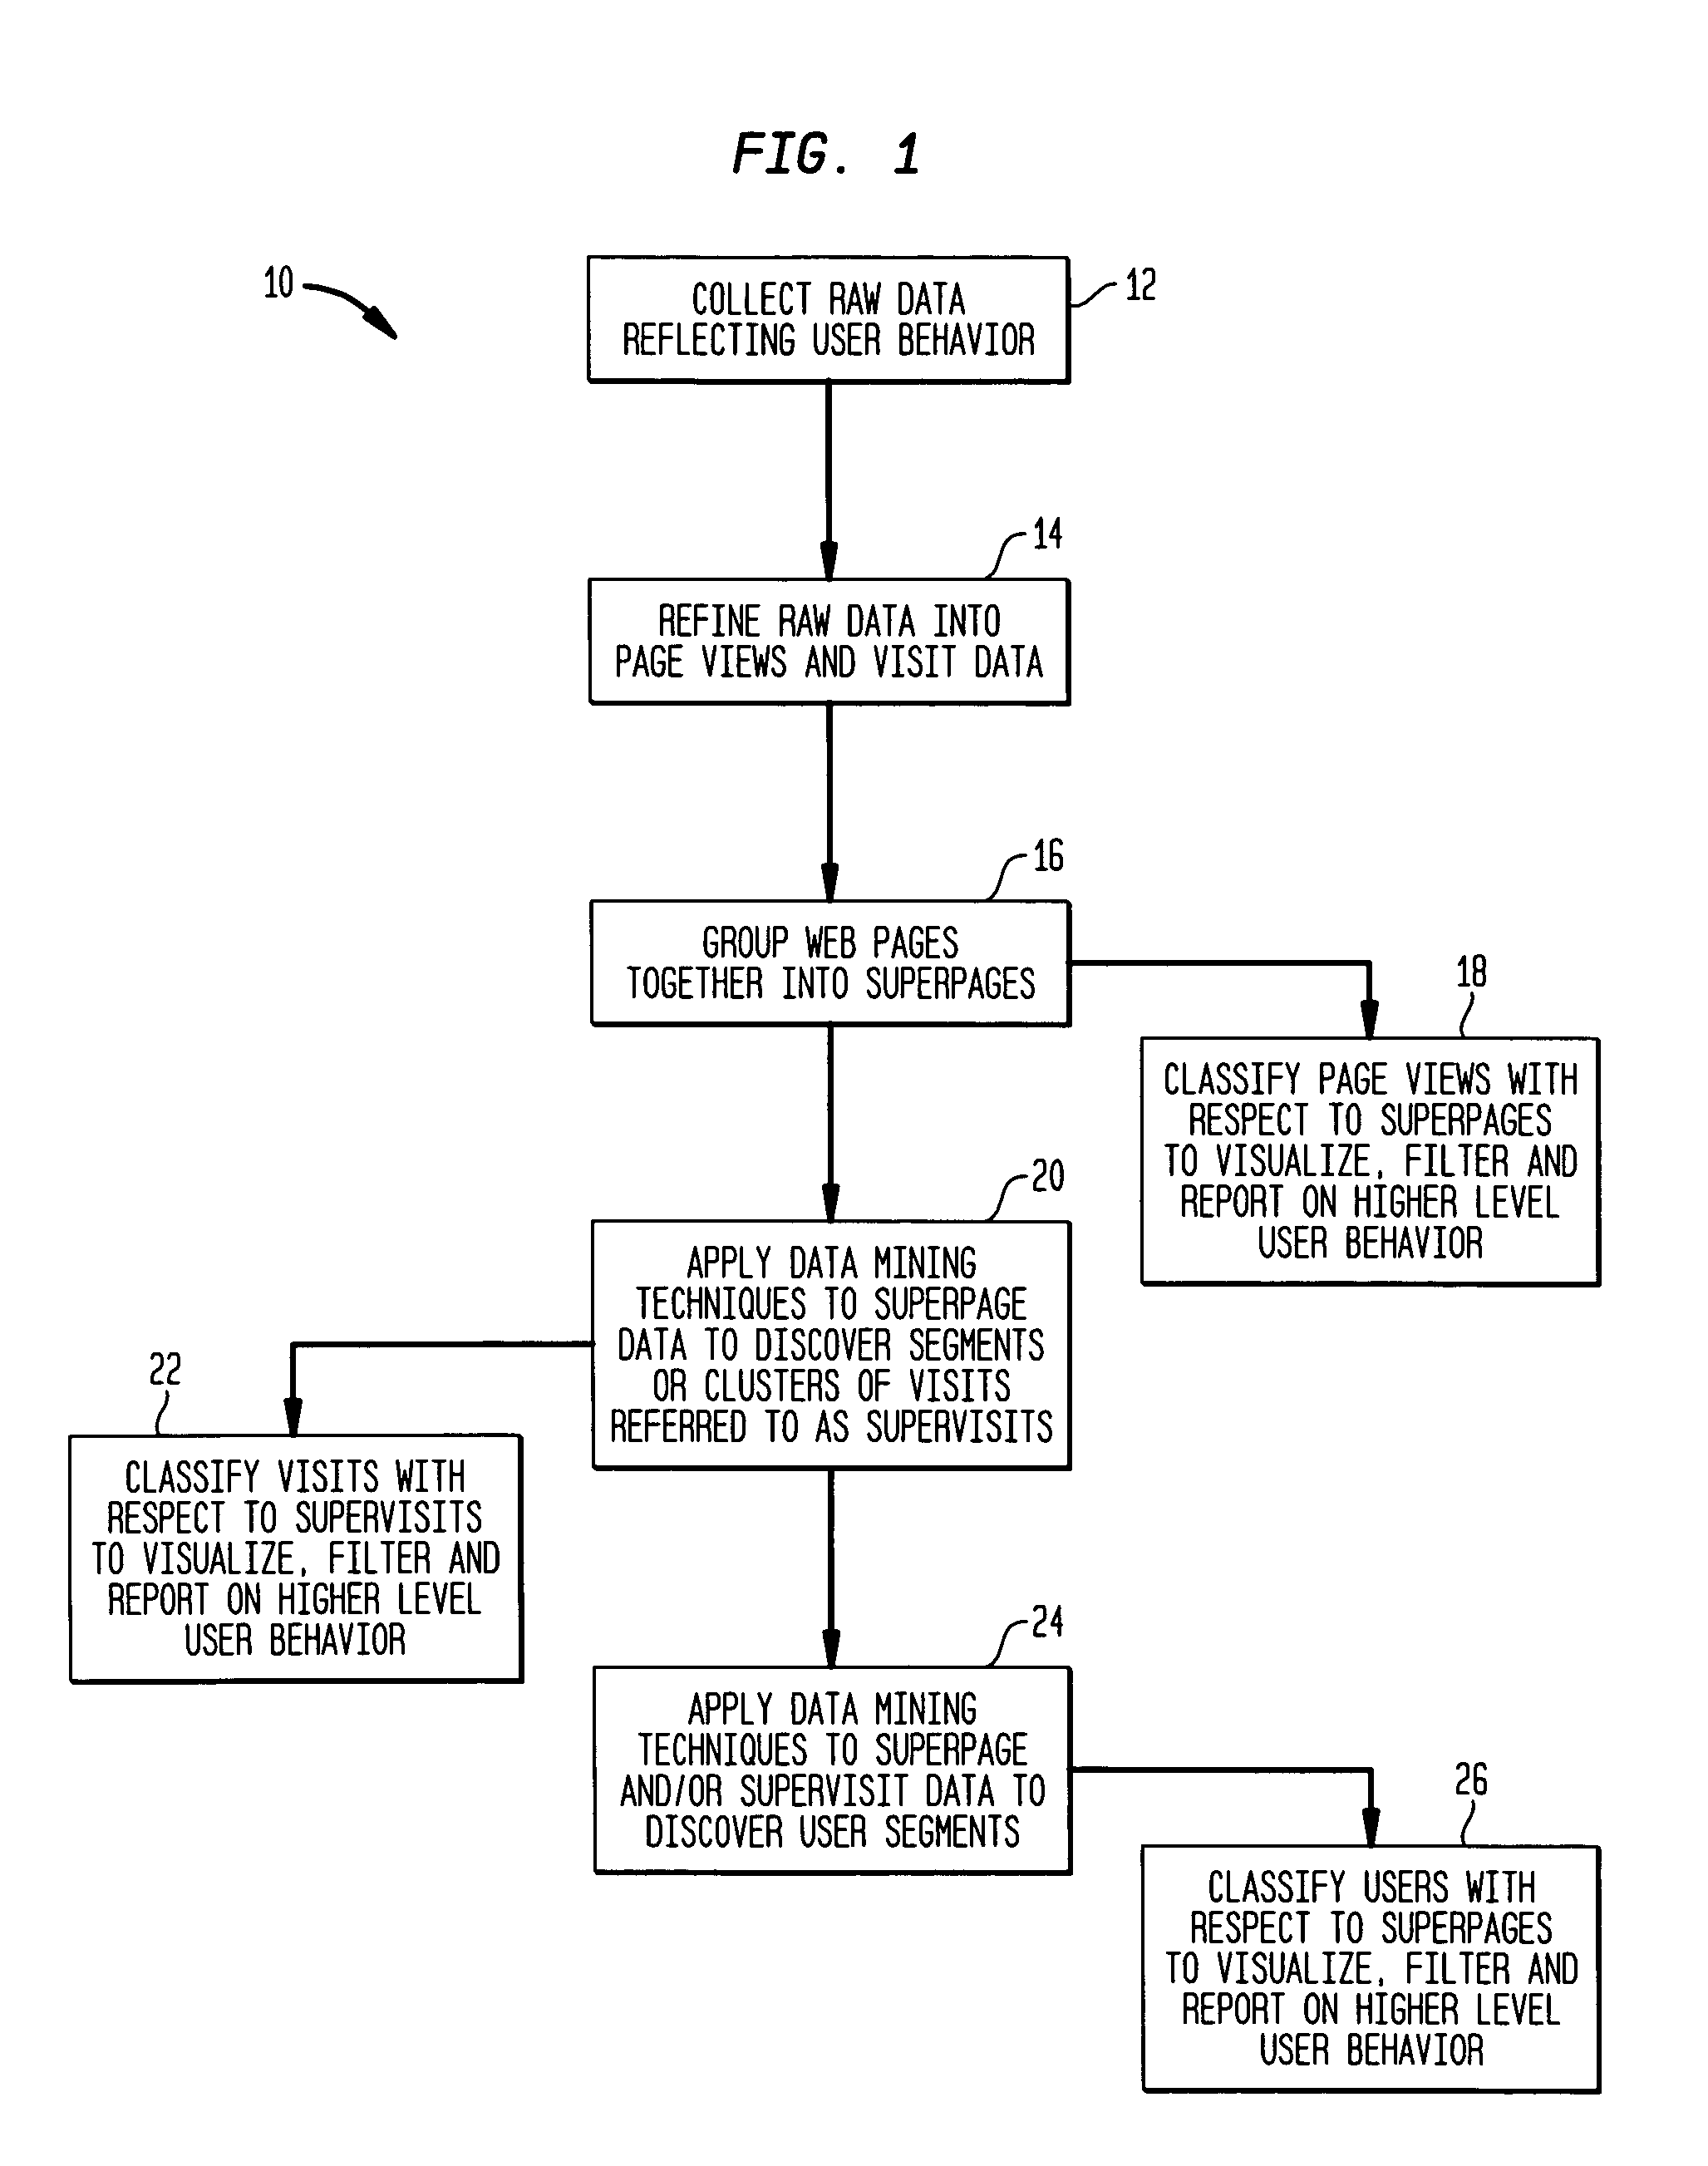
[0034]The invention provides a set of tools, described both as methods and as systems for carrying out data analysis, for converting physical or low level data reflecting the behavior of users in a networked computer environment into a high level or logical view of user behavior that be used for Web-site optimization, personalized marketing, and customer relationship management.

[0035]In an embodiment according to the method 10 of FIG. 1, users (sometimes referred to as “visitors”) make one or more visits in a given time period with each visit typically comprising one or more page (typically HTML document) views or resource requests. Information regarding these user activities can be collected 12 from sources such as Web server logs, network packet sniffers, and browser plug-ins. These sources record individual resource requests (hits) rather than page views, and timestamps and cookies rather than coherent visit and visitor information. Accordingly, the next step in a method of the i...


PUM


Abstract

A method for logical view visualization of user behavior in a networked computer environment that includes sites that a user may visit and wherein the sites comprise pages that the user may view and / or resources that the user may request includes the step of collecting raw data representing user behavior which can include requesting resources, viewing pages and visiting sites by the user. This raw data is then refined or pre-processed into page views and visit data and stored in a data mart. Pages are clustered into super pages, and page to super page mappings reflecting the relationship between pages and super pages are stored in the data mart. An automated clustering means is applied to the page view, visit and super page data in the data mart to discover clusters of visits to define super visits having visit behavior characteristics. The visit data stored in the data mart is then scored against the super visit clusters to classify visits into super visits according to visit behavior characteristics. A system is also provided.

Description

BACKGROUND OF THE INVENTION[0001]With the acceptance of the World-Wide-Web (“the Web”) as a core business platform, many enterprises have moved beyond Web sites that offer little more than static brochureware to develop sophisticated Web based application and dynamically generated content. These businesses have invested heavily to create robust and dynamic e-commerce sites that link intranets, extranets, and the Internet as they use the Web as an important mechanism for customer relationship management. These businesses have moved into the world of e-business, a world that encompasses not only e-commerce, but includes internal applications that improve an enterprise's overall sales, marketing and support process.[0002]With substantial dollar amounts being invested in on-line businesses, businesses demand thorough cost justification and careful allocation of resources. Many marketing managers, however, are unfamiliar with the Web as a marketing medium and are unprepared to face the c...

Claims


Application Information

Patent Timeline
Patent Type & Authority Patents(United States)
IPC IPC(8): G06F15/173G06F11/32G06F11/34G06Q30/02H04L12/24H04L29/08
CPCG06F11/32G06Q30/02H04L67/20H04L67/22H04L69/329H04L41/22G06F11/3495G06F2201/875Y10S707/99937H04L67/53H04L67/535
Inventor REINER, DAVIDTAN, MINGVENTIKOS, PANAGIOTISRICHARD, ERIC
Owner NETGENESIS CORP
Why Eureka
Try Eureka