Data analysis system with automated query and visualization environment setup

a data analysis system and visualization environment technology, applied in the field of data analysis systems with automated query and visualization environment setup, can solve the problems of additional difficulty, similar difficulties now arising, and the task of tackling tedious tasks

Inactive Publication Date: 2007-05-08
SPOTFIRE
View PDF42 Cites 196 Cited by
  • Summary
  • Abstract
  • Description
  • Claims
  • Application Information

AI Technical Summary

Benefits of technology

[0026]One example of how primary user input actions are performed is by maneuvering a cursor-control device such as a mouse or trackball. Secondary user input actions may then be performed using an alphanumeric input device such as a keyboard. The user may then select the primary graphical input de

Problems solved by technology

At present, when a user wishes to analyze the data in a data base, he faces the tedious task of entering a series of search parameters via a screen of input parameters.
Similar difficulties are now also arising when a user or a search engine scans many Internet sites to match certain criteria.
This, in turn, leads to an additional difficulty—one must decide what is meant by the “strength” of a relationship how to go about measuring this strength.
Often, however, the user does not or cannot know in advance what the best measure is.
This relieves the user of the responsibility for deciding on a measure, but it also restricts the usefulness of the analysis to data that happens to fit the assumptions inherent in the linear regression technique itself.
The relational information provided by linear regression is, for example, often worse than useless for a bi-modal distribution (for example, wi

Method used


Image

  • Data analysis system with automated query and visualization environment setup
  • Data analysis system with automated query and visualization environment setup
  • Data analysis system with automated query and visualization environment setup

Examples


Embodiment Construction

Part I

[0039]The invention is well suited for interactive visualization and analysis of data from any type of data base. Just a few of the thousands of possible uses of the invention are the visualization and analysis of financial data, marketing data, demographic data, experimental data, environmental data, logistics data, World-Wide Web log files, manufacturing data, biostatistics, geographic data, and telephone traffic / usage data.

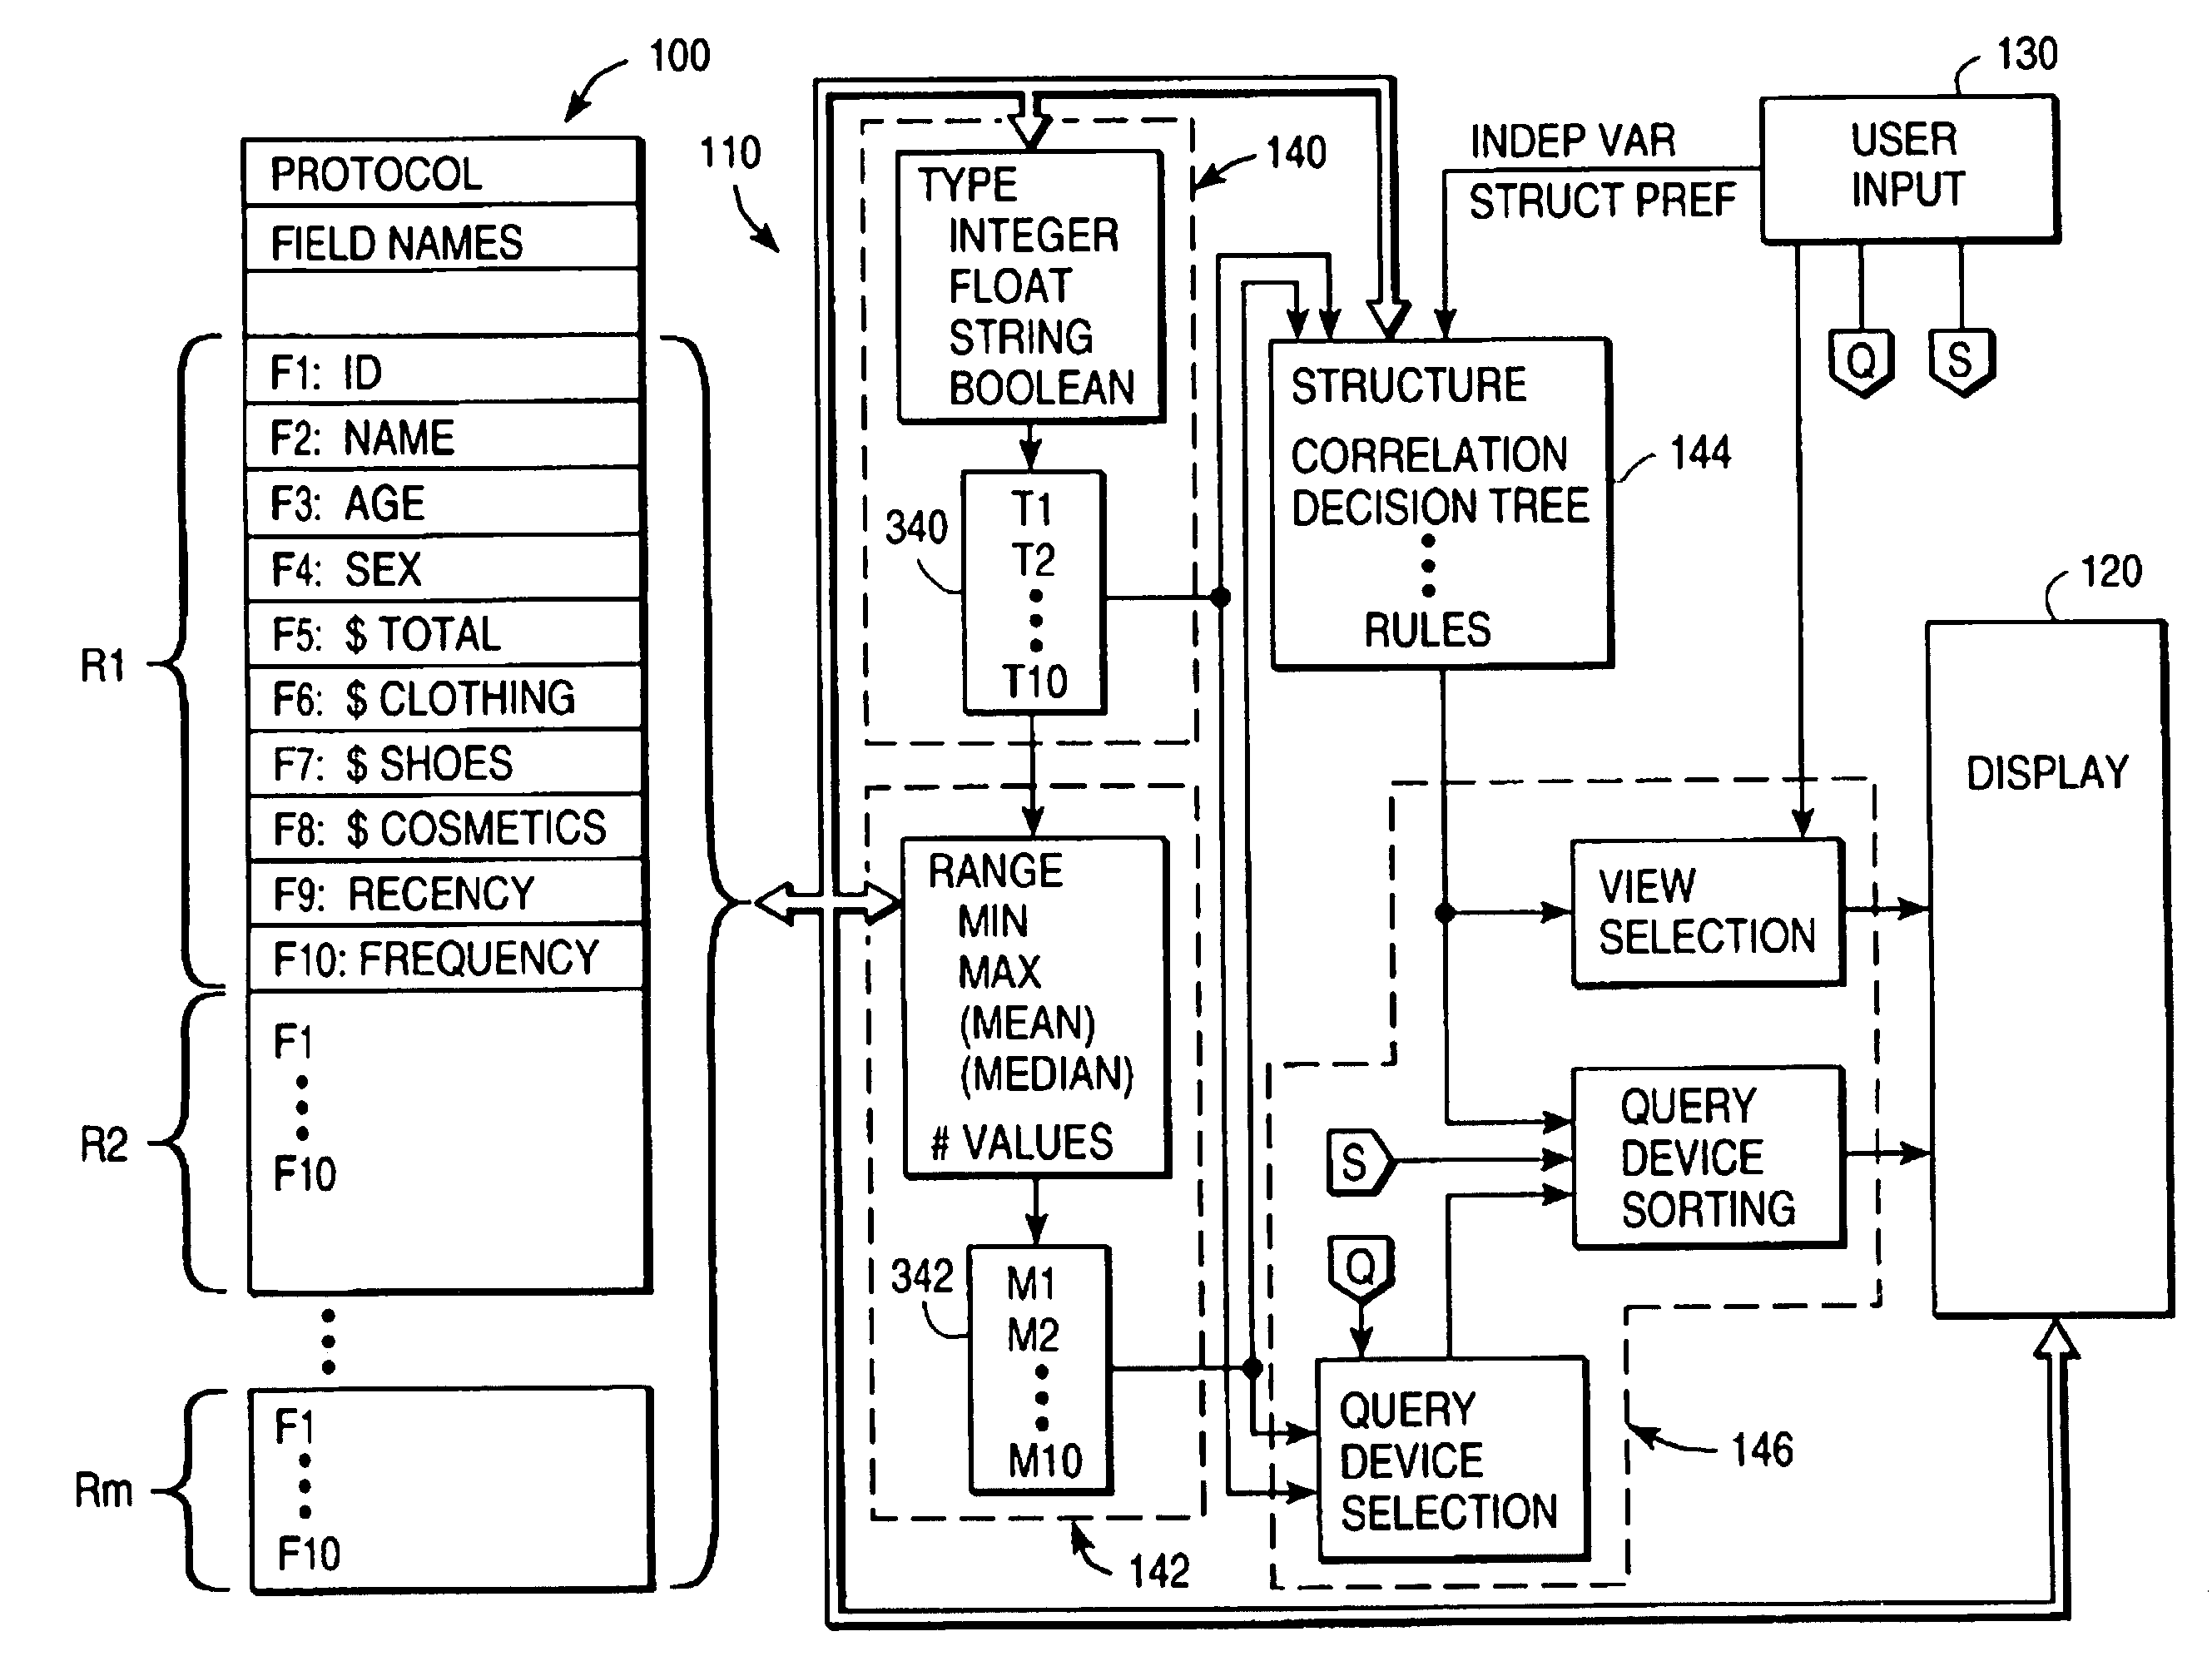
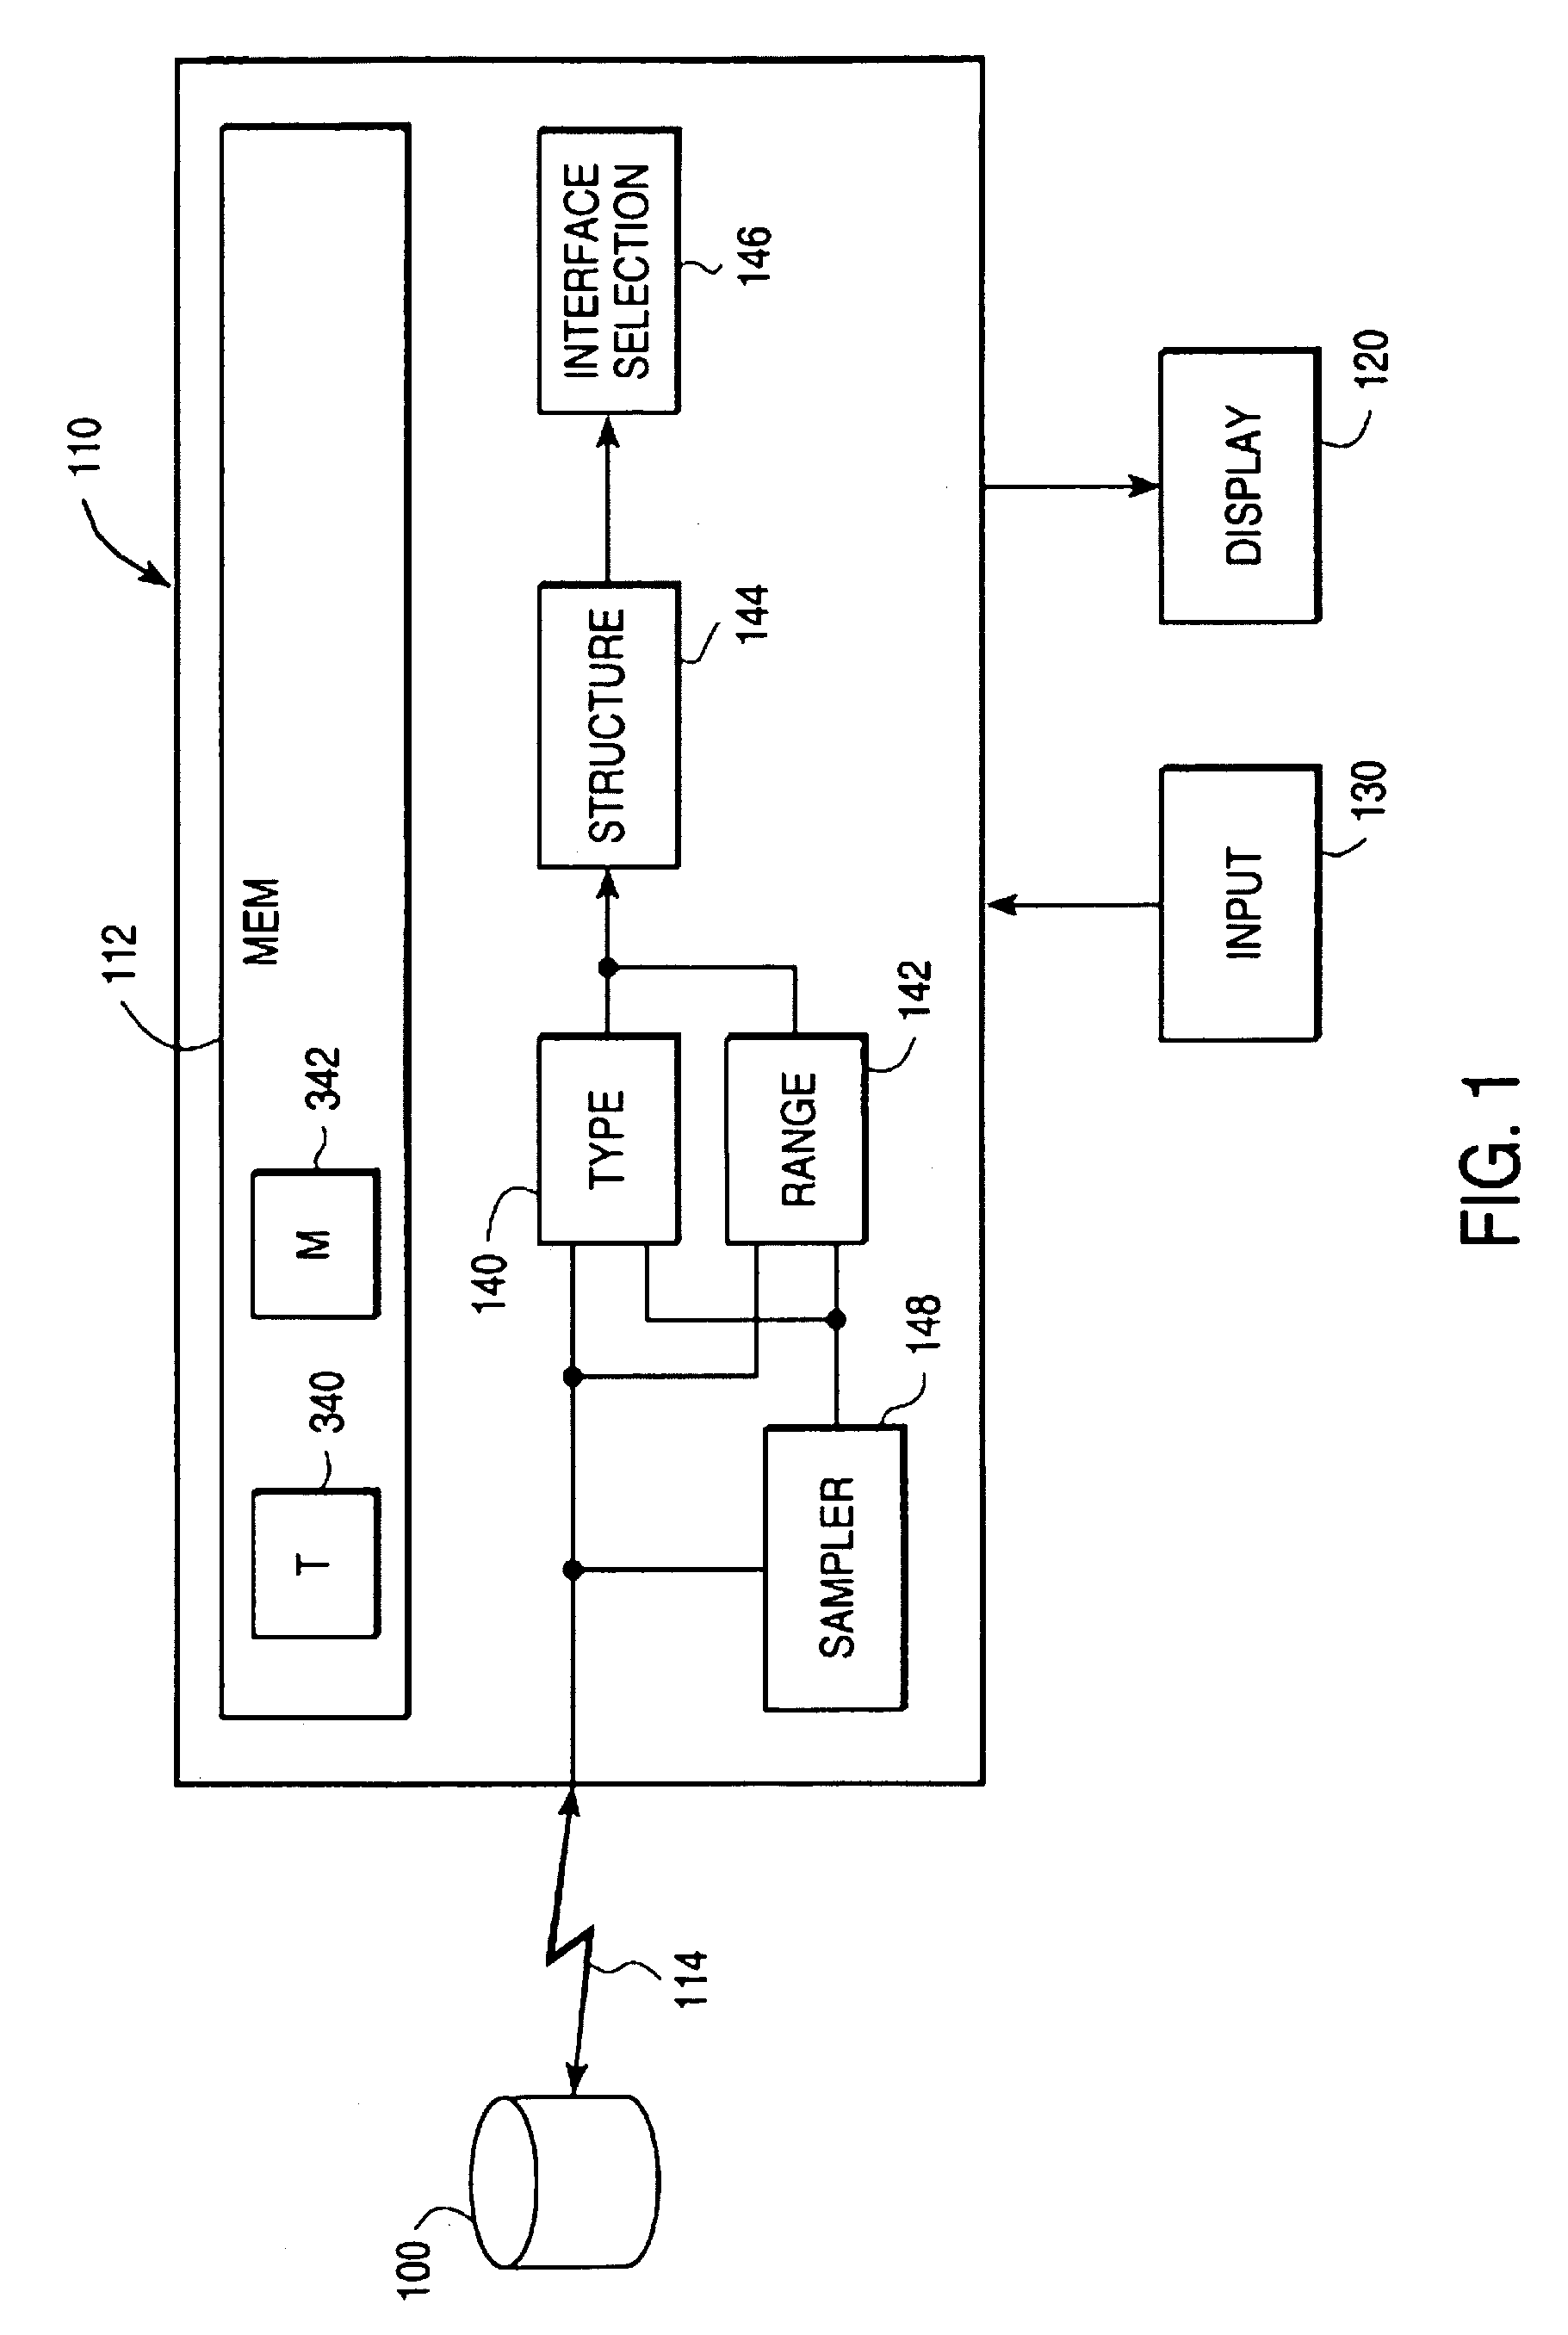
[0040]The main components of the system according to the invention are illustrated in FIG. 1. A data base or data set 100 may be stored in any conventional devices such as magnetic or optical disks or tapes and semi-conductor memory devices. The size of the data set may be arbitrary, as the invention has no inherent limitations in the size of the data base it can process.

[0041]A main processing system 110 may be implemented using a microprocessor, a mini- or mainframe computer, or even a plurality of such processors operating in parallel or as a pipeline....


PUM


Abstract

A primary graphical input device such as a scroll bar or slider is displayed in order to allow graphical input and adjustment of at least one parameter, such as the page number of a displayed document in a word-processing program or a range value in a data visualization routine. Whenever a user activates the graphical input device, the user may set and change the parameter not only purely graphically, as in conventional applications, for example by dragging some portion of the primary device by moving a mouse, but also by entering a specific value into the secondary graphical input device, for example, via a keyboard. The invention thus provides an intuitive way for a user to quickly and easily navigate graphical objects not only by using pointing devices, but also by entering alphabetic or numeric input, all while maintaining the inherent advantages of “point and click” graphical displays.

Description

CROSS-REFERENCE TO RELATED APPLICATIONS[0001]This application is a continuation-in-part of U.S. patent application Ser. No. 09 / 479,194, filed Jan. 7, 2000, now abandoned, which is a continuation-in-part of U.S. patent application Ser. No. 08 / 850,828, filed May 2, 1997, now U.S. Pat. No. 6,014,661, which claims priority from U.S. provisional application Ser. No. 60 / 019,049 filed on May 6, 1996.FIELD OF THE INVENTION[0002]This invention relates to a method and system for retrieving data, for example from a data base, and for allowing a user to selectively view the data based on interactive queries. This invention also relates to a control mechanism in a graphical user interface, in particular, to a method for specifying values in displayed icons.DESCRIPTION OF THE RELATED ARTPart I[0003]At present, when a user wishes to analyze the data in a data base, he faces the tedious task of entering a series of search parameters via a screen of input parameters. At times, the various queries mu...

Claims


Application Information

Patent Timeline
IPC IPC(8): G06F17/30G06F15/18
CPCG06F17/30398G06F17/30554Y10S707/99933Y10S707/99937G06F16/2428G06F16/248
Inventor NILSSON, MARTIN B.FASTH, ANDERS S.AHLBERG, CHRISTOPHERTRUVE, STAFFANWISTRAND, ERIK
Owner SPOTFIRE
Why Eureka
Try Eureka