
Method for robust scale-space analysis of 3D local structures in medical images

a scale-space analysis and local structure technology, applied in image analysis, image enhancement, instruments, etc., can solve the problems of prone to sensitive signal noise, too strong constraints, and inaccurate accuracy of approaches

Active Publication Date: 2007-12-11
SIEMENS HEALTHCARE GMBH
View PDF0 Cites 0 Cited by
  • Summary
  • Abstract
  • Description
  • Claims
  • Application Information

AI Technical Summary

Benefits of technology

This patent describes methods for estimating the structure of an image or video using a technique called mean shift-based bandwidth selection. This algorithm allows for the robust and accurate estimation of the covariance matrix, which describes the spread and orientation of the image. The methods can be used to analyze complex 3D structures, such as tumors, and provide a more flexible and robust way to estimate the size of target objects in the medical domain. The technical effects of this patent are improved accuracy and flexibility in estimating the structure of images and videos.

Problems solved by technology

A problem in the volumetric medical image analysis is to characterize the 3D local structure of tumors across various scales, because the size and shape of tumors varies largely in practice.
However, these prior art approaches are prone to be sensitive to signal noises and their accuracy degrades when the target shapes differ largely from an isolated Gaussian.
In the medical domain, these constraints are too strong since many tumors appear as irregular shapes within noisy background signals.

Method used


Image

  • Method for robust scale-space analysis of 3D local structures in medical images
  • Method for robust scale-space analysis of 3D local structures in medical images
  • Method for robust scale-space analysis of 3D local structures in medical images

Examples


Embodiment Construction

1. Fixed-bandwidth Mean Shift Vector for Continuous Signals

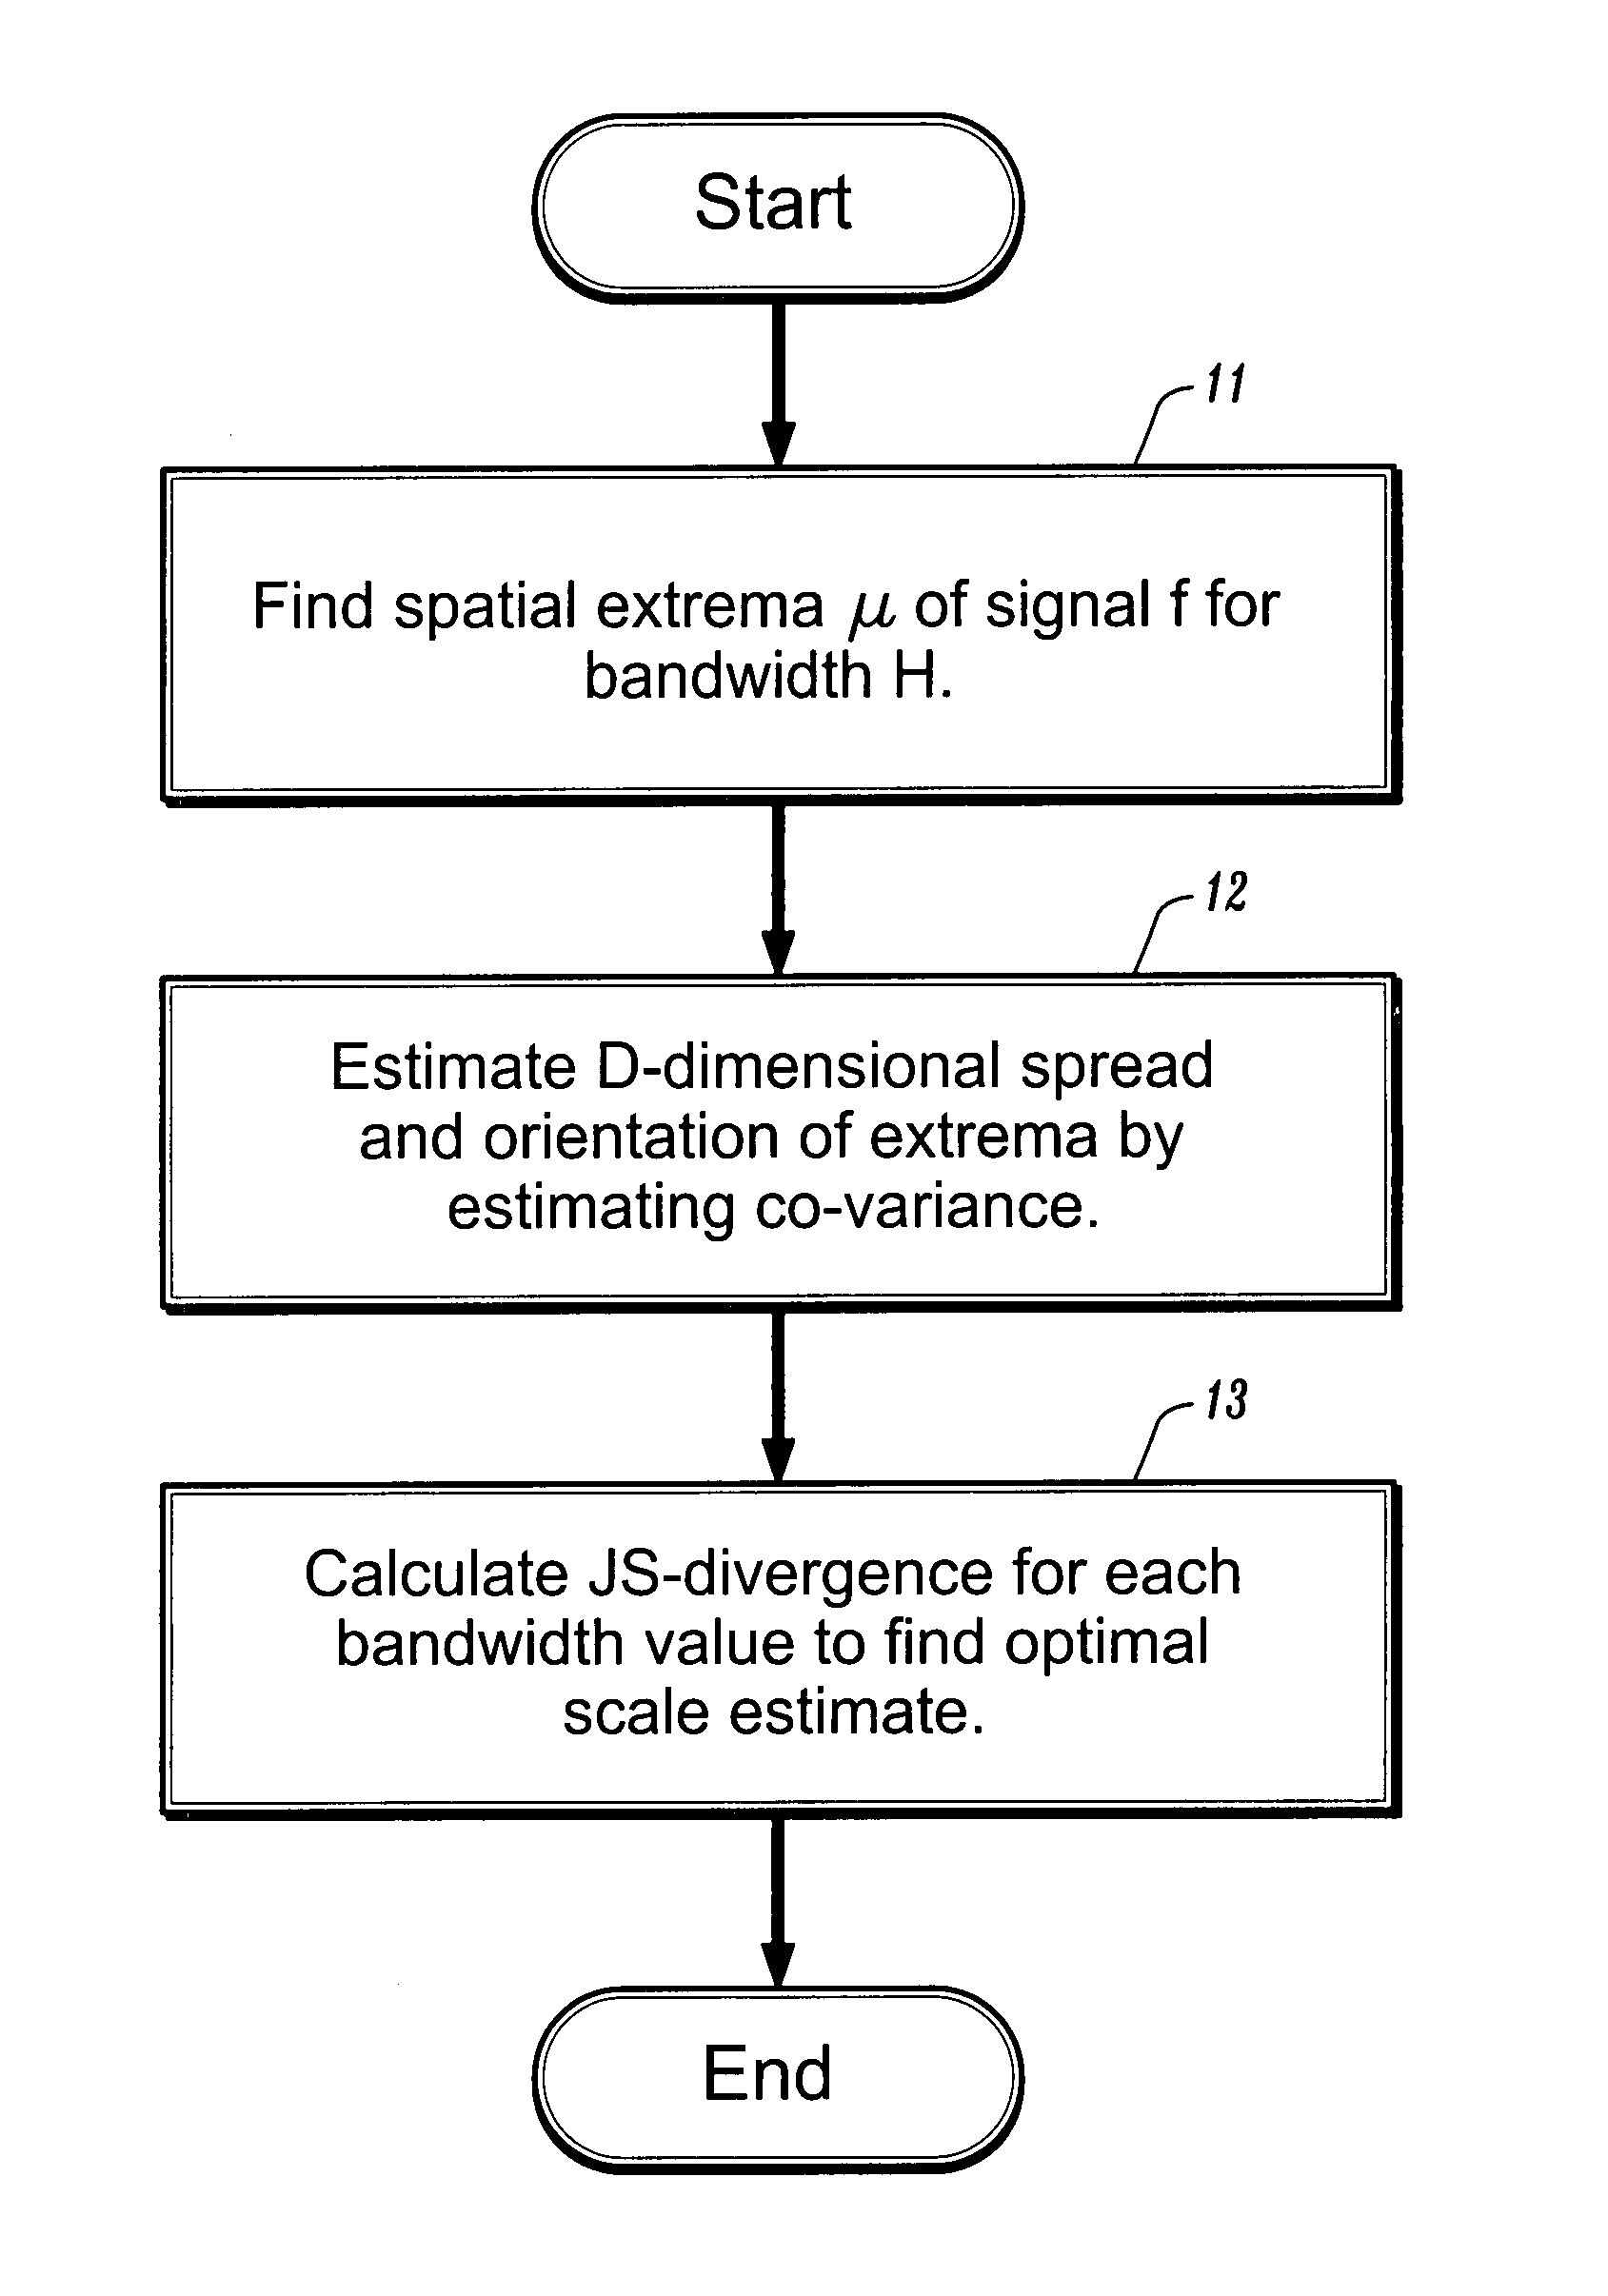
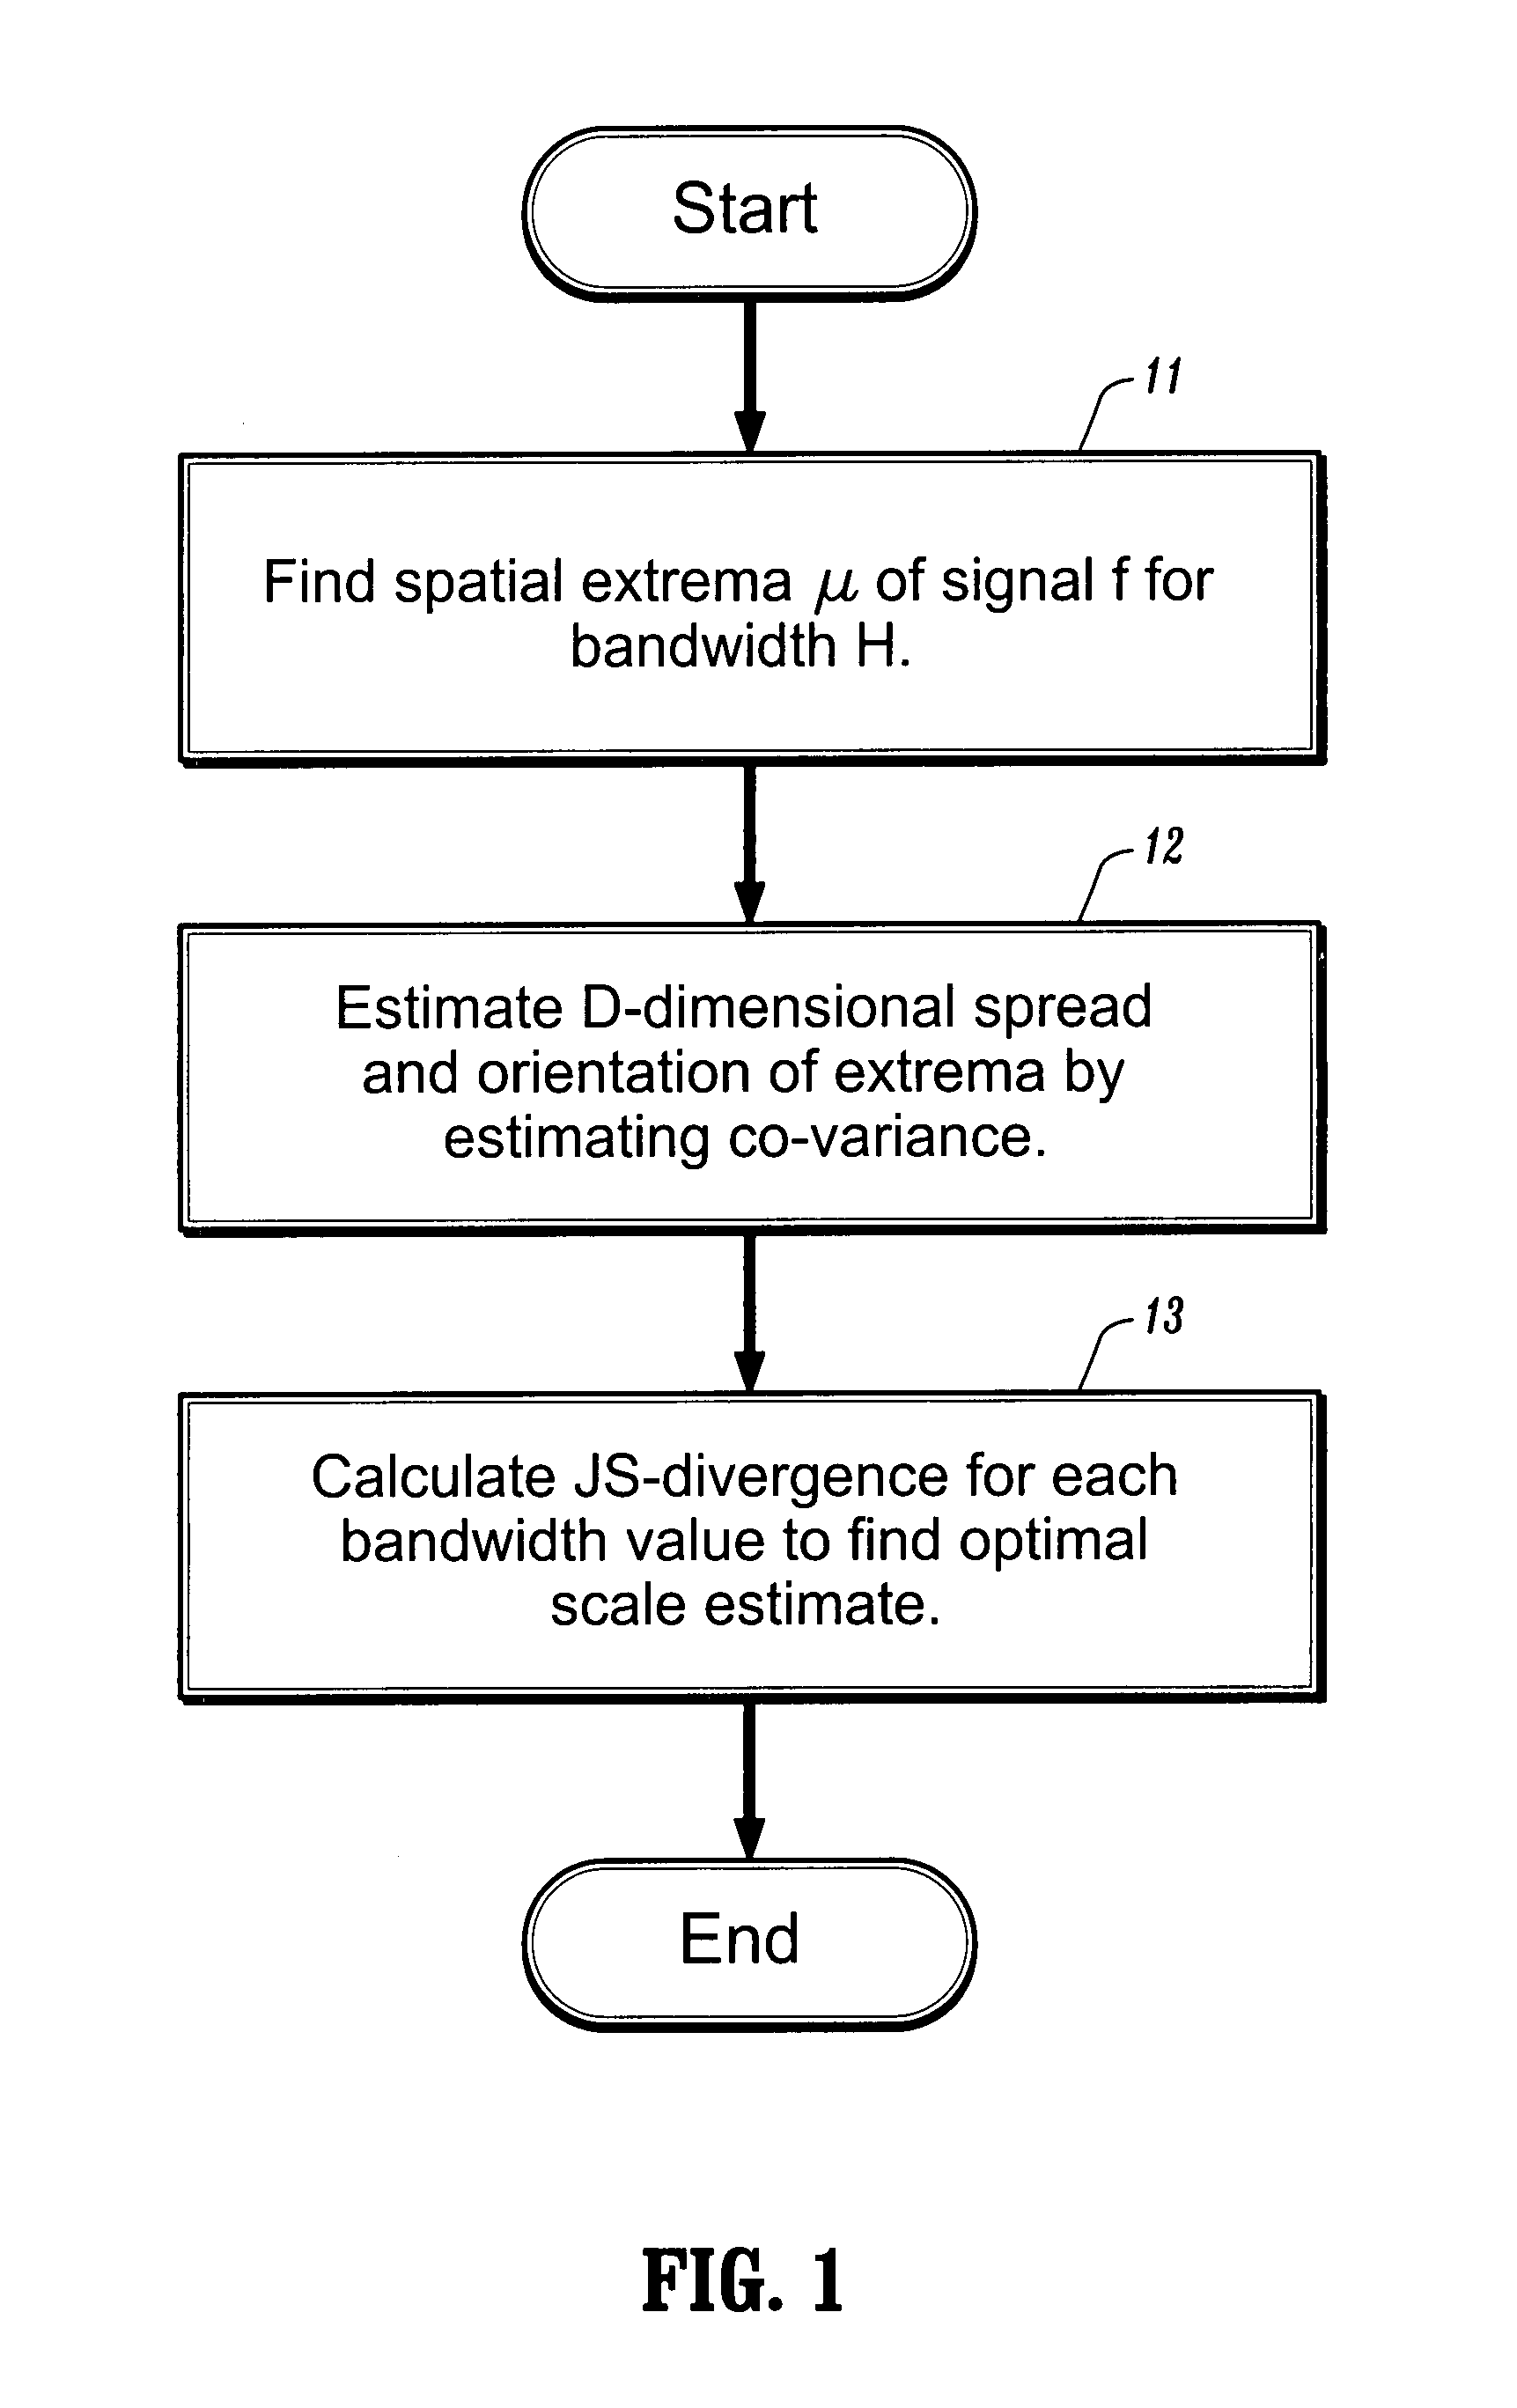
[0009]A medical image can be represented by a D-dimensional continuous signal f:RD→R evaluated at n d-dimensional points xi, and the uncertainty associated with each point xi can be represented by a D×D matrix Hi, for an i∈1, . . . n. The matrices Hi are referred to as bandwidth matrices. The signal can have one or more extrema. An extrema of the signal can be associated with a location of a tumor or other target object. Referring now to FIG. 1, a first step in the analysis of the medical image represented by f is to determine, at step 11, the spatial extrema μ of the signal. To find the extrema, one can first define a function, m (x; H), where x is a spatial location corresponding to a signal measurement and H is the corresponding bandwidth, referred to herein as an extended mean shift vector, by

[0010]m⁡(x;H)≡∫μ⁢⁢Φ⁡(x-μ;H)⁢f⁡(μ)⁢ⅆμ∫Φ⁡(x-μ;H)⁢f⁡(μ)⁢ⅆμ-x.(3)

where a Gaussian kernel Φ(x−μ; H) can be defined as

[0011]exp⁡(-12⁢D2⁡...


PUM


Abstract

A method for determining the location, shape and orientation of a tumor in a medical image includes finding a plurality of spatial extrema μ of a D-dimensional spatial signal f for a set of bandwidths H by performing mean shift-based gradient-ascent iterations for a set of bandwidths H and then determining a D-dimensional spread and orientation of the signal about each extrema μ by estimating a covariance Σ of the signal f for each extrema μ. The optimal estimate of μ and Σ is determined by performing a Jensen-Shannon divergence on the full set of μ and Σ.

Description

CROSS REFERENCE TO RELATED UNITED STATES APPLICATIONS[0001]This application claims priority from “Robust Scale-Space Analysis of 3D Local Structures in medical Images”, U.S. Provisional Application No. 60 / 488,603 of Okada, et al, filed Jul. 18, 2003, the contents of which are incorporated herein by reference.BACKGROUND OF THE INVENTION[0002]A problem in the volumetric medical image analysis is to characterize the 3D local structure of tumors across various scales, because the size and shape of tumors varies largely in practice. Such underlying scales of tumors also provide useful clinical information, correlating highly with probability of malignancy. There are a number of previously proposed approaches addressing this problem. However, these prior art approaches are prone to be sensitive to signal noises and their accuracy degrades when the target shapes differ largely from an isolated Gaussian. In the medical domain, these constraints are too strong since many tumors appear as irr...

Claims


Application Information

Patent Timeline
Patent Type & Authority Patents(United States)
IPC IPC(8): G06K9/00G06K9/36G06K9/46G06T5/00G06T7/00G06T7/60
CPCG06K9/4671G06T7/004G06T7/60G06T2207/30096G06T2207/10072G06T2207/20016G06T2207/20101G06T2200/04G06T7/70G06V10/462
Inventor OKADA, KAZUNORICOMANICIU, DORINBOGONI, LUCA
Owner SIEMENS HEALTHCARE GMBH
Learn More