Image quality defect detection from image quality database

a technology of image quality and database, applied in the field of image quality defect detection from image quality database, can solve the problems of generating erroneous image data, undesirable to request service calls or take other corrective measures based on defective image quality data, and facilitating the utilization of data, improving measurement robustness, and confirming the accuracy of the most recently acquired image quality data

Active Publication Date: 2008-06-03
XEROX CORP
View PDF17 Cites 38 Cited by
  • Summary
  • Abstract
  • Description
  • Claims
  • Application Information

AI Technical Summary

Benefits of technology

[0003]The process of making measurements from the test pattern images is to a certain extent subjective and therefore can be prone to generation of erroneous image data. It is undesirable to request a service call or take other corrective measures based upon defective image quality data. A common practice for detecting banding and streaking defects is to compute the 1D amplitude spectrum of test prints, analyze them, and then conclude whether banding or streaking is a problem and the characteristics of the problem. Prior art practices were to perform the image quality analysis based on a test print, or multiple test prints to determine the current state of the image quality of the IOT. Some systems including IOTs have the capability of storing image quality data in a database relating the image quality data to the time at which it was analyzed. One such system is the six sigma image quality system. With the advent of six-sigma image quality (SSIQ) system and other similar systems in which image quality data is stored in a time stamped manner, it becomes possible to track the image quality performance over time using the image quality database, IQDB. Such tracking can even be automated.
[0015]The ability to detect and track the degree of banding defects over time is important for monitoring the print quality of the image output devices (“IOTs”). Maintaining such a record of banding defects provides crucial information about an IOT and facilitates diagnostics on the print engine. Banding defects (i.e. undesired 1D periodic variations) can be characterized by their amplitude (in L* or a* or b* etc) and frequency. Due to the size limitation / variation of the test pattern to be measured (which imposes a limitation on frequency sampling resolution) and the measurement noises in print quality assessment, capturing the variation (spread) of the accuracy of the measured frequency (such as using confident interval) helps to characterize banding defects. Thus, the characteristics of a banding defect are referred to herein as the banding defect's amplitude a, frequency f and frequency-spread σ.
[0016]Currently the IQ data generally will be processed instantaneously and used as an indication of the “banding performance” of this given IOT at that moment. However, the accuracy of such instantaneous processing heavily depends on the accuracy of the current IQ measurement and the extent to which the current prints truly reflect the current banding performance of the IOT. Incorporating the past IQ results could alleviate the dependency on the accuracy of the current banding performance measurements and provide better repeatability of the measurements. Incorporating the past IQ results reduces the error in the banding performance measurements caused by measuring some unreasonable bad prints (or good ones) to more accurately reflect the current state of the IOT. Finally, instantaneous processing of current IQ data only precludes the possibility of inferring the future state of the banding performance of the IOT.
[0017]The errors arising from the inaccuracy of a single current IQ measurement or a current print that does not truly reflect the current banding performance of the IOT could be reduced by taking more measurements (analyze more prints) at the time of interest. However, analyzing more prints at the time of interest will not change the fact that you can do a better job if you store the IQ data over time and make intelligent use of it. Additionally, it is obvious that you cannot predict the trend if you take measurement at a fixed point in time and throw it away afterward. The ability to predict future IQ data is very useful for preventing issues caused by long-term performance drifting.
[0023]The disclosed device and method efficiently stores image quality data over time in a manner facilitating the utilization of the data to schedule servicing and / or to confirm the accuracy of the most recently acquired image quality data. An image quality defect detection algorithm, which utilizes the historical data from image quality database (IQDB) about the IOTs is disclosed that permits predictions to made about future image quality. The disclosed device and method are particularly useful for customers who track the image quality of their IOTs via database such as utilizing a six-sigma image quality system. This algorithm first reconstructs isolated amplitude spectrum from each image quality defect record in IQDB. It then combines these spectra into one cumulated spectrum via probability summation. After that, a prediction term is added to this cumulated spectrum to account for the missing data between now and the last available data in the IQDB. The disclosed device and method keep the advantages of storing only the defect records in IQDB. The disclosed device and method combine image quality defect records by applying probability summation.
[0024]The disclosed algorithm advantageously provides prediction capability and improves measurement robustness by incorporating the outcome from historical data. The disclosure also provides an efficient implementation of the algorithm by utilizing a recursive function. This algorithm also provides the flexibility for users to investigate short-term and long-term IQ trend with a simple change of probability summation parameter and / or prediction scaling factor.

Problems solved by technology

Image output devices (IOTs) have known limitations on their capability to generate images.
While image defects may exist in every image generated by an IOT, so long as the defects are such that they are within the limitations on the capability of the IOT, no service or correction is required.
However, when the defects in the image generated by the IOT are such that the IOT has the capability to generate higher quality images, corrective measures should be taken.
The process of making measurements from the test pattern images is to a certain extent subjective and therefore can be prone to generation of erroneous image data.
It is undesirable to request a service call or take other corrective measures based upon defective image quality data.
However, the raw amplitude spectrum cannot be recomputed from the banding defect record.
However, analyzing more prints at the time of interest will not change the fact that you can do a better job if you store the IQ data over time and make intelligent use of it.
Additionally, it is obvious that you cannot predict the trend if you take measurement at a fixed point in time and throw it away afterward.
Storing all of this data can become inefficient.
The disadvantage is that the full amplitude spectrum cannot be recovered from its banding record.
As the above example illustrates, without a well-thought strategy, combining results across banding records could do harms rather than good.
This is certainly not efficient since the amount of data required to capture all detectable banding defects are much smaller than that of the raw spectral data.
Even if the storage is not an issue, there is still the issue of how to combine the spectral data over time.
If the IQDB stores only the summarized banding defect records for efficiency and storage reasons, combining these records over time becomes even more of a challenge than that described above with regard to Record #1 and Record #2.

Method used


Image

  • Image quality defect detection from image quality database
  • Image quality defect detection from image quality database
  • Image quality defect detection from image quality database

Examples


Embodiment Construction

[0038]For the purposes of promoting an understanding of the principles of the disclosure, reference will now be made to the embodiments illustrated in the drawings and described in the following written specification. It is understood that no limitation to the scope of the disclosure is thereby intended. It is further understood that the present invention includes any alterations and modifications to the illustrated embodiments and includes further applications of the principles of the invention as would normally occur to one skilled in the art to which this invention pertains.

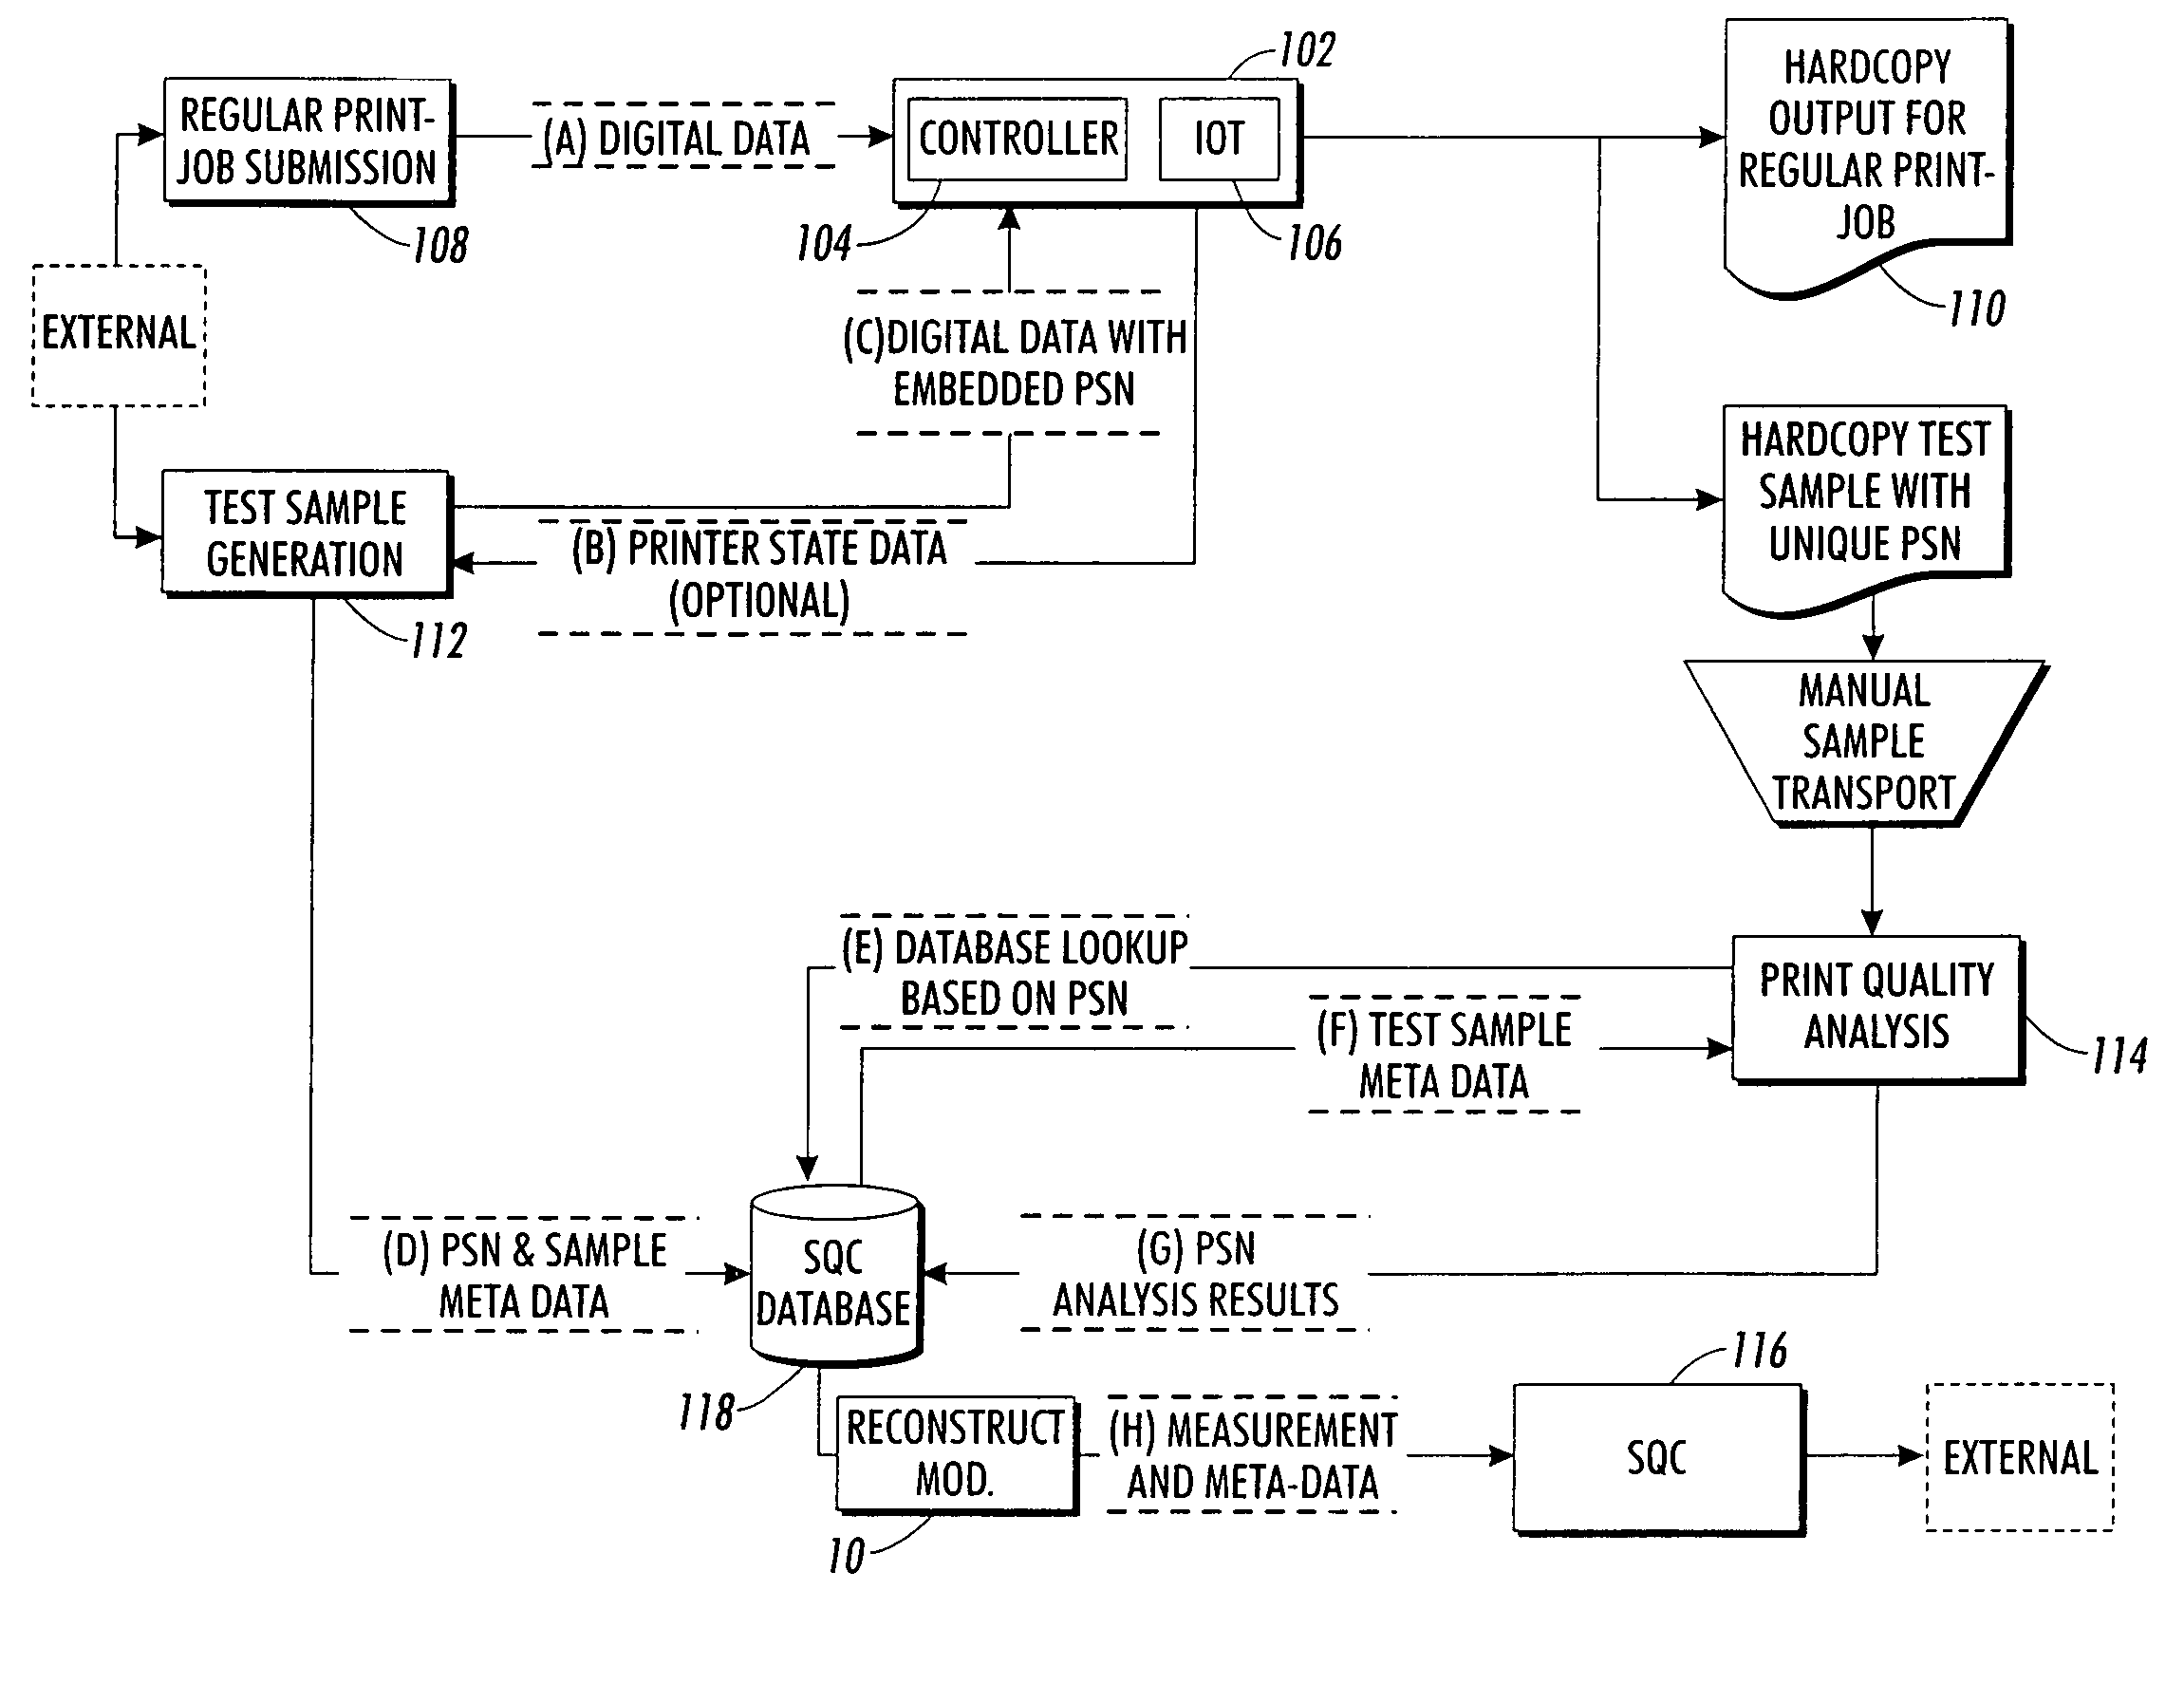
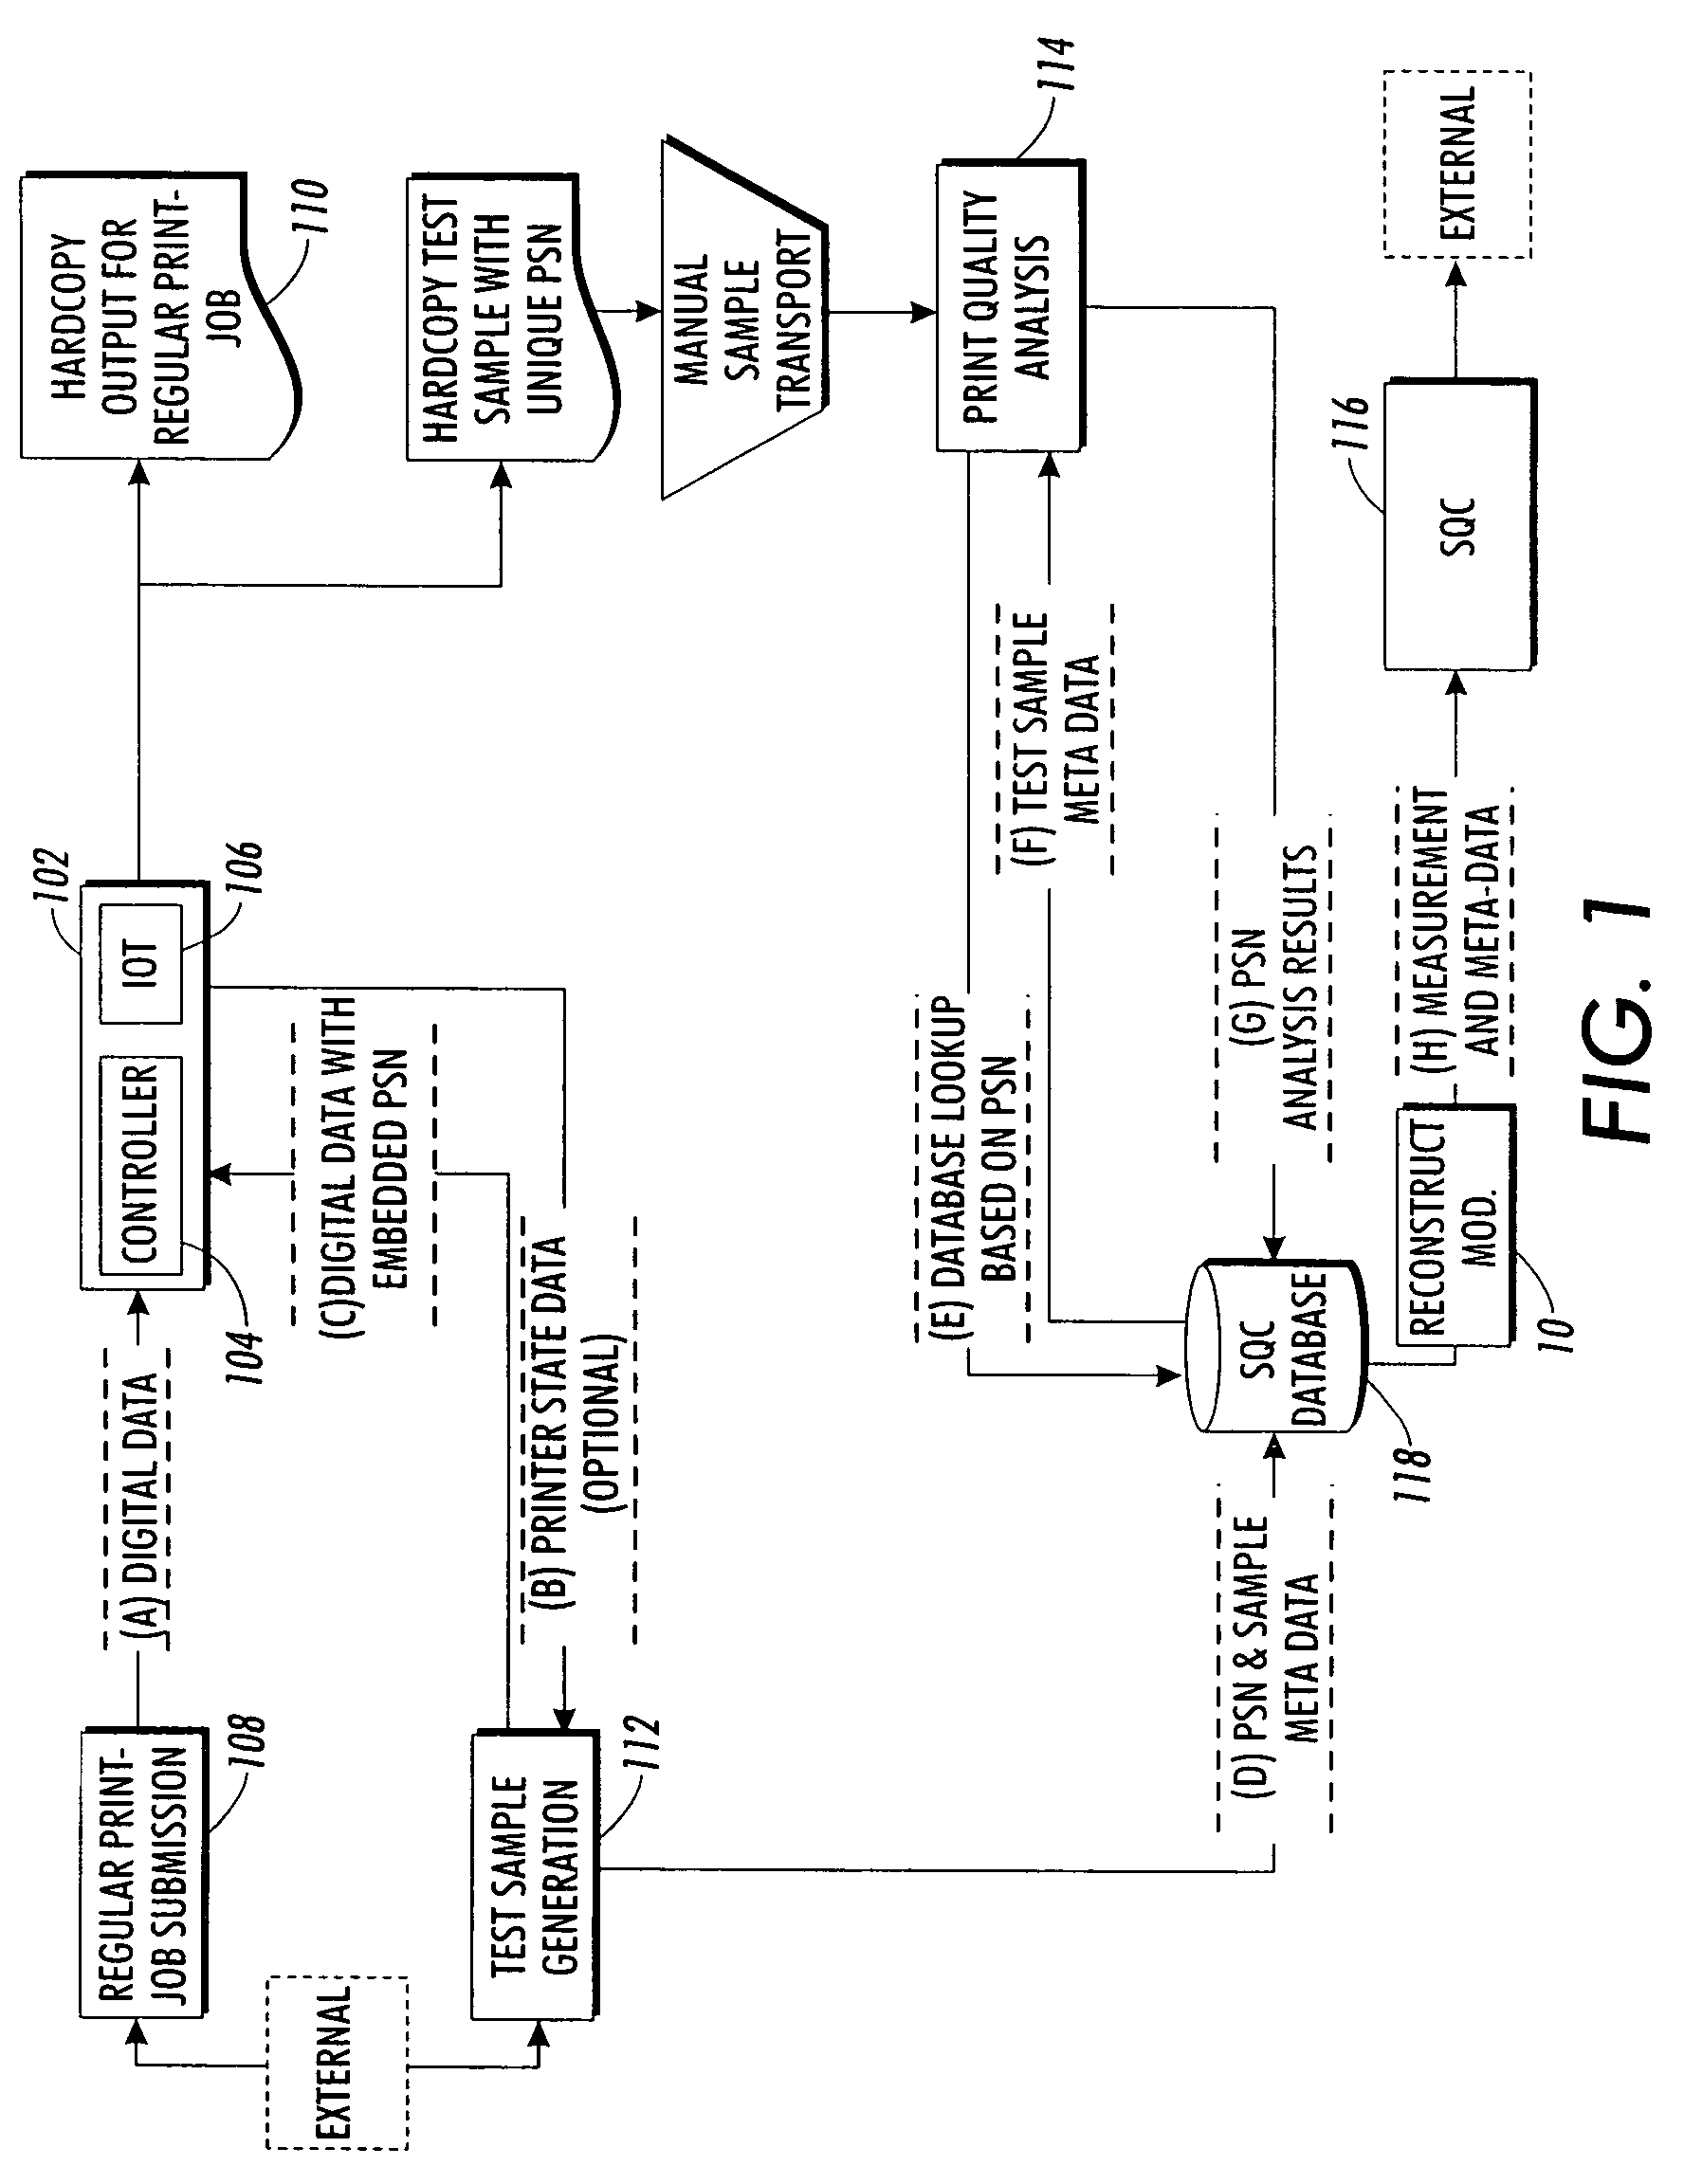
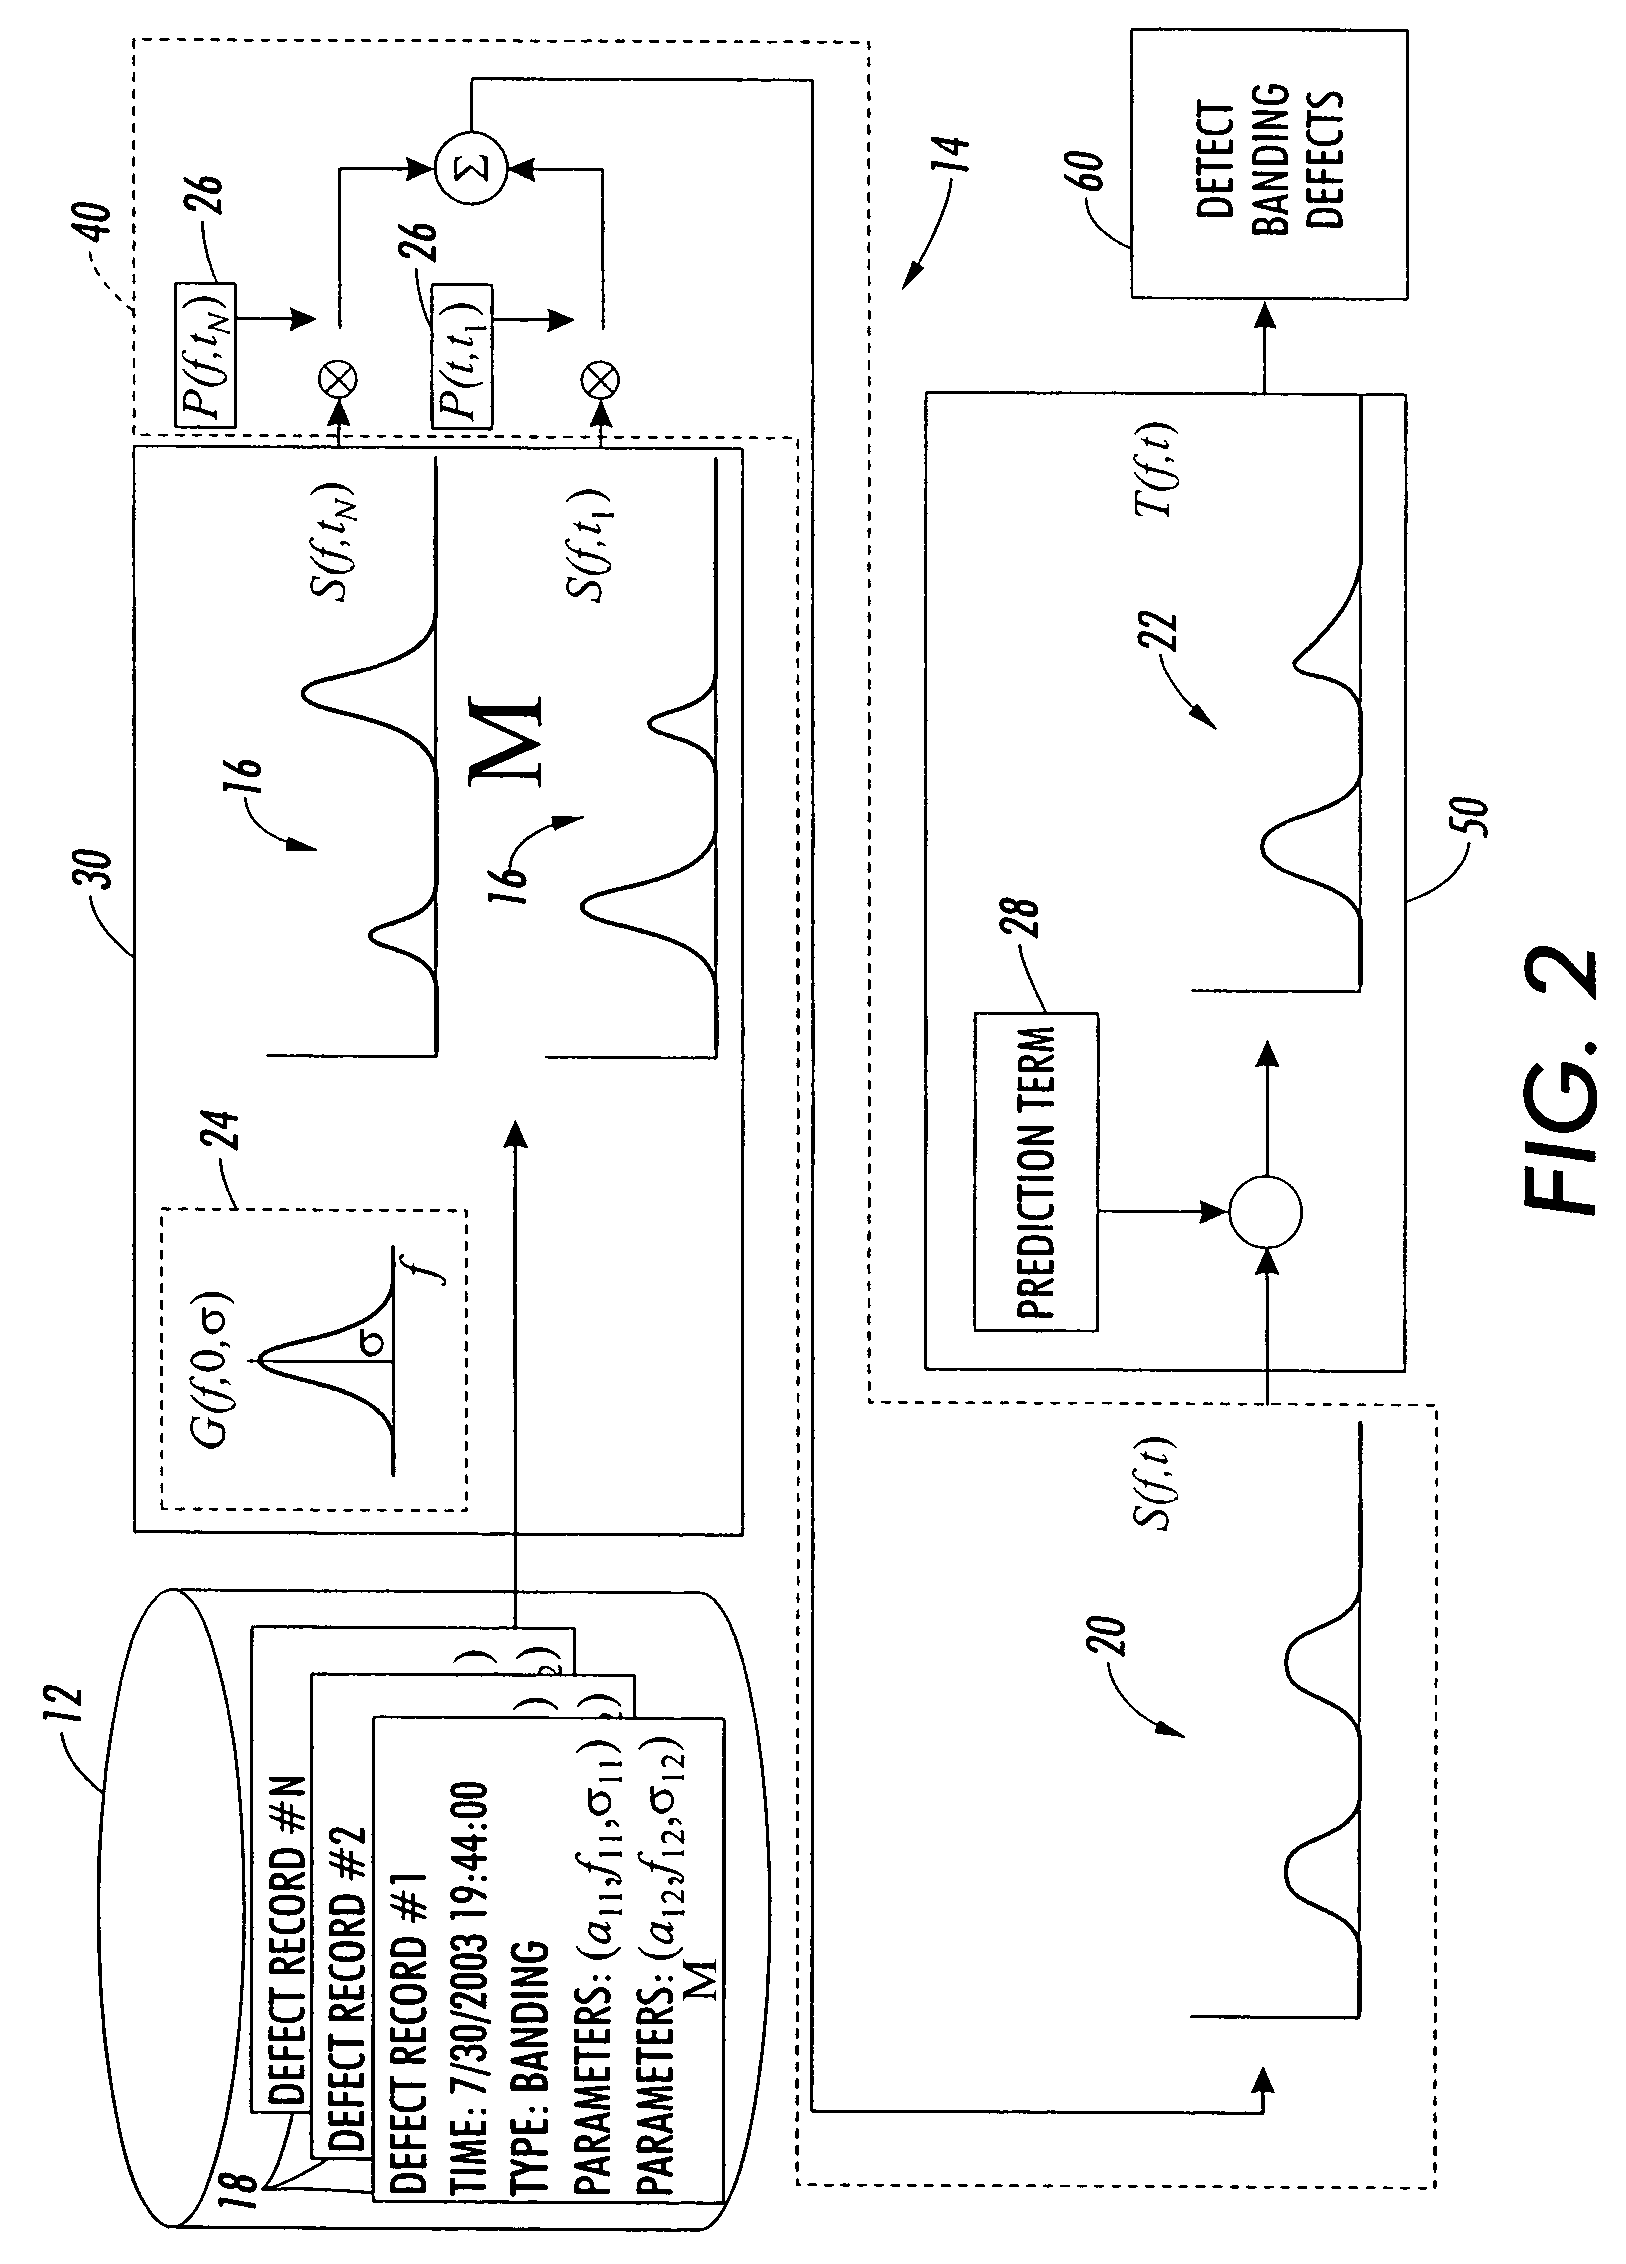
[0039]The disclosed method of detecting banding defects may be implemented in a six sigma image quality (“SSIQ”) system 100 by implementing a reconstruction module 10 that utilizes the historical data from the image quality database (IQDB) 12 stored in the database 118 about the image output devices (“IOTs”) 106 and makes predictions when necessary. While the disclosed reconstruction module 10 implements a ban...


PUM

PropertyMeasurementUnit
banding defectsaaaaaaaaaa
frequencyaaaaaaaaaa
spectraaaaaaaaaaa

Abstract

A method of detecting image quality defects in the output of an image output device includes the steps of generating a test pattern at a known time, analyzing the test pattern to generate image quality defect records, storing the image quality defect records in memory linked to a time stamp indicating known time when the test pattern was generated, repeating the generating, analyzing and storing steps at a plurality of different known times to generate a database of time stamped image quality defect records, reconstructing isolated defect data from each of a plurality of image quality defect records in the database, constructing cumulative defect data by probabilistic summation of the isolated defect data and analyzing the cumulative defect data using an image quality assessment / analysis engine.

Description

BACKGROUND AND SUMMARY[0001]This invention relates to imaging devices and more particularly to imaging devices that automatically implement statistical quality control.[0002]Image output devices (IOTs) have known limitations on their capability to generate images. While image defects may exist in every image generated by an IOT, so long as the defects are such that they are within the limitations on the capability of the IOT, no service or correction is required. However, when the defects in the image generated by the IOT are such that the IOT has the capability to generate higher quality images, corrective measures should be taken. In order to determine whether the images generated by an IOT are within the tolerances of the output of the IOT, it is common practice to occasionally print test pattern pages. Commercial print operations often use statistical quality control (SQC) of their printed products to be able to guarantee to their customers the quality of the prints. These test ...

Claims


Application Information

Patent Timeline
Patent Type & Authority Patents(United States)
IPC IPC(8): G03F3/08
CPCH04N1/40H04N1/40006
Inventor WU, WENCHENG
Owner XEROX CORP
Why Eureka
Try Eureka