
Method for visually displaying quantitative information in medical imaging data records

a technology of medical imaging and data records, applied in image enhancement, tomography, instruments, etc., can solve the problem that the linear attenuation value of an x-ray scan cannot be used to infer the material composition of an object under examination, and achieve the effect of convenient diagnosis

Active Publication Date: 2009-01-13
SIEMENS HEALTHCARE GMBH
View PDF8 Cites 4 Cited by
  • Summary
  • Abstract
  • Description
  • Claims
  • Application Information

AI Technical Summary

Benefits of technology

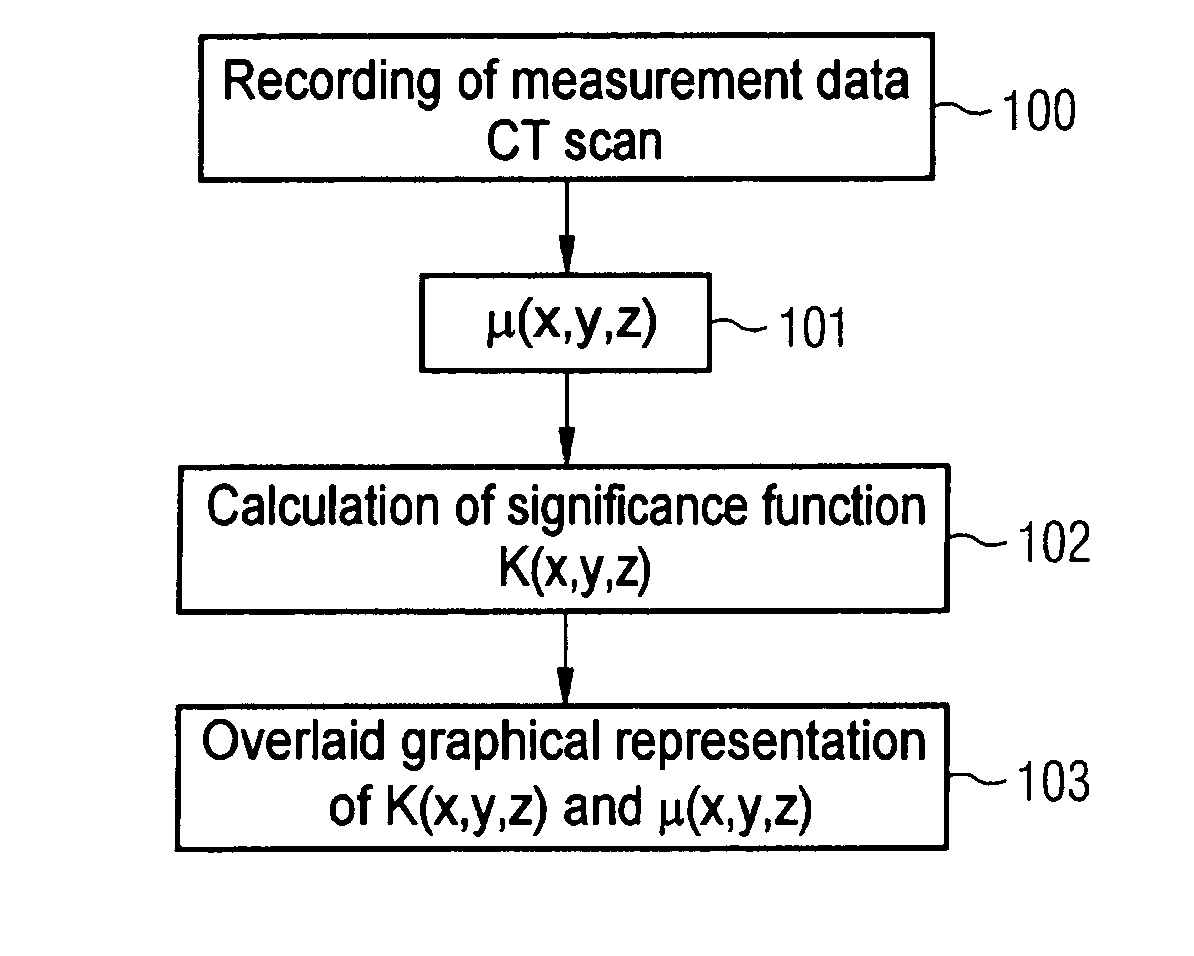
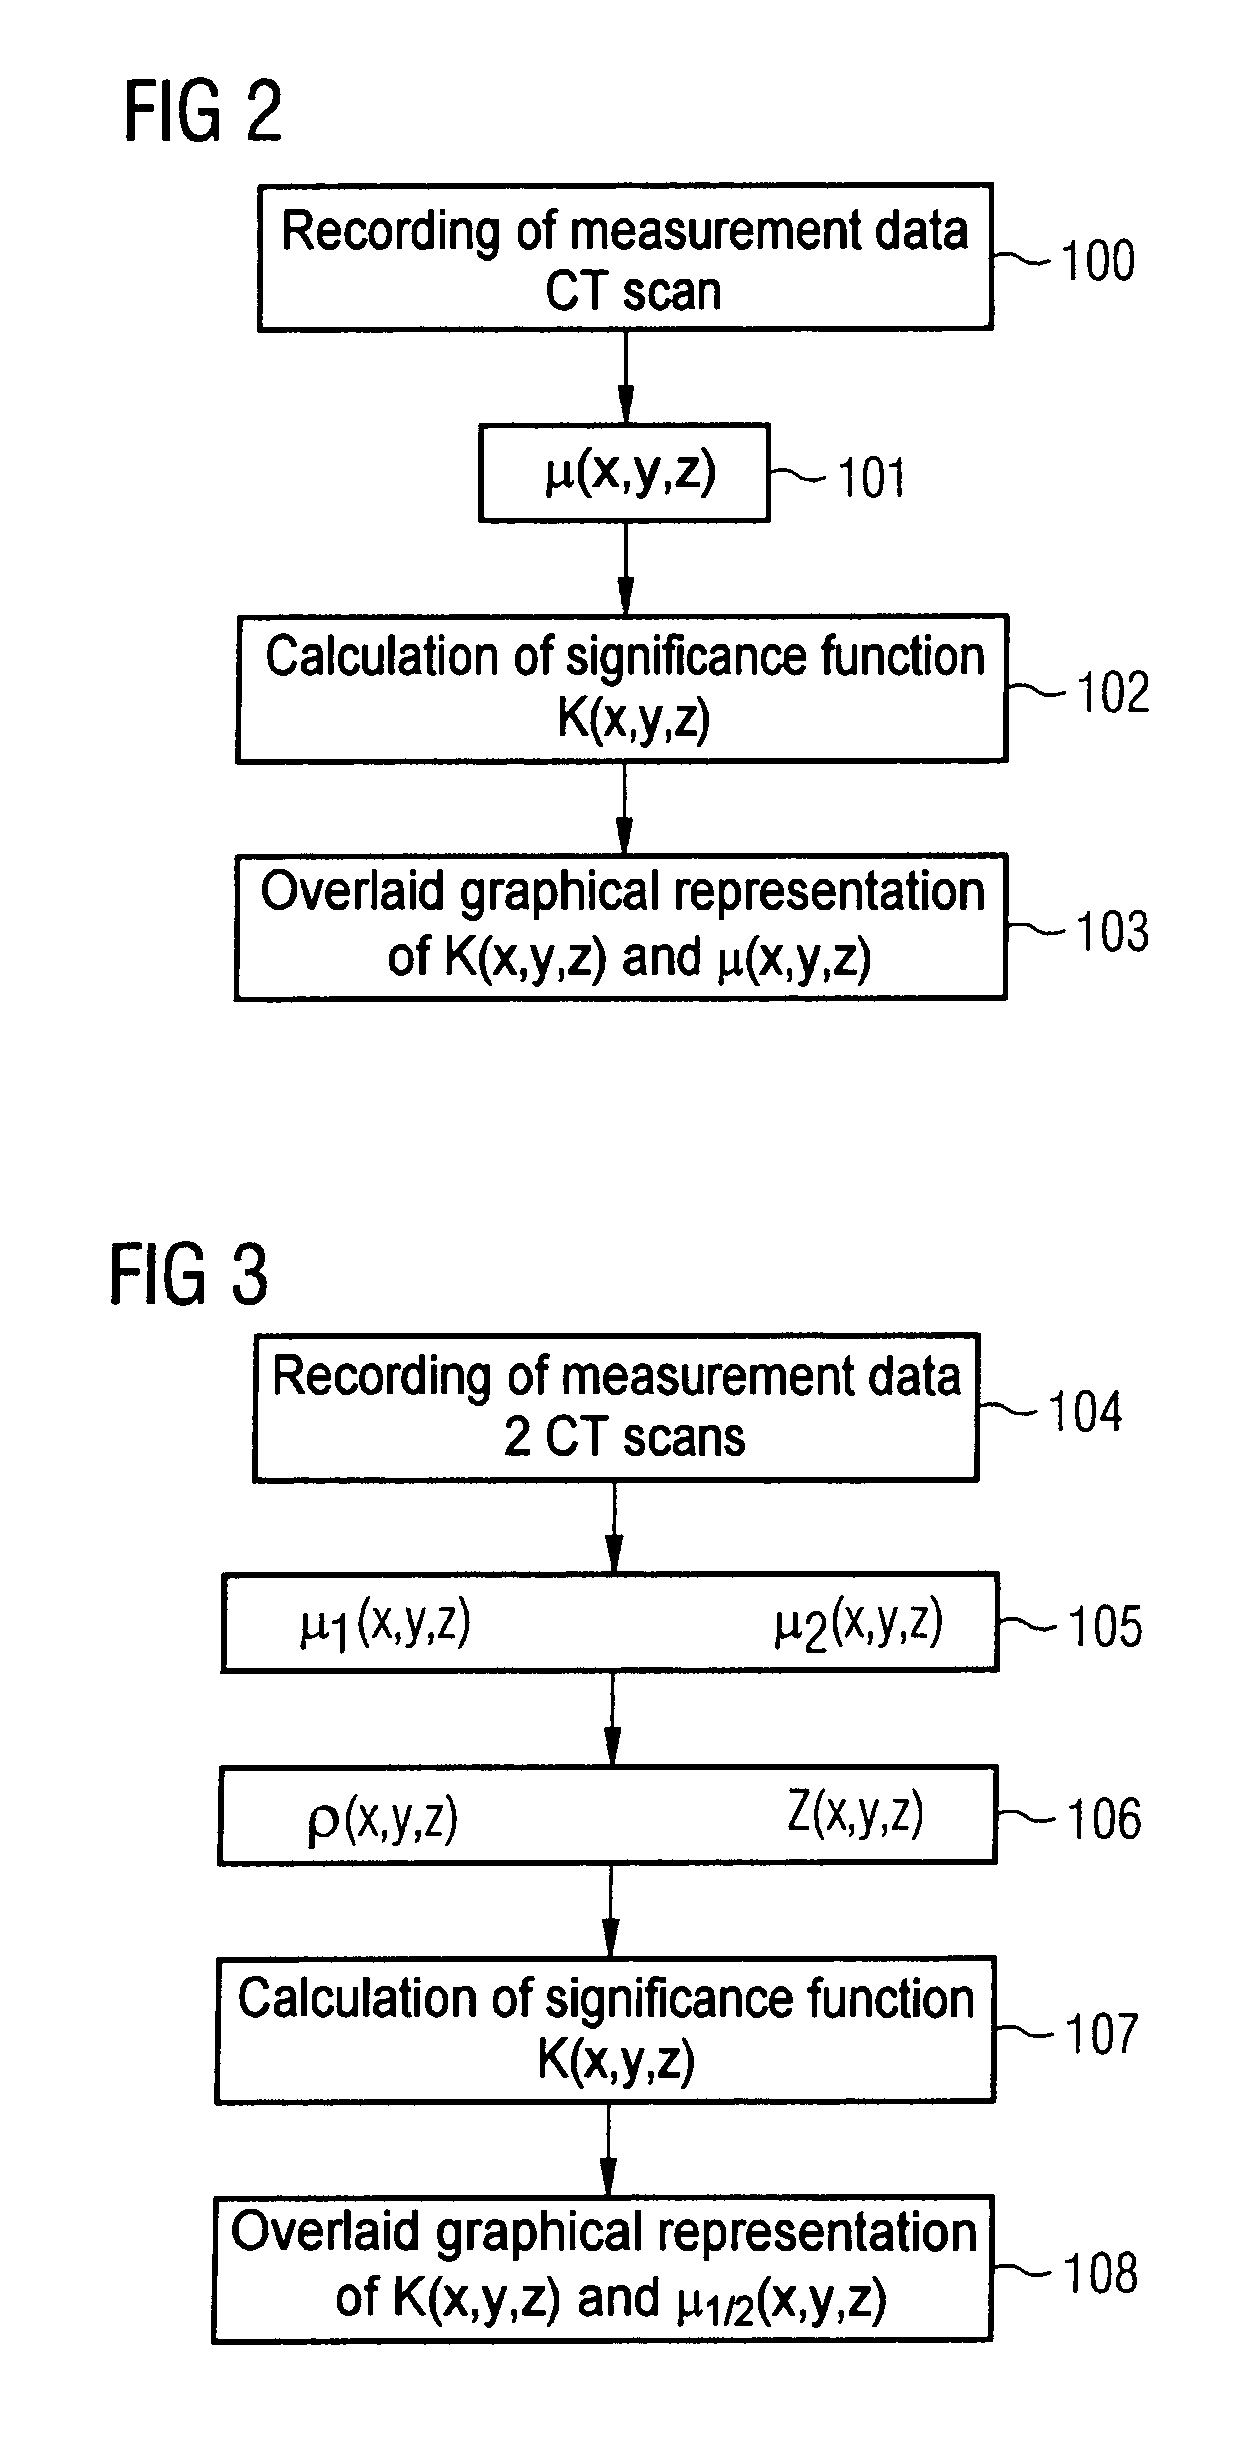
[0021]In this way, by appropriately prescribing the comparison values or value combinations, for example a particular density or a particular ordinal number, it is immediately possible to locate the regions which contain a material having these properties, i.e. the significance function indicates the greatest similarity to the prescribed values. In this case, the prescribed values or value combinations depend firstly on the type of measurement and secondly on the desired information which the user wishes to obtain from the measurement data as comprehensibly as possible. The graphical representation of the significance function, possibly as an overlay with the normal image, converts sometimes complex quantitative information into an easily diagnosable representation. The present discrimination method using the significance function produces a novel form of representation for quantitative and functional information in medical imaging, particularly in X-ray computed tomography.

Problems solved by technology

The linear attenuation value for an X-ray scan cannot be used to infer the material composition of an object under examination, however, since the X-ray absorption is determined both by the effective ordinal number for the material and by the material density.
The potential opportunities for using the quantitative information contained in the data records give rise to the problem of suitable representation of the results, so that the user of the imaging system obtains the sometimes complex quantitative information in an easily diagnosable representation.

Method used


Image

  • Method for visually displaying quantitative information in medical imaging data records
  • Method for visually displaying quantitative information in medical imaging data records
  • Method for visually displaying quantitative information in medical imaging data records

Examples


Embodiment Construction

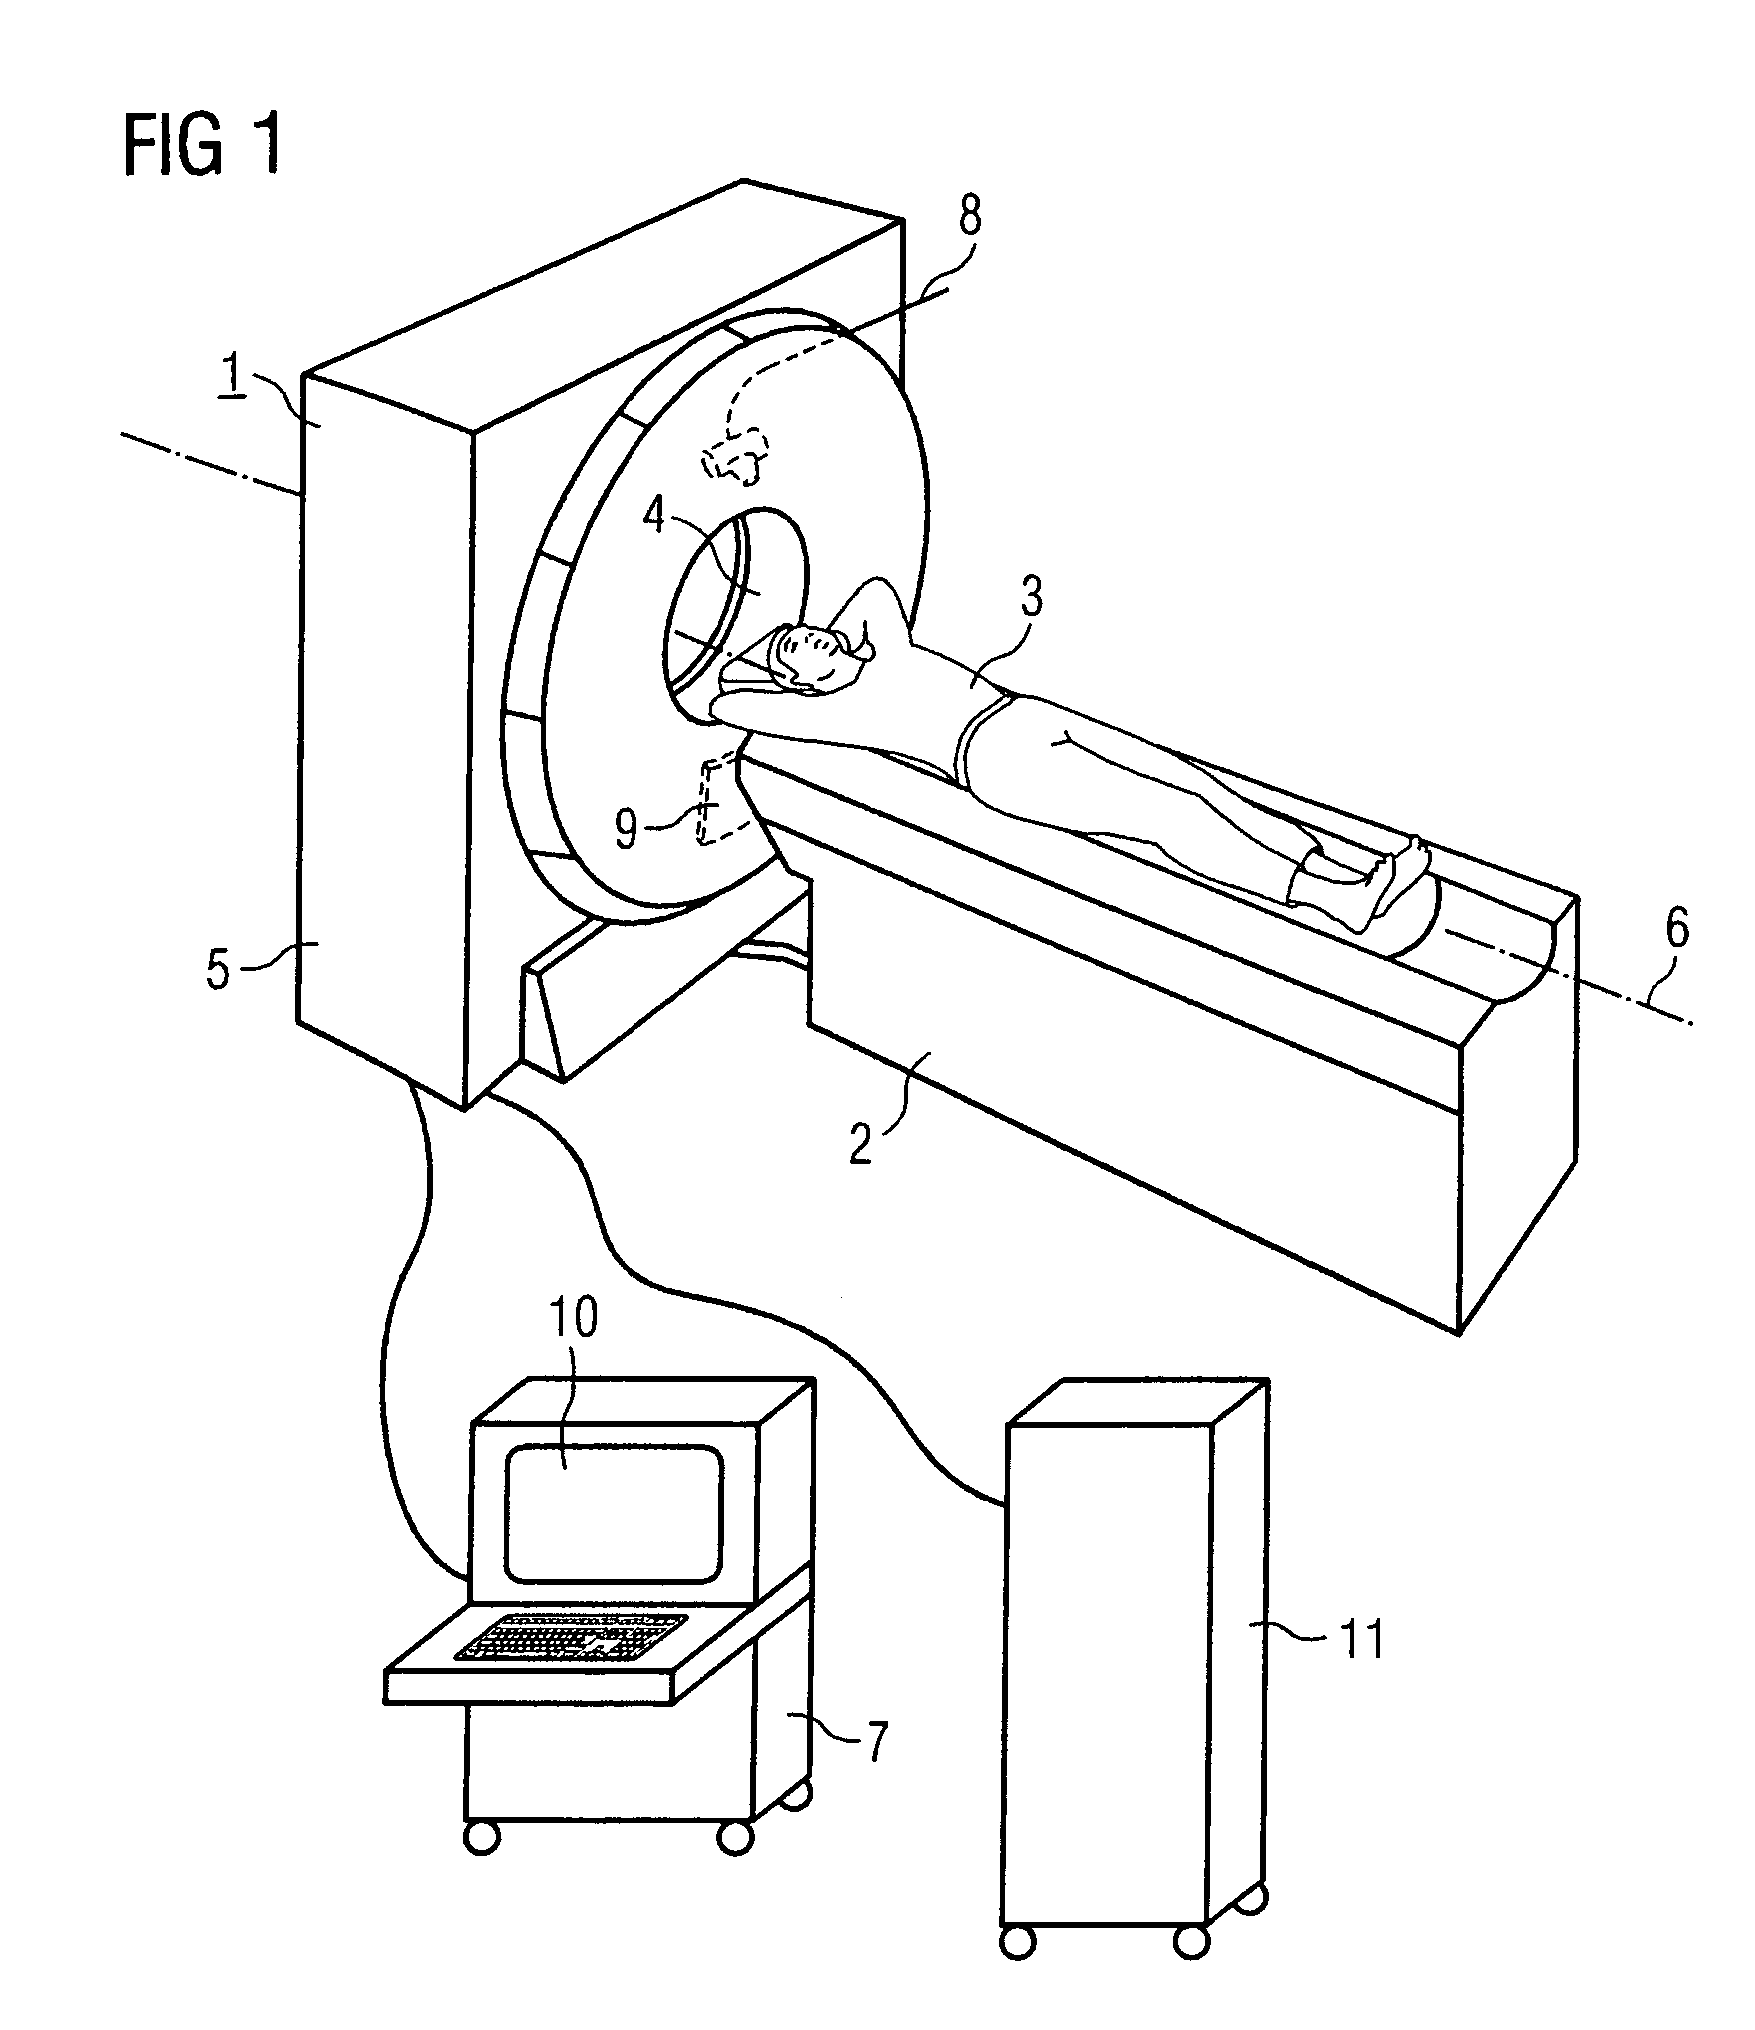
[0030]FIG. 1 shows an X-ray computed tomograph 1 having an associated supporting device 2 for holding and supporting a patient 3. A moving table top on the supporting device 2 can be used to insert the patient 3 with the desired region under examination into an opening 4 in the housing 5 of the CT appliance 1. In the case of a spiral scan, the supporting device 2 is also used to effect continuous axial feed. Inside the housing 5, a gantry (which cannot be seen in FIG. 1) can be rotated about an axis of rotation 6 running through the patient 3 at high speed. The figure also shows the recording system with the X-ray tube 8 and the X-ray detector 9.

[0031]For operation of the CT appliance 1 by a doctor or the like, a control unit 7 is provided which also includes a monitor 10 for showing the recorded images.

[0032]The projection data from the recording system, which scans continuously during a spiral scan, are processed further in a control and image computer 11 in line with the present ...


PUM

PropertyMeasurementUnit
degree of color saturationaaaaaaaaaa
material propertiesaaaaaaaaaa
density distributionaaaaaaaaaa

Abstract

A method is for visually displaying quantitative information in medical imaging data records, in which an image data record and / or one or more additional data records, in which each image element of the image data record has one or more associated values as quantitative information, are obtained from one or more measurement data records after one or more processing steps. The image data record and / or the one or more additional data records is / are used to calculate a significance function which, for each image element in a prescribable image region, represents a degree of similarity between the one or more values associated with the image element and a prescribable value or a prescribable value combination. Further, the significance function is graphically displayed on an image reproduction unit. The present method can be used for visually displaying quantitative information contained in medical imaging data records easily and clearly.

Description

[0001]The present application hereby claims priority under 35 U.S.C. §119 on German patent application numbers DE 10 2004 008 519.6 filed Feb. 20, 2004, the entire contents of which is hereby incorporated herein by reference.FIELD OF THE INVENTION[0002]The present invention generally relates to a method for visually displaying quantitative information in medical imaging data records. More particularly, it relates to a method for visually displaying quantitative information in CT data records; in which an image data record is obtained from one or more measurement data records after one or more processing steps.BACKGROUND OF THE INVENTION[0003]Medical imaging produces large volumes of data in data records which, following further processing, are displayed to the user as image information for a region under examination on the examined object. The data obtained using the imaging methods frequently also contain further information which may be of value to the user. This is explained in m...

Claims


Application Information

Patent Timeline
Patent Type & Authority Patents(United States)
IPC IPC(8): G06K9/00A61B6/03G01N23/04G06T7/00G06T7/40
CPCG06T7/0012G06T11/008G06T2207/30004
Inventor HEISMANN, BJOERN
Owner SIEMENS HEALTHCARE GMBH
Learn More