
Analysis of mixtures including proteins

a technology of protein and mixture, applied in the field of analysis and quality control of mixtures including proteins, can solve the problems of increasing the level of uncharacterized breakdown products, reducing the effective dose of immunogenic conjugates, etc., and achieves the improvement of the ability to detect trace components, improve the accuracy or measurement of analyte, and reduce background amplitude from sample to sample.

Inactive Publication Date: 2013-10-01
NOVARTIS AG
View PDF7 Cites 1 Cited by
  • Summary
  • Abstract
  • Description
  • Claims
  • Application Information

AI Technical Summary

Benefits of technology

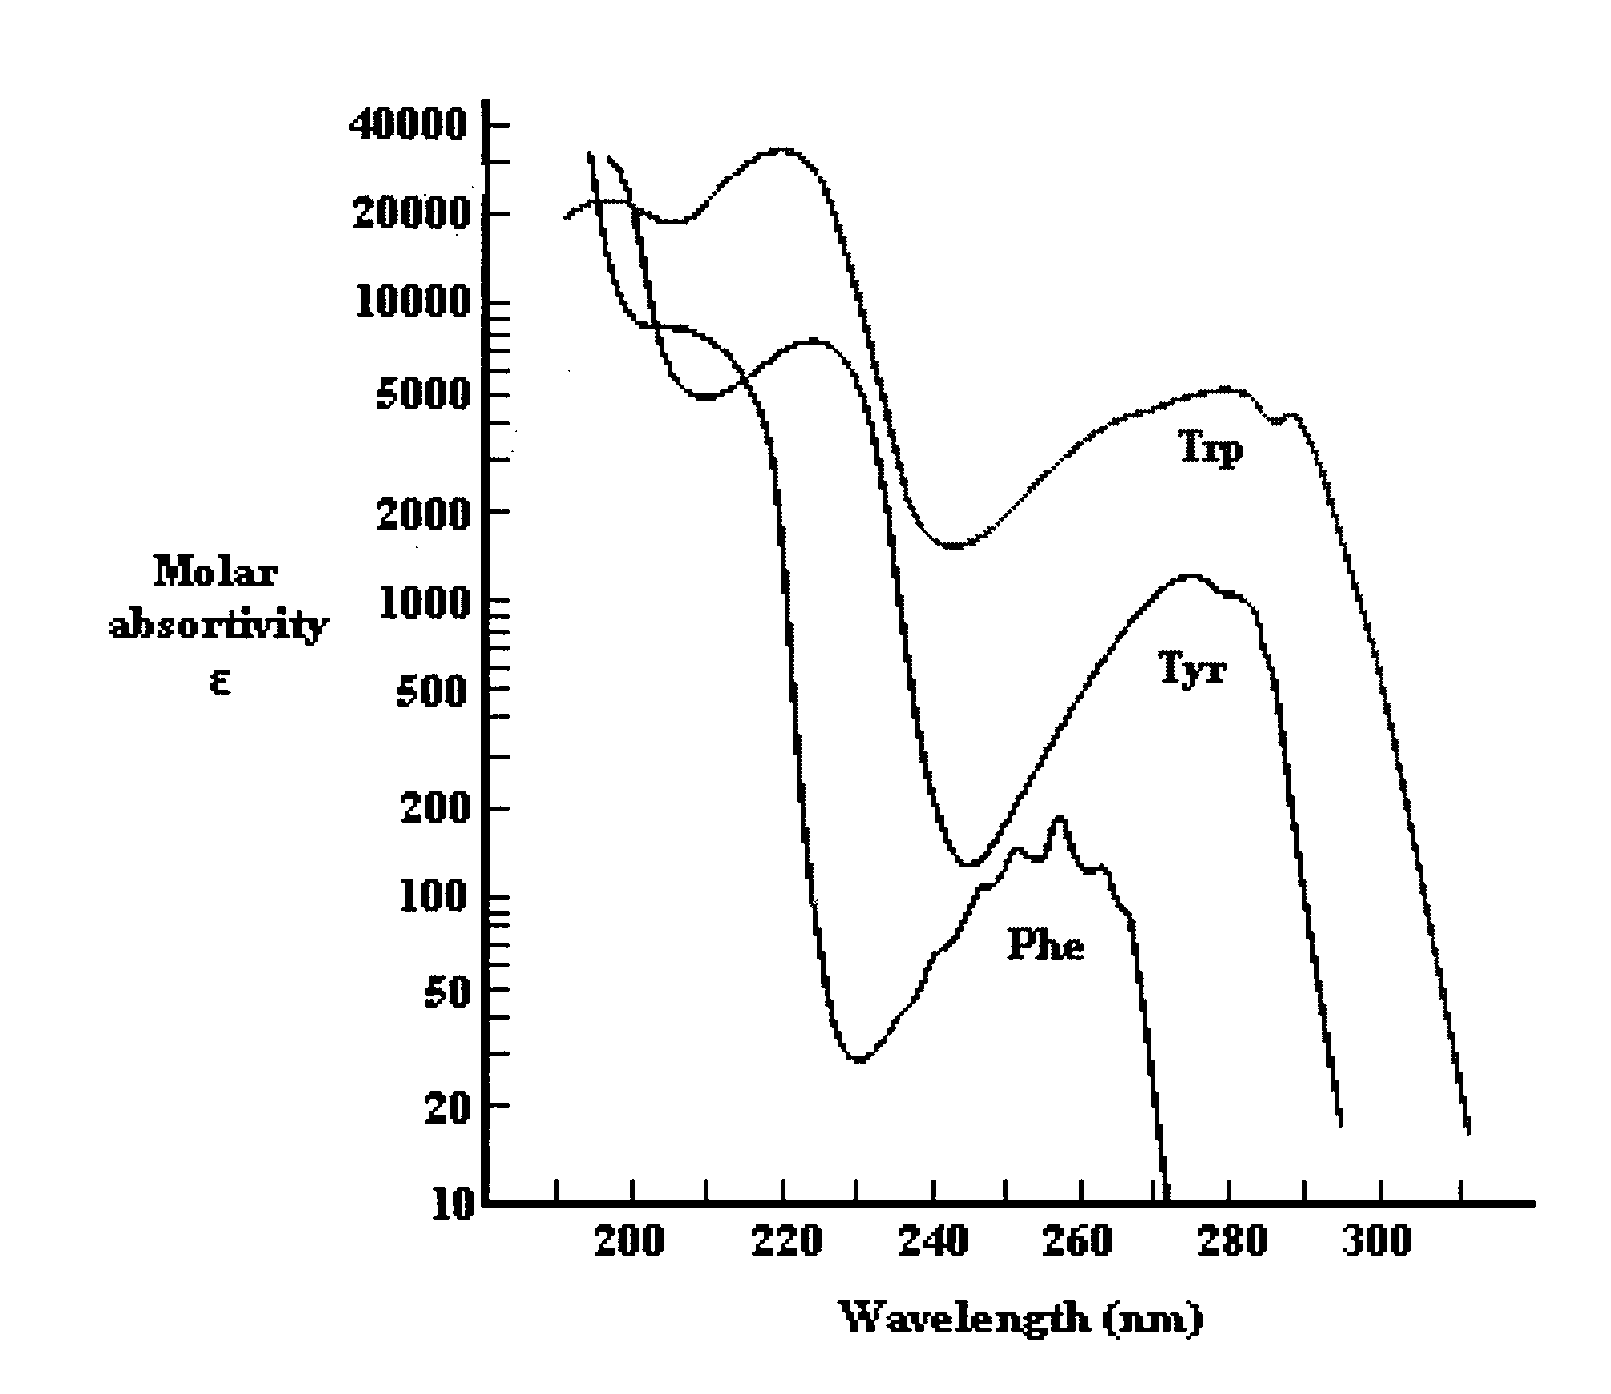
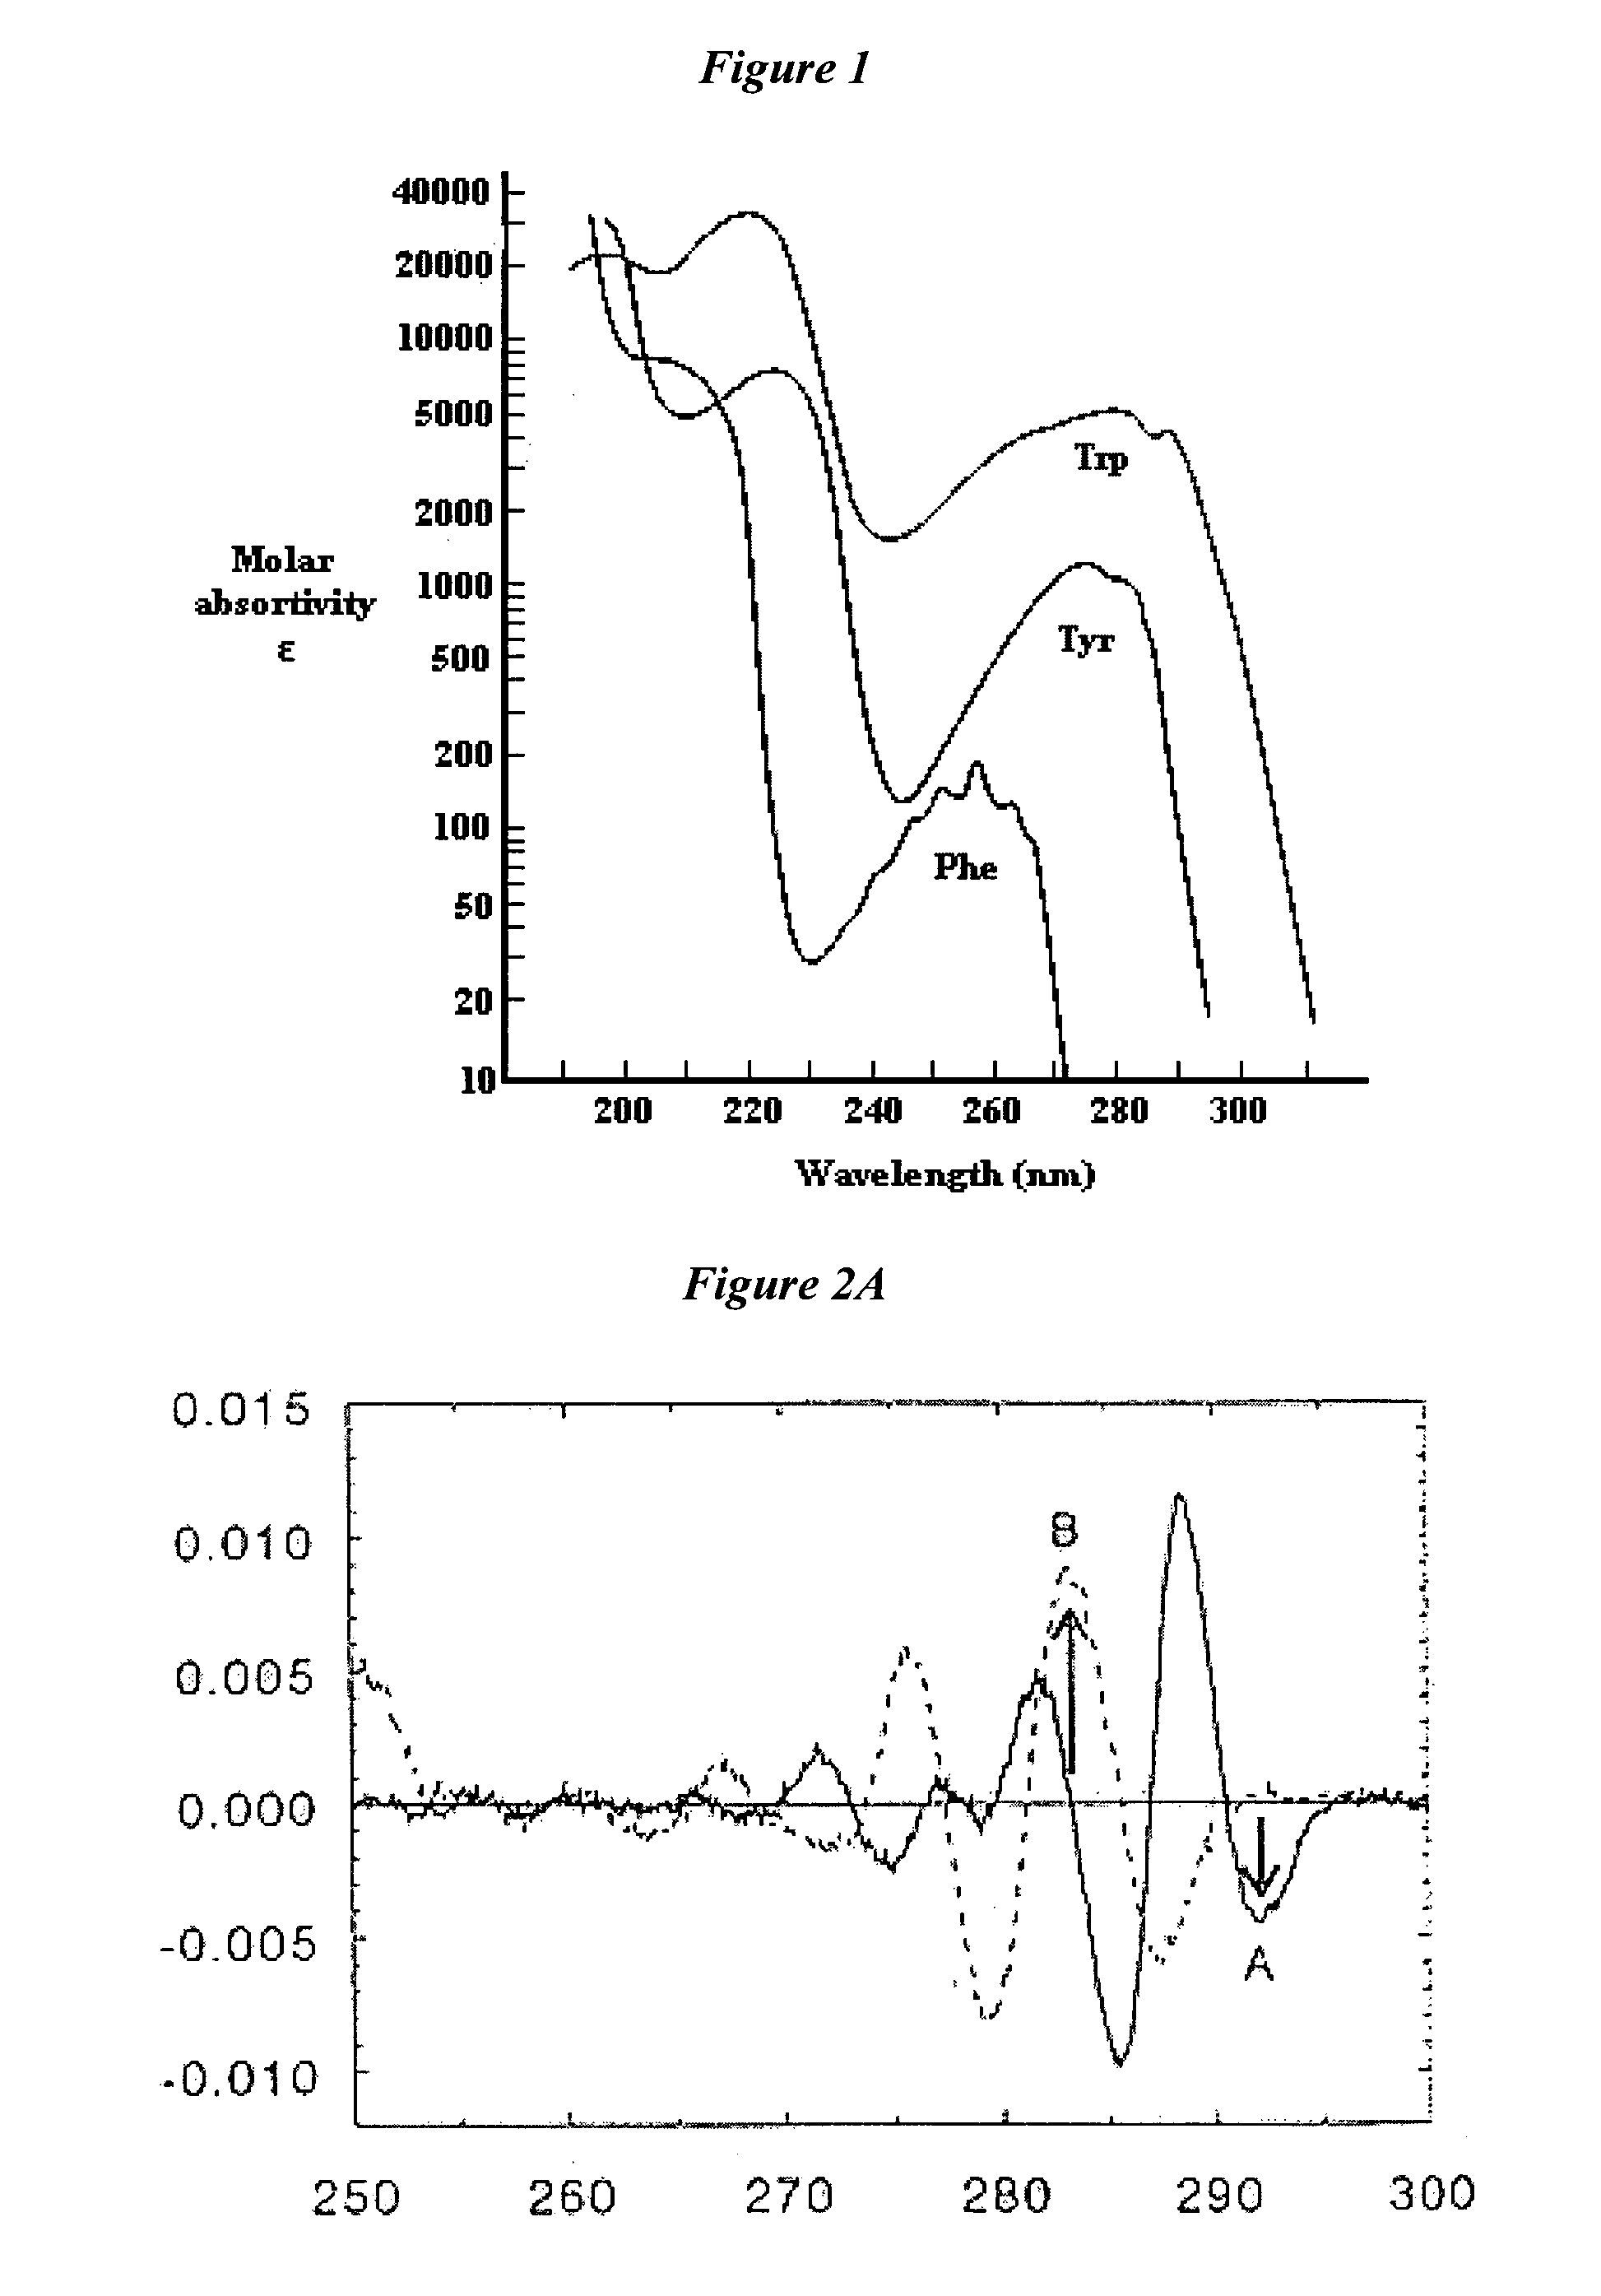
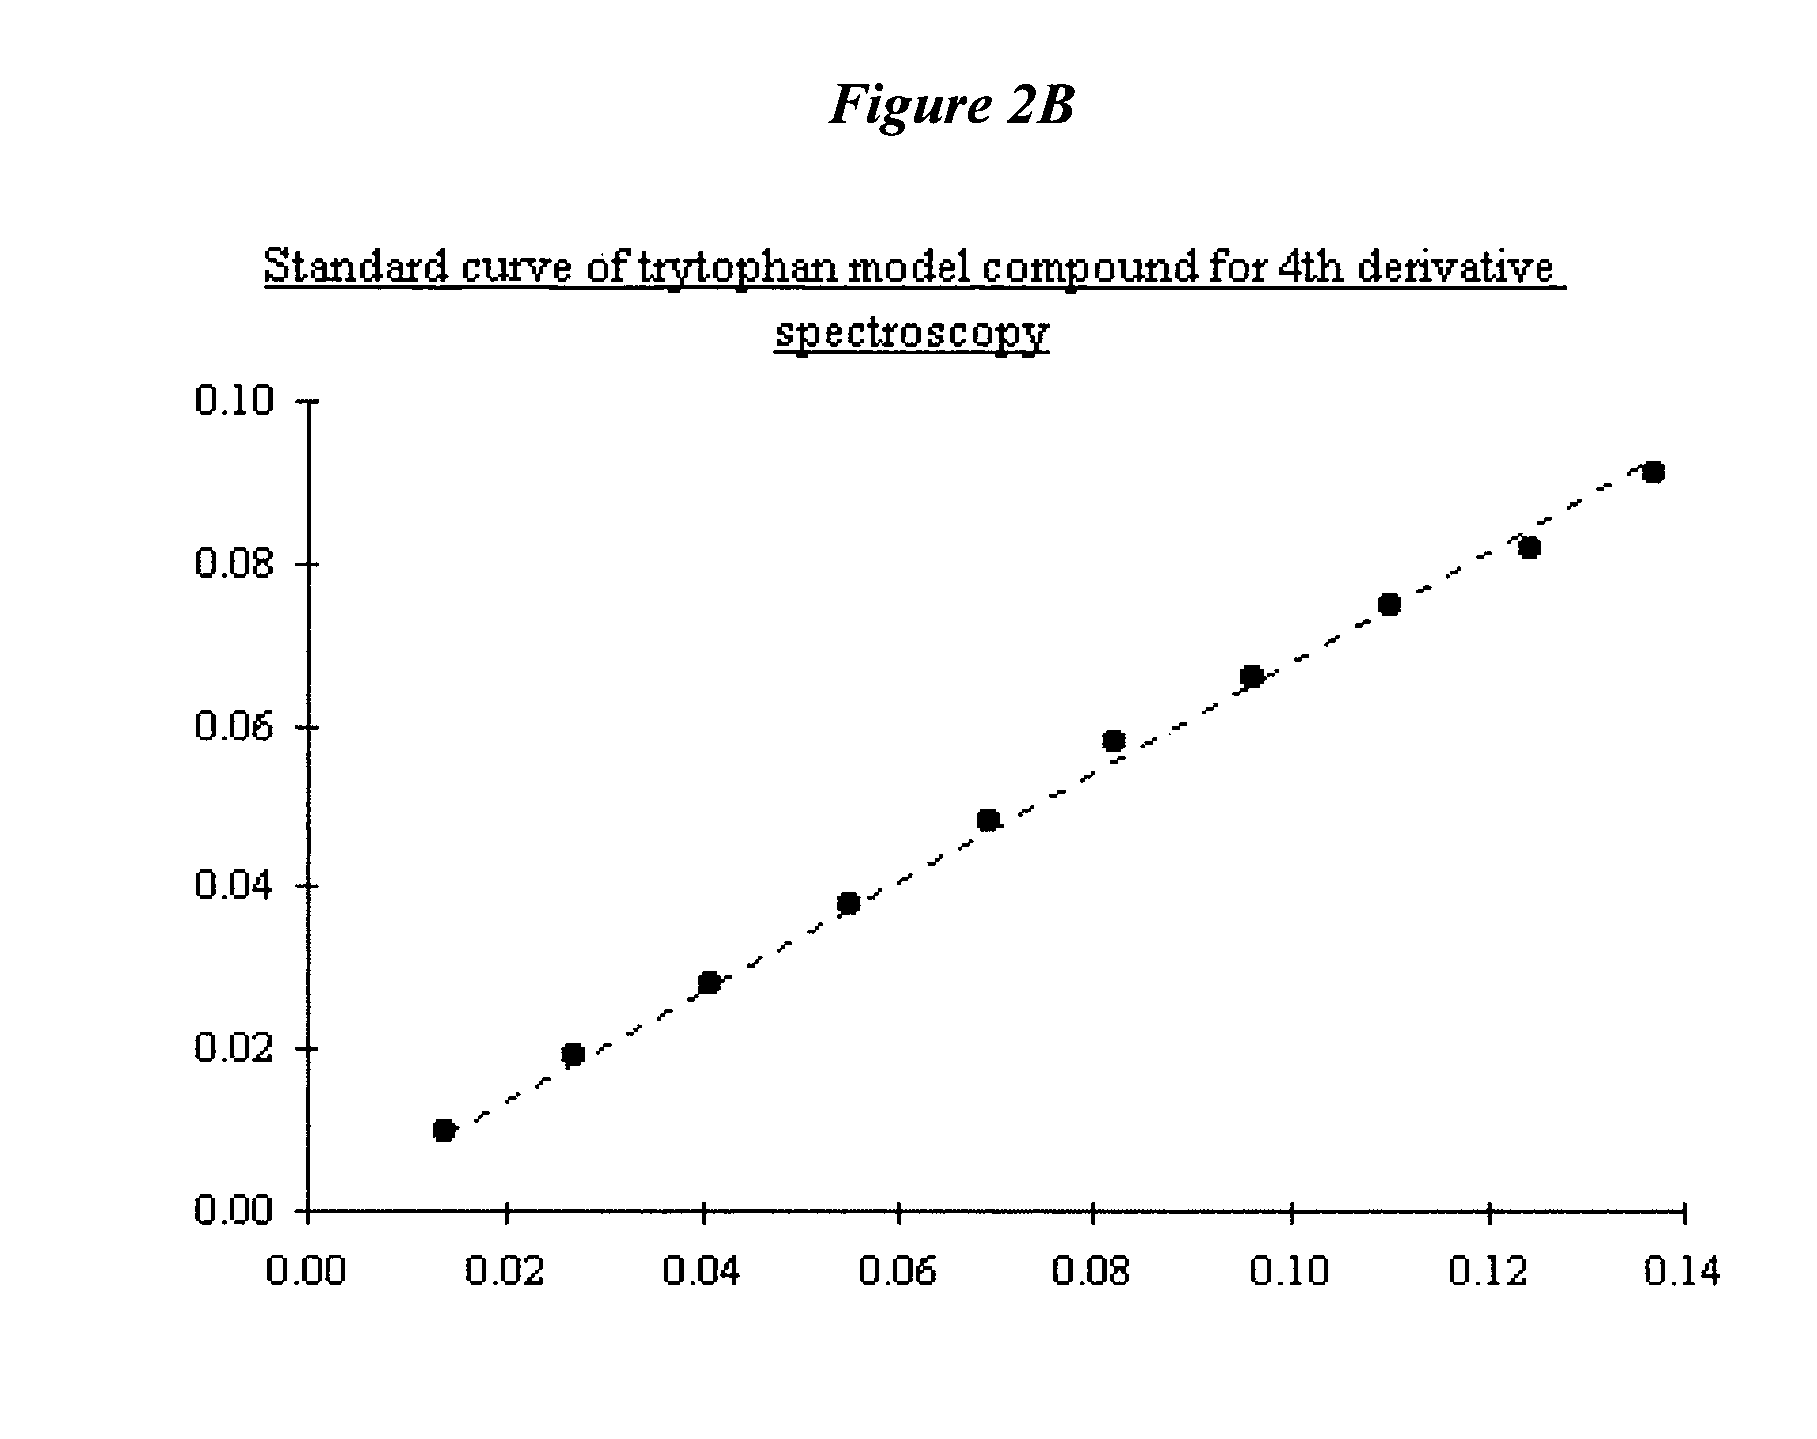
[0012]The inventors have discovered that information hidden in conventional (underivatized) UV absorption spectra and fluorescence spectra of proteins allows the analysis of small changes in the compositions of protein-containing mixtures (e.g. vaccines). The inventors employ a derivative analysis of the underivatized spectra which reveals secondary and tertiary structure of the protein analyte, and allows the separation and discrimination between the spectral contributions of different components (e.g. different amino acids). Because contamination of the mixture and denaturation / hydrolysis of the protein etc. have an impact on the secondary and tertiary structure of the protein (and therefore the spectral contributions of different amino acids), following changes in the spectra by this technique allows analysis of the stability and integrity of the protein and impurities in the protein-containing mixtures, e.g. vaccines. The inventors have found that this technique is reliable and repeatable, and provides results which cannot be obtained by classical spectral analysis (i.e. by comparison of underivatized spectra). The results can also be easily represented as a “finger-print” representation of the composition of the sample.
[0140]FIG. 12A shows a computer-generated peak with a Lorentzian shape (in red) superimposed on the negative of its second derivative (in green). The second derivative is amplified (by multiplying it by an adjustable constant) so that the negative sides of the inverted second derivative (from approximately X=0 to 100 and from X=150 to 250) are a mirror image of the sides of the original peak over those regions. In this way, when the original peak is added to the inverted second derivative, the two signals will approximately cancel out in the two side regions but will reinforce each other in the central region (from X=100 to 150). The result, shown in FIG. 12B, is a substantial (about 50%) reduction in the width, and an increase in height, of the peak so that the intensities and positions can be more easily measured. The algorithm works best with Lorentzian-shaped peaks; while with Gaussian-shaped peaks the resolution enhancement is still useful but less extensive (only about 20% reduction in the width). A property of this procedure is that it does not change the total peak area (that is, the area under the peak) because the total area under the curve of the derivative of a peak-shaped signal is zero (the area under the negatives lobes cancels the area under the positive lobes).General

Problems solved by technology

Problems when dealing with conjugate vaccines include stability, batch-to-batch consistency and contamination.
Instability of conjugates undesirably leads to a reduction in effective dose of immunogenic conjugate over time, variation between batches, and increased levels of uncharacterized breakdown products.

Method used


Image

  • Analysis of mixtures including proteins
  • Analysis of mixtures including proteins
  • Analysis of mixtures including proteins

Examples


4 example 10c

[0224]FIG. 89 shows a far UV CD spectra of NadAΔ351-405

[0225]FIG. 89A shows the spectra of clinical phase II and III NadAΔ351-405, superimposed to the spectra of a thermally denatured sample. Analyses were carried out between 260-180 nm at RT, approximately 0.1 mg / ml protein solution, with 1 mm optical path length, band-width of 1 nm, and buffer subtraction.

[0226]FIG. 89B shows a far UV CD data comparison for different clinical phase lots.

[0227]FIG. 89C shows CD spectra deconvolution by Yang algorithm; the fractional percentage of the secondary structure had been calculated by computer fitting to a library of known CD protein spectra.

5 example 10d

[0228]FIG. 90 shows a fluorescence emission spectra of NadAΔ351-405. Normalized emission spectra are shown for native NadAΔ351-405, thermally denatured protein and L-tyrosine in solution. Spectra were recorded at RT, in 1 cm path length quartz cell on solution containing approximately 0.4 mg / ml; excitation wavelength 280 nm. Emission spectra were registered between 290 and 390 nm; each spectrum was averaged on 3 different scanning at 50 nm / min speed.

6 Example 10E

[0229]FIG. 91 shows a SEC-HPLC profile of NadAΔ351-405 Dimensional separation was performed on a TSK G3000SW×1 column; the large majority of NadAΔ351-405 material eluted as a single tailed peak, accompanied by a minor peak at lower retention time. Peak homogeneity is assessed by spectral comparison of all the spectra slices within the single peak. Spectra constituting the NadAΔ351-405 major peak present a maximum absorption at 275.9 nm and are perfectly superimposed, including the ones of the peak shoulder area, indicating t...

example 1

Spectroscopic Analysis of CRM197 Lots

Samples

[0247]Table 1 lists the CRM197 lots analyzed and the dilution rate applied in the experiments.

[0248]

TABLE 1Protein conc.Sample targetFinal sampleProtein inCRMsample to obtainNearest CRMReal sample% of differenceCRM bulkvia microBCAconcentrationvolumefinal volumefinal volume at tagetsampleableconcentrationfrom targetlot. N.(mcg / mcl)(mcg / mcl)(mcl)(mcg)concentration (mcl)volume (mcl)(mcg / mcl)conc.3947.400.5100050010.5485232110.540.499596−0.08084151.700.510005009.6711798849.680.5004560.09124256.100.510005008.9126559718.920.5004120.08244454.900.510005009.1074681249.100.49959−0.0824648.000.5100050010.4166666710.420.500160.032TRUN0543.600.5100050011.4678899111.460.499656−0.0688TRUN0638.200.5100050013.0890052413.080.499656−0.0688TRUN0746.300.5100050010.7991360710.800.500040.0085CRF1543.850.5100050011.4025085511.400.49989−0.022

[0249]The lots were produced on three different manufacturing sites. Lots 39, 41, 42, 44 and 46 were produced on Site 1; lo...


PUM

PropertyMeasurementUnit
wavelengthaaaaaaaaaa
band-widthaaaaaaaaaa

Abstract

The quality control of vaccines is an important step in the release of vaccines to patients. Problems when dealing with vaccines include stability, batch-to-batch consistency and contamination. The invention provides a method of analyzing the composition of a protein-containing sample by electromagnetic spectroscopy, and derivatizing the obtained spectrum to obtain a derivative spectrum of the sample. The derivative spectrum may optionally be compared to a reference spectrum, to assess stability, contamination etc. relative to the reference. The derivative analysis technique allows the separation and discrimination between the spectral contributions of different components, thereby allowing differences in the spectra to be assigned to particular groups of the protein, or particular contaminants etc.

Description

[0001]All documents cited herein are incorporated by reference in their entirety.RELATED APPLICATIONS[0002]This application is the U.S. National Phase of International Application No. PCT / IB2008 / 003678, filed Dec. 9, 2008 and published in English, which claims priority to Great Britain Application No. 0724103.7, filed Dec. 10, 2007 and Great Britain Application No. 0813345.6, filed Jul. 21, 2008. The teachings of the above applications are incorporated herein in their entirety by reference.TECHNICAL FIELD[0003]This invention concerns the analysis and quality control of mixtures including proteins, e.g. vaccines. In particular, the invention concerns the analysis and quality control of glycoconjugate vaccines and other protein antigen-containing vaccines.BACKGROUND ART[0004]Immunogens comprising capsular saccharide antigens conjugated to carrier proteins are well known in the art. Conjugation converts T-independent antigens into T-dependent antigens, thereby enhancing memory response...

Claims


Application Information

Patent Timeline
Patent Type & Authority Patents(United States)
IPC IPC(8): G01N21/00
CPCA61K39/095G01J3/433G01N21/33G01N21/6486A61K2039/6037G01J3/4406
Inventor D'ASCENZI, SANDRODE CONCILIIS, GIUSEPPEMAGAGNOLI, CLAUDIAMATTIOLI, GIOVANNI LUIGI
Owner NOVARTIS AG
Learn More