Financial analysis system interface

a technology of financial analysis and interface, applied in the field of financial analysis systems, can solve the problems of slow access to data or presentations, time-consuming process, and the use of this approach in the entire portfolio of instruments, and achieve the effects of convenient retrieval and display of data, rapid interchange, and wide variety of data types

Inactive Publication Date: 2010-06-29
SMITH JAMES KEMP
View PDF26 Cites 20 Cited by
  • Summary
  • Abstract
  • Description
  • Claims
  • Application Information

AI Technical Summary

Benefits of technology

[0013]Still a further object of the invention is to provide an improved interface that facilitates retrieval and display of data in financial analysis systems.
[0014]Another object of the invention is to provide an improved interface for financial analysis systems that significantly expands the variety of types of data that may quickly be accessed from differing presentation views within the system.
[0015]Yet a further object of the invention is to enable rapid interchange between differing forms of data presentation in financial analysis systems.

Problems solved by technology

This form of selection is nearly universal, but slows access to data or presentations when the user desires to switch data sources or views.
Some systems allows limited rapid switching between selected elements by clicking a mouse, but none is known which employs this approach with entire portfolios of instruments.
When Charts Views of several stocks are desired, this process becomes time-consuming, especially when the user may wish to switch back and forth between numeric and Charts Views.

Method used


Image

  • Financial analysis system interface
  • Financial analysis system interface
  • Financial analysis system interface

Examples


Embodiment Construction

[0016]The foregoing and other and further objects and features of the invention will be more readily understood on reference to the following detailed description of the invention, when taken in conjunction with the accompanying drawings, in which:

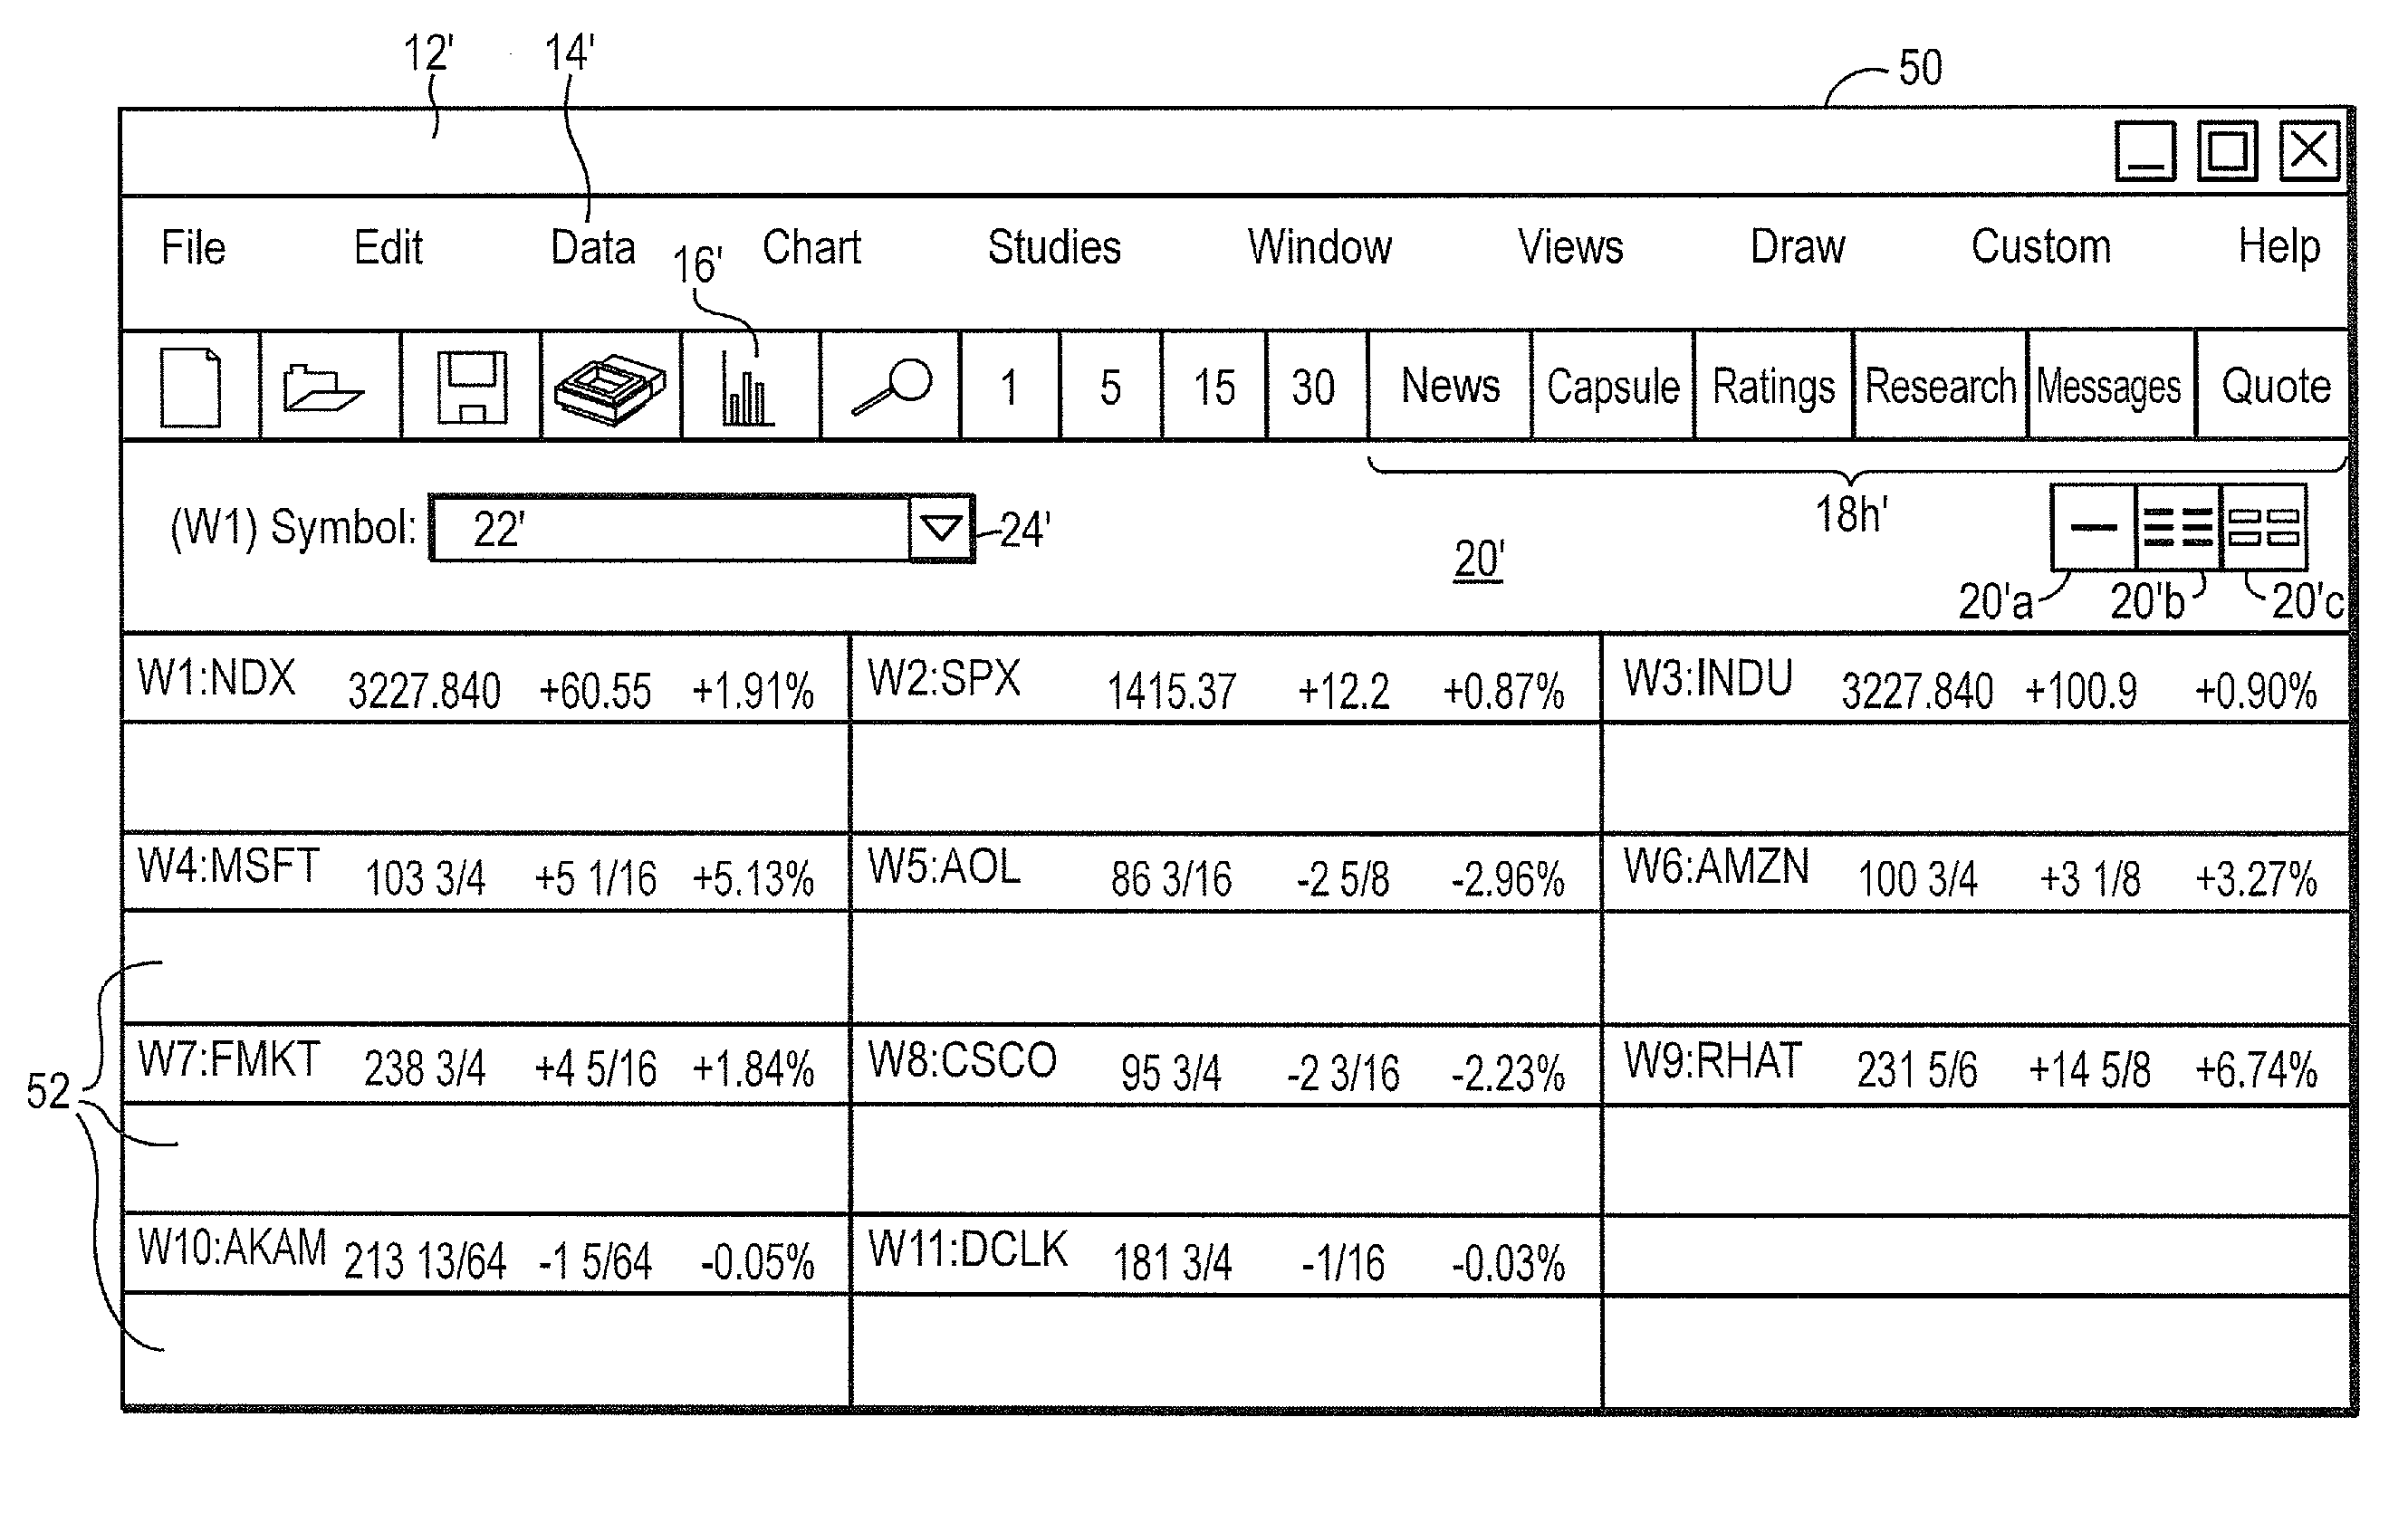
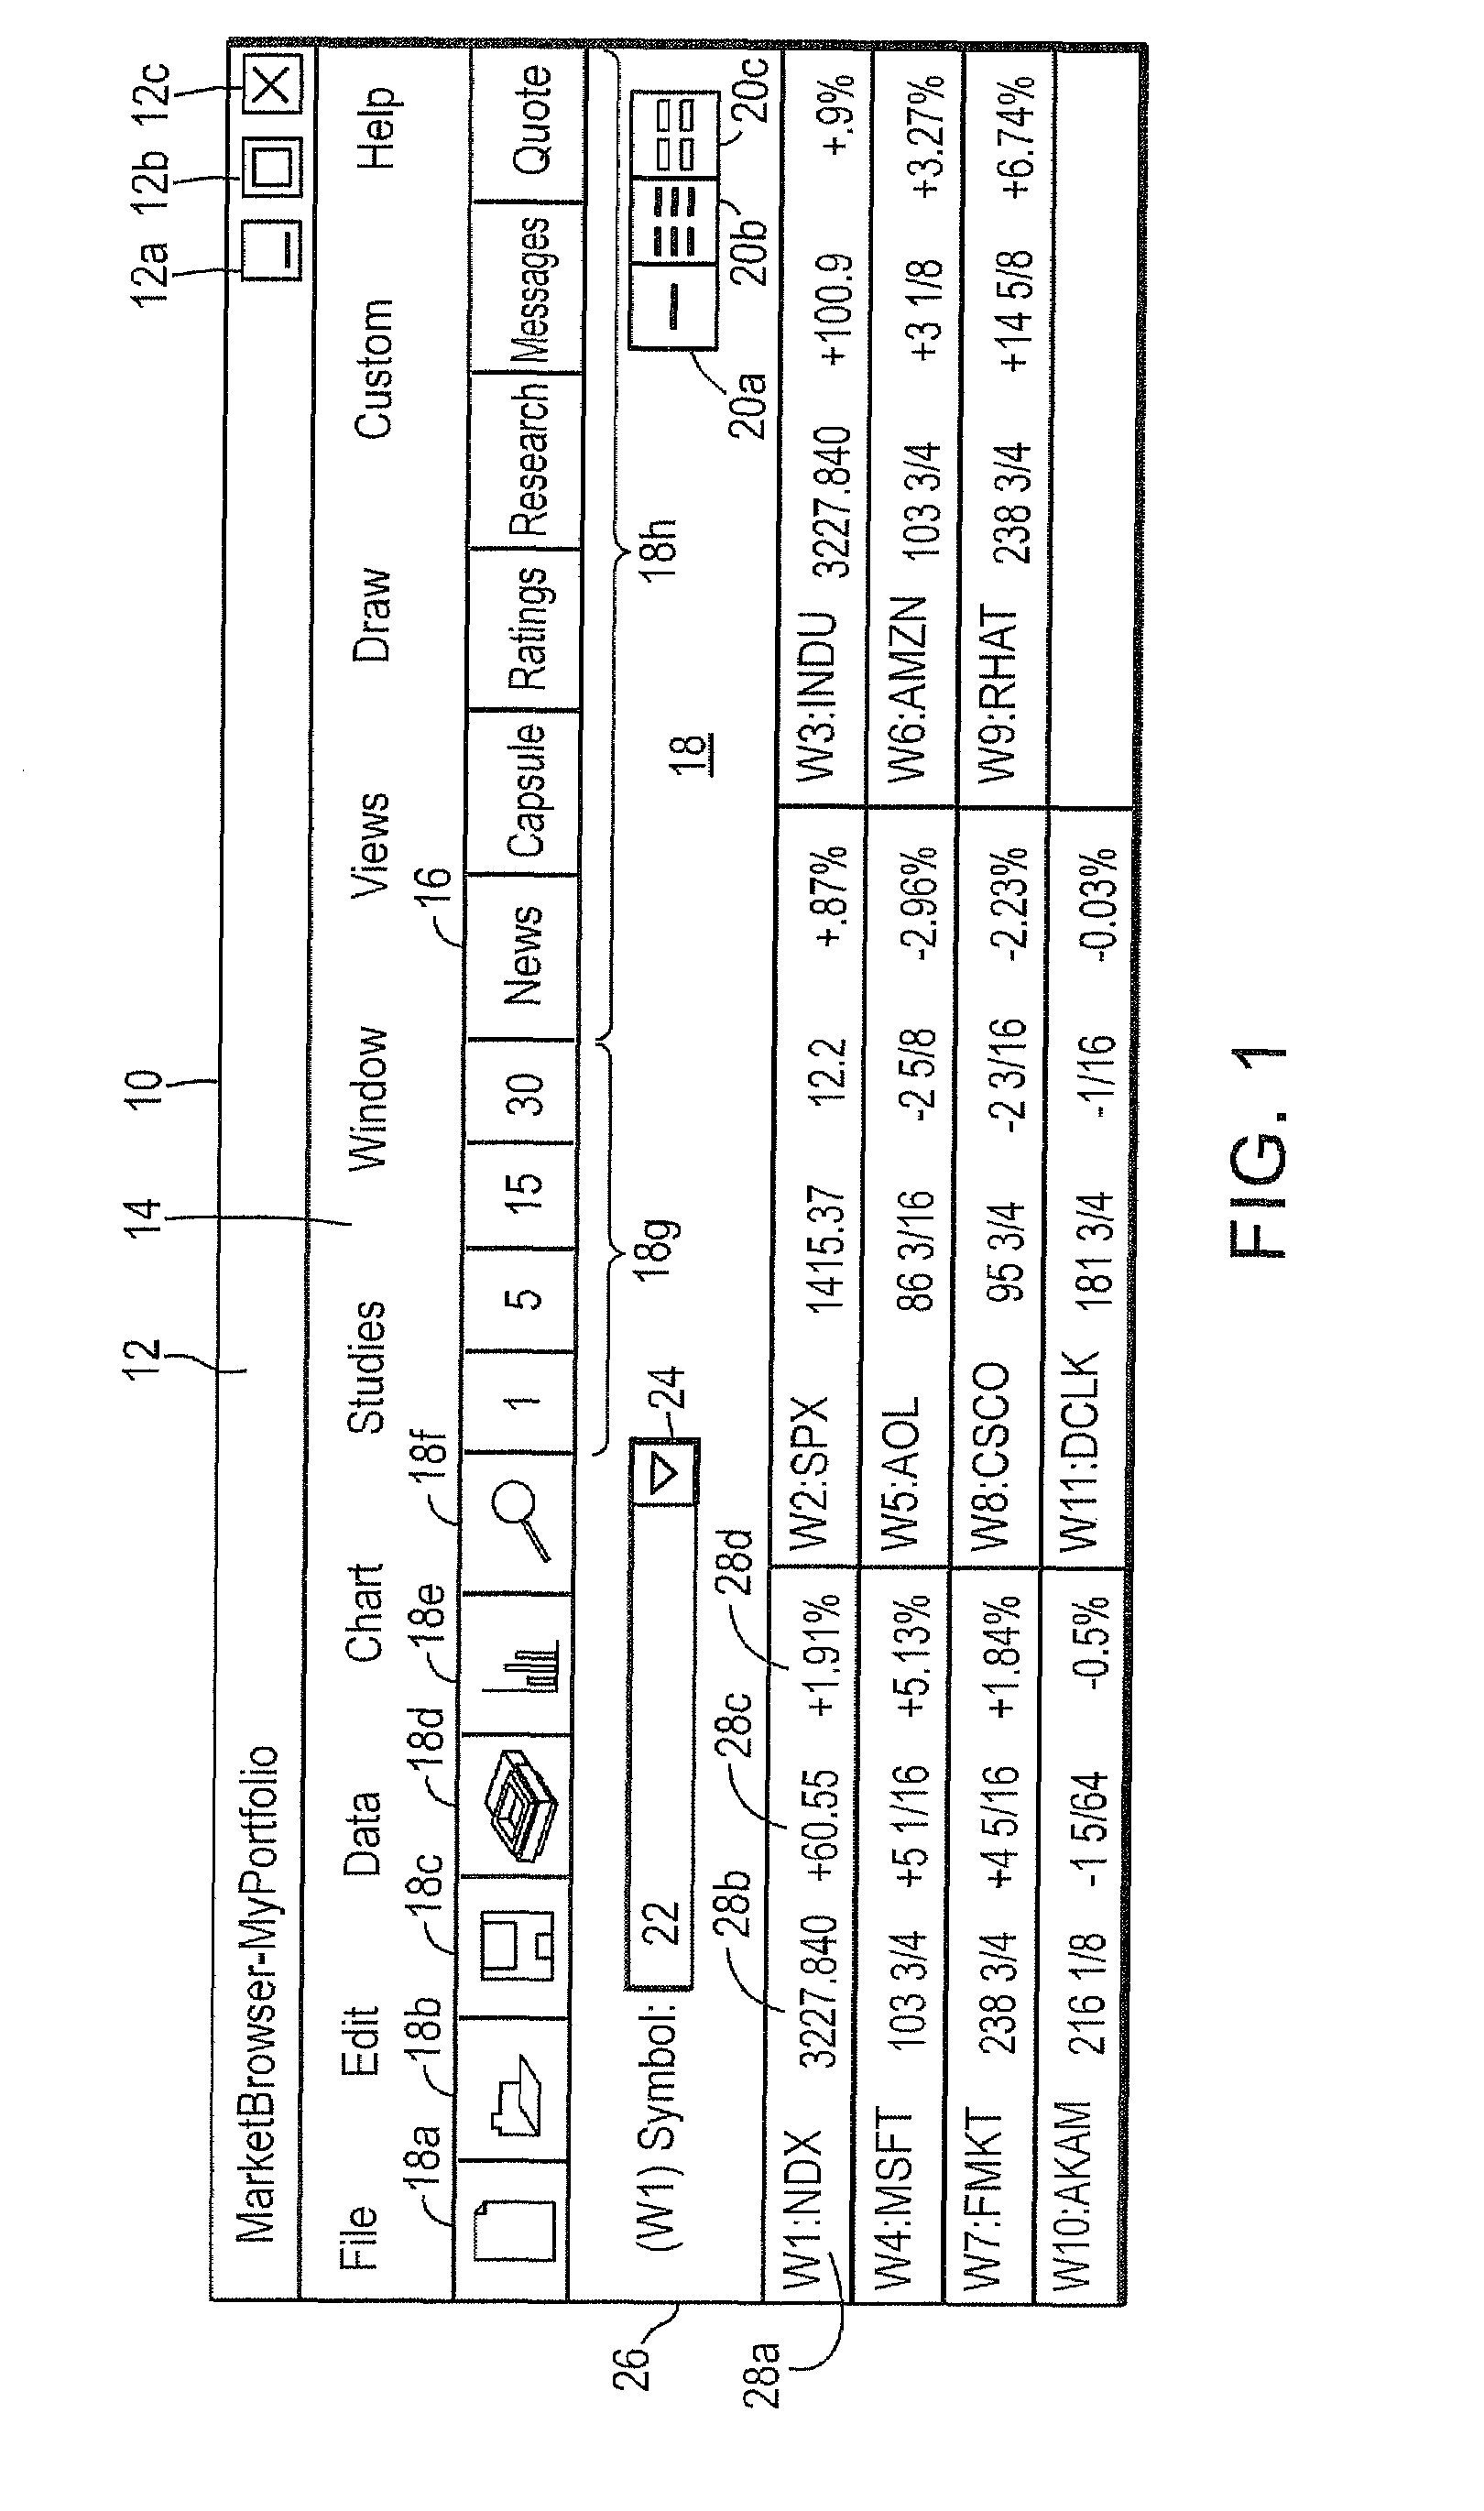
[0017]FIG. 1 is a display comprising an interface in the form of a Monitors View panel in accordance with the present invention;

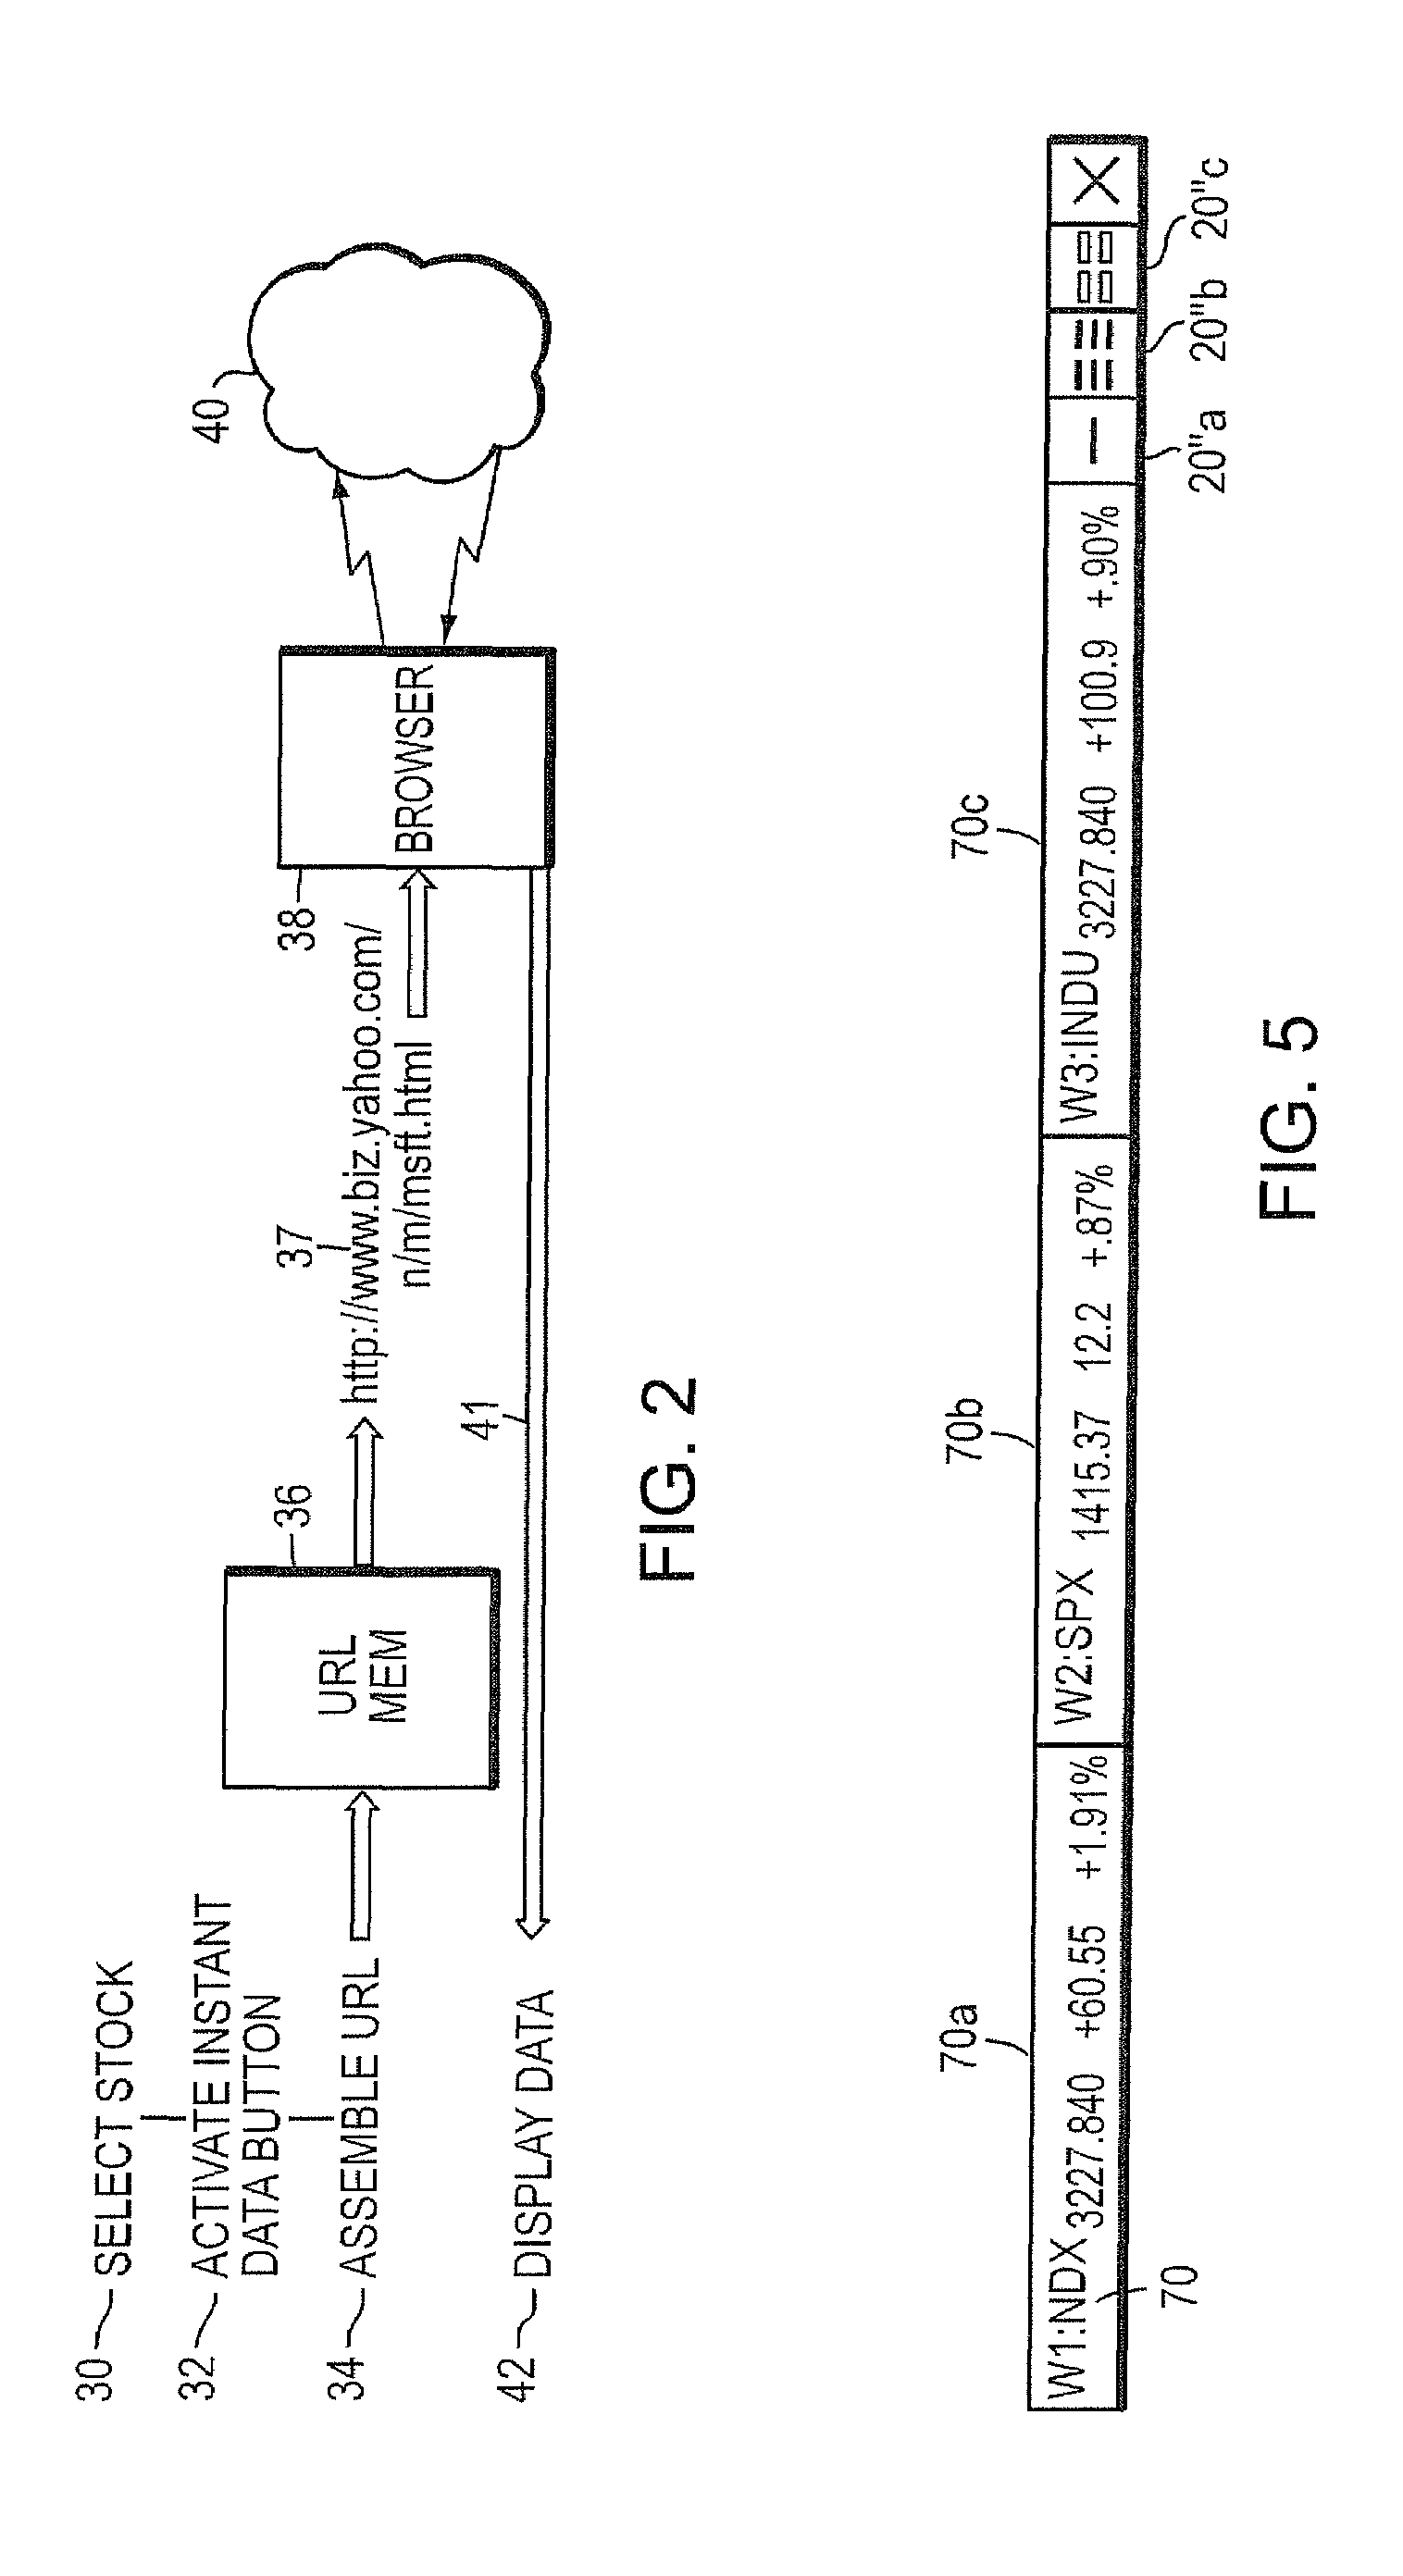
[0018]FIG. 2 is a schematic illustration of facilities for rapid information retrieval from the interface of FIGS. 1 and 3;

[0019]FIG. 2A is an illustration of assignment of data preferences in accordance with the invention;

[0020]FIG. 3 is a display comprising an interface in the form of a Charts View panel in accordance with the present invention;

[0021]FIG. 4 is an expanded view of a chart selected from FIG. 2; and

[0022]FIG. 5 is display comprising an interface in the form of a Market Bar panel in a accordance with the invention;

[0023]The present invention is intended for use a part of a financial analysis system ...


PUM


Abstract

A user interface provides a financial analysis system for real time monitoring of market conditions for a portfolio of stocks or other financial instruments. The interface presents three unique panels, which, upon selection by the user, provide different representations of data with respect to the portfolio or a selected portion of the portfolio. The user can rapidly cycle among these panels by activating icons. Further, the user can quickly retrieve additional data for a given stock from any of a variety of user-selectable sources by activating additional icons.

Description

BACKGROUND OF THE INVENTION[0001]The invention relates to financial analysis systems and, more particularly, to financial analysis systems which receive data in real time from external sources and which manipulate and display that data in a variety of forms. As used herein, the term “real time” should be understood to include contemporaneous data, as well as data which may in fact be delayed for relatively brief intervals, e.g., on the order of twenty minutes or so. The invention is particularly applicable to the receipt, processing and display in real time of market information with respect to a portfolio of financial instruments such as stocks, bonds, mutual funds, etc. For ease of explanation, the invention will be described with specific reference to stocks, but should be understood as being applicable to financial instruments in general.[0002]An example of a financial analysis system that has found wide application by professional traders for portfolio and risk tracking analysi...

Claims


Application Information

Patent Timeline
Patent Type & Authority Patents(United States)
IPC IPC(8): G06Q40/00G06F17/00
CPCG06Q40/00G06Q40/10G06Q40/06G06Q40/04G06Q40/12
Inventor SMITH, JAMES KEMP
Owner SMITH JAMES KEMP
Why Eureka
Try Eureka