
Methods for practical worst test definition and debug during block based statistical static timing analysis

a statistical static timing analysis and worst test technology, applied in the field of integrated circuit design, can solve problems such as multiple slacks at these nodes, failure in one or more other performance-limiting corners, and over-pessimistic and misleading optimization tools

Active Publication Date: 2011-01-18
SIEMENS PROD LIFECYCLE MANAGEMENT SOFTWARE INC
View PDF13 Cites 9 Cited by
  • Summary
  • Abstract
  • Description
  • Claims
  • Application Information

AI Technical Summary

Benefits of technology

This approach enhances the accuracy of timing analysis and debugging by clearly identifying timing constraint violations and optimizing the design process, reducing computational overhead and improving the ability to trace and resolve issues within the integrated circuit.

Problems solved by technology

Even then, the results may be overly pessimistic and misleading for optimization tools.
A test run that passes in a single process corner under a DSTA run may actually fail in one or more other performance-limiting corners in the process space, which SSTA would reveal.
There frequently are multiple slacks incident at these nodes, due to both the backward propagated RAT data from upstream nodes, and also due to any timing tests that may be present on those nodes (e.g. setup or hold tests).
Therefore, failing results in a timing report cannot be easily correlated with the actual failing test that produced the fail, which increases the difficulty to trace failing tests as required to resolve timing issues.
Moreover, in block-based SSTA reporting of the slack distribution, an edge slack for a propagated distribution can be worse than the slacks of the nodes connected by the edge because of the statistical maximum and minimum operations performed on the propagated distributions.
Problems arise because the timing correctness of a circuit design is often determined by ensuring that all edge slacks are non-negative or, more generally, are greater than some user-specified threshold.
Because slacks of the nodes connected by an edge may be higher than the slack of the edge, this leads to a situation in which a timing constraint violation is reported on an edge.
Therefore, designers and optimization tools may be confused or mislead because of the slacks of the edges are not considered.

Method used


Image

  • Methods for practical worst test definition and debug during block based statistical static timing analysis
  • Methods for practical worst test definition and debug during block based statistical static timing analysis

Examples


Embodiment Construction

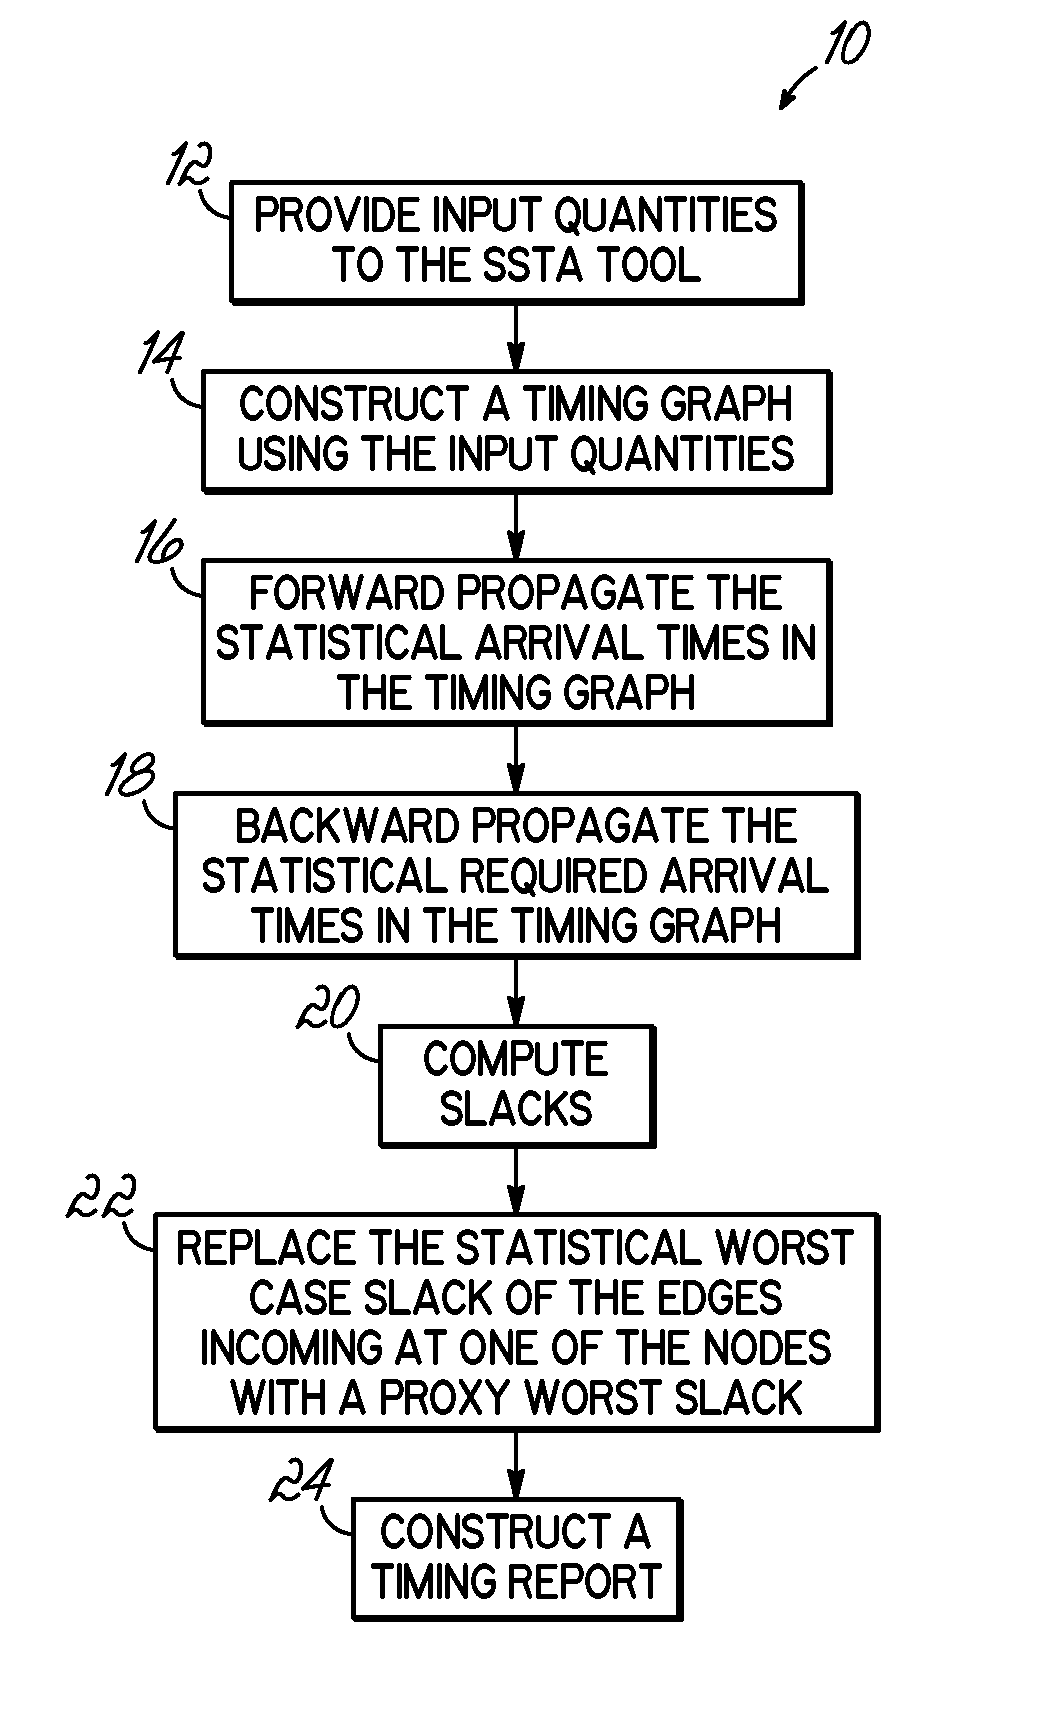
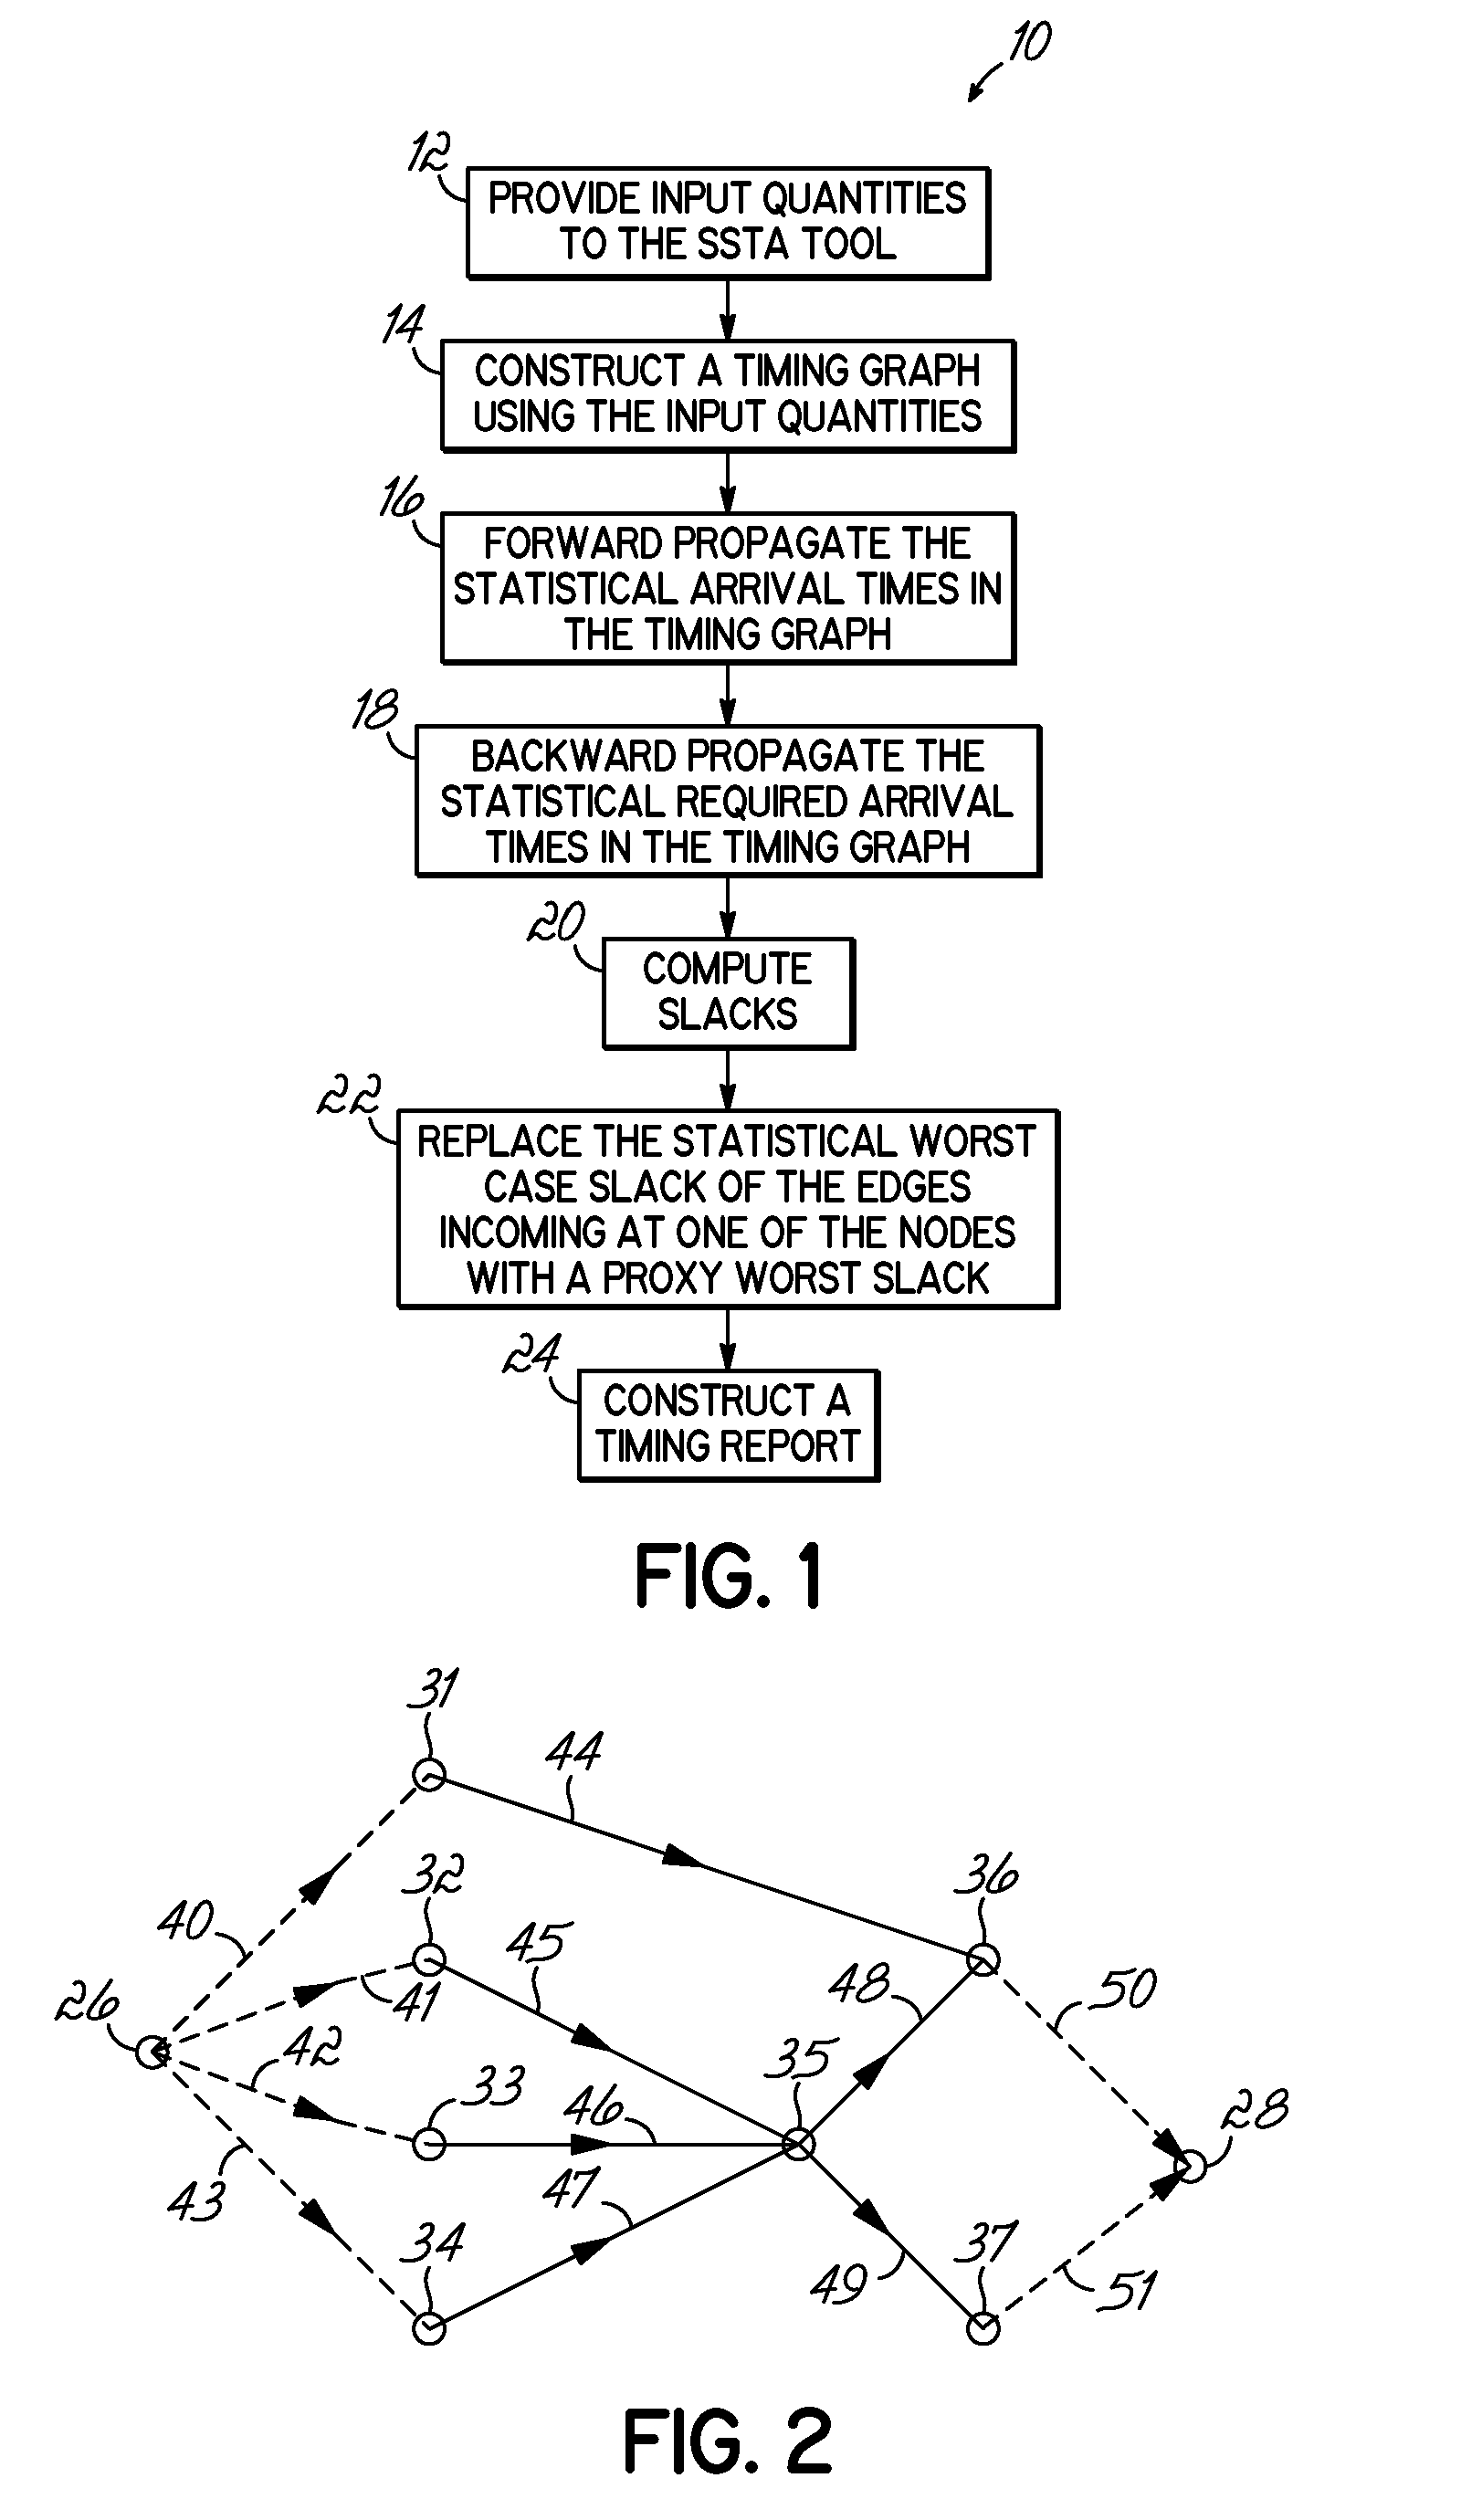
[0014]With reference to FIG. 1, a process flow 10 for a statistical static timing analysis (SSTA) tool is shown. The SSTA tool utilizes a block-based approach that propagates one probability distribution from each node to the next node and, so on until it reaches a sink node using a statistical maximum operation for early mode arrival times (setup timing constraint) or a statistical minimum operation for late mode arrival times (hold timing constraint).

[0015]In block 12, inputs are supplied to the SSTA tool. Specifically, the SSTA tool reads and flattens a netlist representing the structure of the circuit to be analyzed, a set of timing assertions, a set of canonical delay models governing the sources of variation in the space of process variations, sensitivities relating the delay attributable to each individual parameter, and statistical information describing the sources of variation. The timing assertions, each of which can be either deterministic or probabilistic, may include a...


PUM


Abstract

Methods for analyzing timing of an integrated circuit using block-based static statistical timing analysis and for practical worst test definition and debug. The method includes building a timing graph, determining a slack for each of the nodes in the timing graph, and identifying a statistically worst slack for at least one of the nodes. The method further includes replacing this statistically worst slack with a proxy worst slack.

Description

FIELD OF THE INVENTION[0001]The invention relates generally to integrated circuit design and, in particular, to statistical static timing analysis for analyzing the timing characteristics of an integrated circuit, before physically fabricating the integrated circuit, by propagating arrival and required arrival times of an integrated circuit in a probabilistic or statistical fashion.BACKGROUND OF THE INVENTION[0002]Static timing analysis (STA) is a common method of computing the expected timing of a digital circuit to identify problem areas of an integrated circuit during the design phase and in advance of actual fabrication. The timing of the integrated circuit is simulated to determine if it meets the timing constraints and, therefore, is likely to operate properly if fabricated in accordance with the tested design.[0003]Deterministic STA (DSTA) propagates timing quantities, such as arrival times, required arrival times, and slews, along with any other timing related quantities (gu...

Claims


Application Information

Patent Timeline
Patent Type & Authority Patents(United States)
IPC IPC(8): G06F17/50G06F9/45
CPCG06F17/5031G06F30/3312
Inventor BUCK, NATHAN C.FOREMAN, ERIC A.GREGERSON, JAMES C.HEMMETT, JEFFREY G.
Owner SIEMENS PROD LIFECYCLE MANAGEMENT SOFTWARE INC
Learn More