

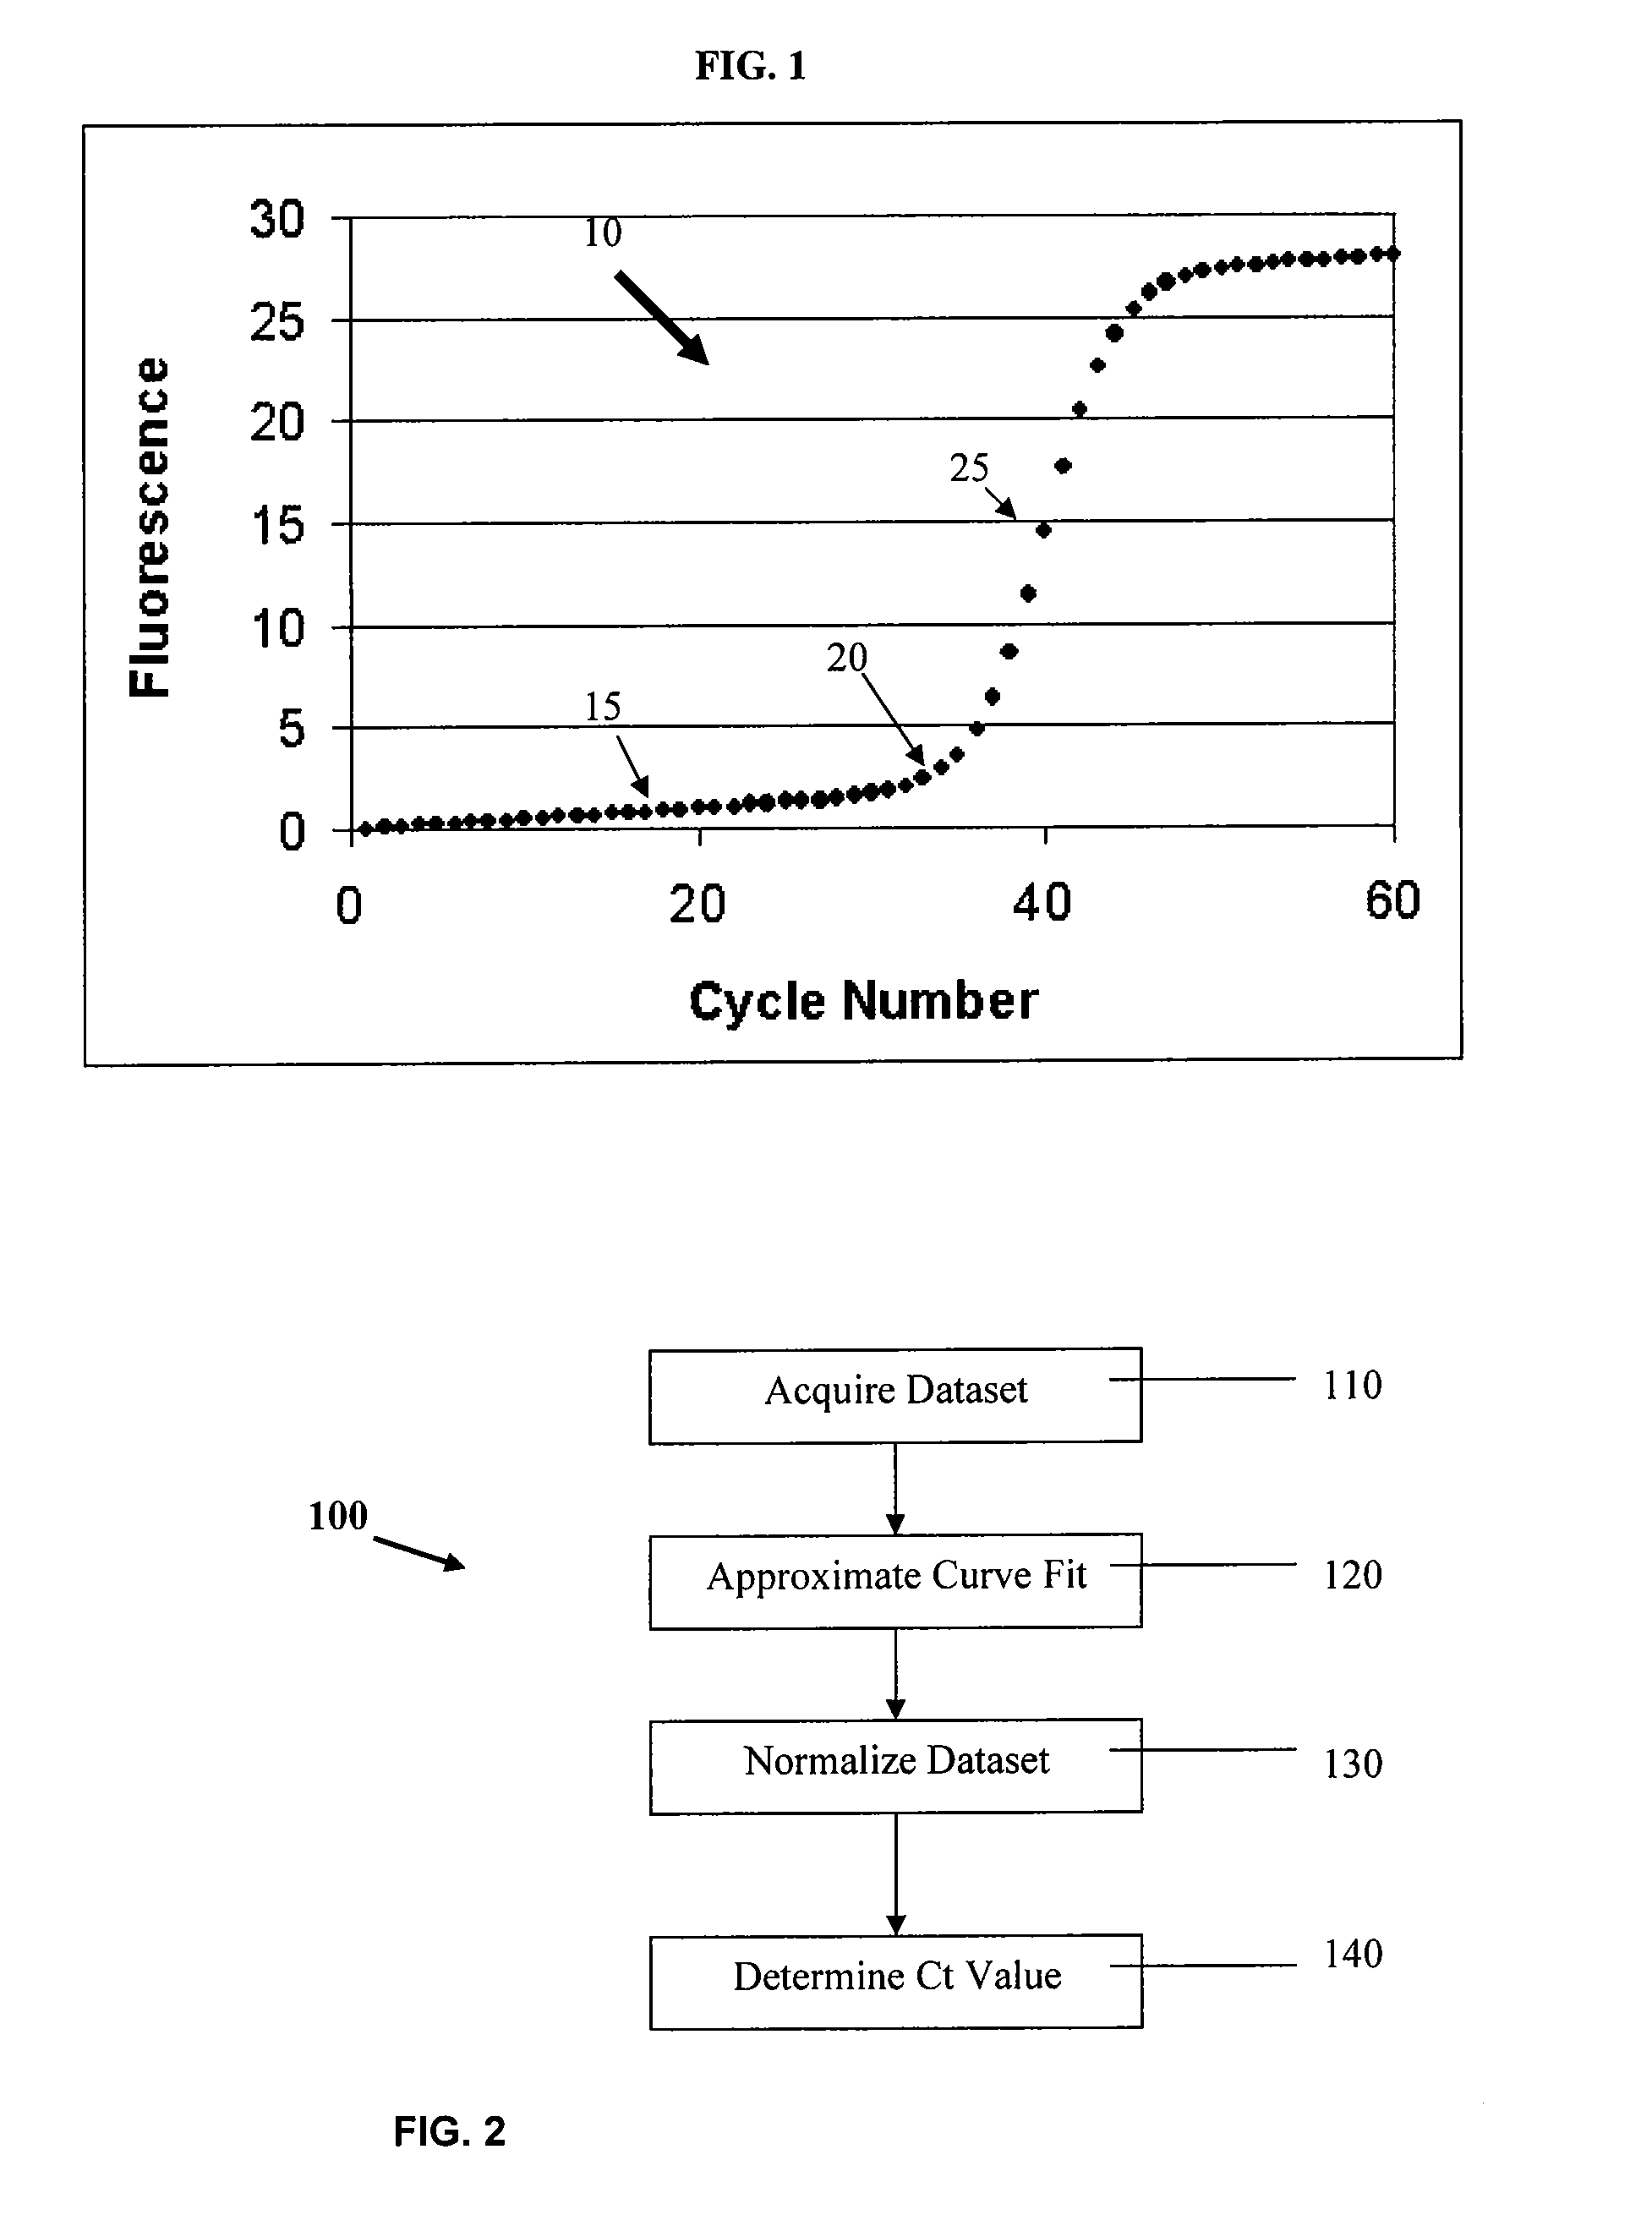
PCR elbow determination using curvature analysis of a double sigmoid
a curvature analysis and elbow technology, applied in the direction of mechanical measuring arrangements, instruments, using mechanical means, etc., can solve the problems of insatiable work of traditional methods to determine the baseline stop (or end of the baseline) for the growth curve shown in fig. 1 and other problems
- Summary
- Abstract
- Description
- Claims
- Application Information
AI Technical Summary
Benefits of technology
Problems solved by technology
Method used
Image

Examples
examples
[0111]FIG. 12a shows an example of raw data for a growth curve. Applying the double sigmoid / LM method to the raw data plot shown in FIG. 12b gives values of the seven parameters in equation (1) as shown in Table 4 below:
[0112]
TABLE 4a1.4707b0.0093c10.9421d0.7858e35.9089f0.1081g49.1868
The double sigmoid fit to the data shown in FIG. 12 is shown in FIG. 13, indicating a very accurate assessment of the data points. These data were then normalized according to equation (6) (baseline subtraction) to yield the graph shown in FIG. 14. The solid line shown in FIG. 14 is the double sigmoid / LM application of equation (1) to the data set, which has been normalized according to equation (6). FIG. 15 shows a plot of the curvature v. cycle number for the normalized curve of FIG. 14. The maximum in the curvature occurs at cycle number 34.42 at a curvature of 0.1378. Thus, Ct=34.42 based on the cycle number at maximum curvature, and the radius of curvature=1 / 0.1378=7.25. A superposition of a circle...
PUM
| Property | Measurement | Unit |
|---|---|---|
| curvature | aaaaa | aaaaa |
| cycle threshold | aaaaa | aaaaa |
| Ct | aaaaa | aaaaa |
Abstract
Description
Claims
Application Information