Use of impedance-based cytological profiling to classify cellular response profiles upon exposure to biologically active agents

a cytological profiling and impedance-based technology, applied in the field of impedance-based cytological profiling to classify cellular response profiles upon exposure to biologically active agents, can solve the problem of general non-kinetic information about cellular response processes in these conventional multi-dimensional profiling technologies

Active Publication Date: 2011-10-18
AGILENT TECH INC
View PDF92 Cites 20 Cited by
  • Summary
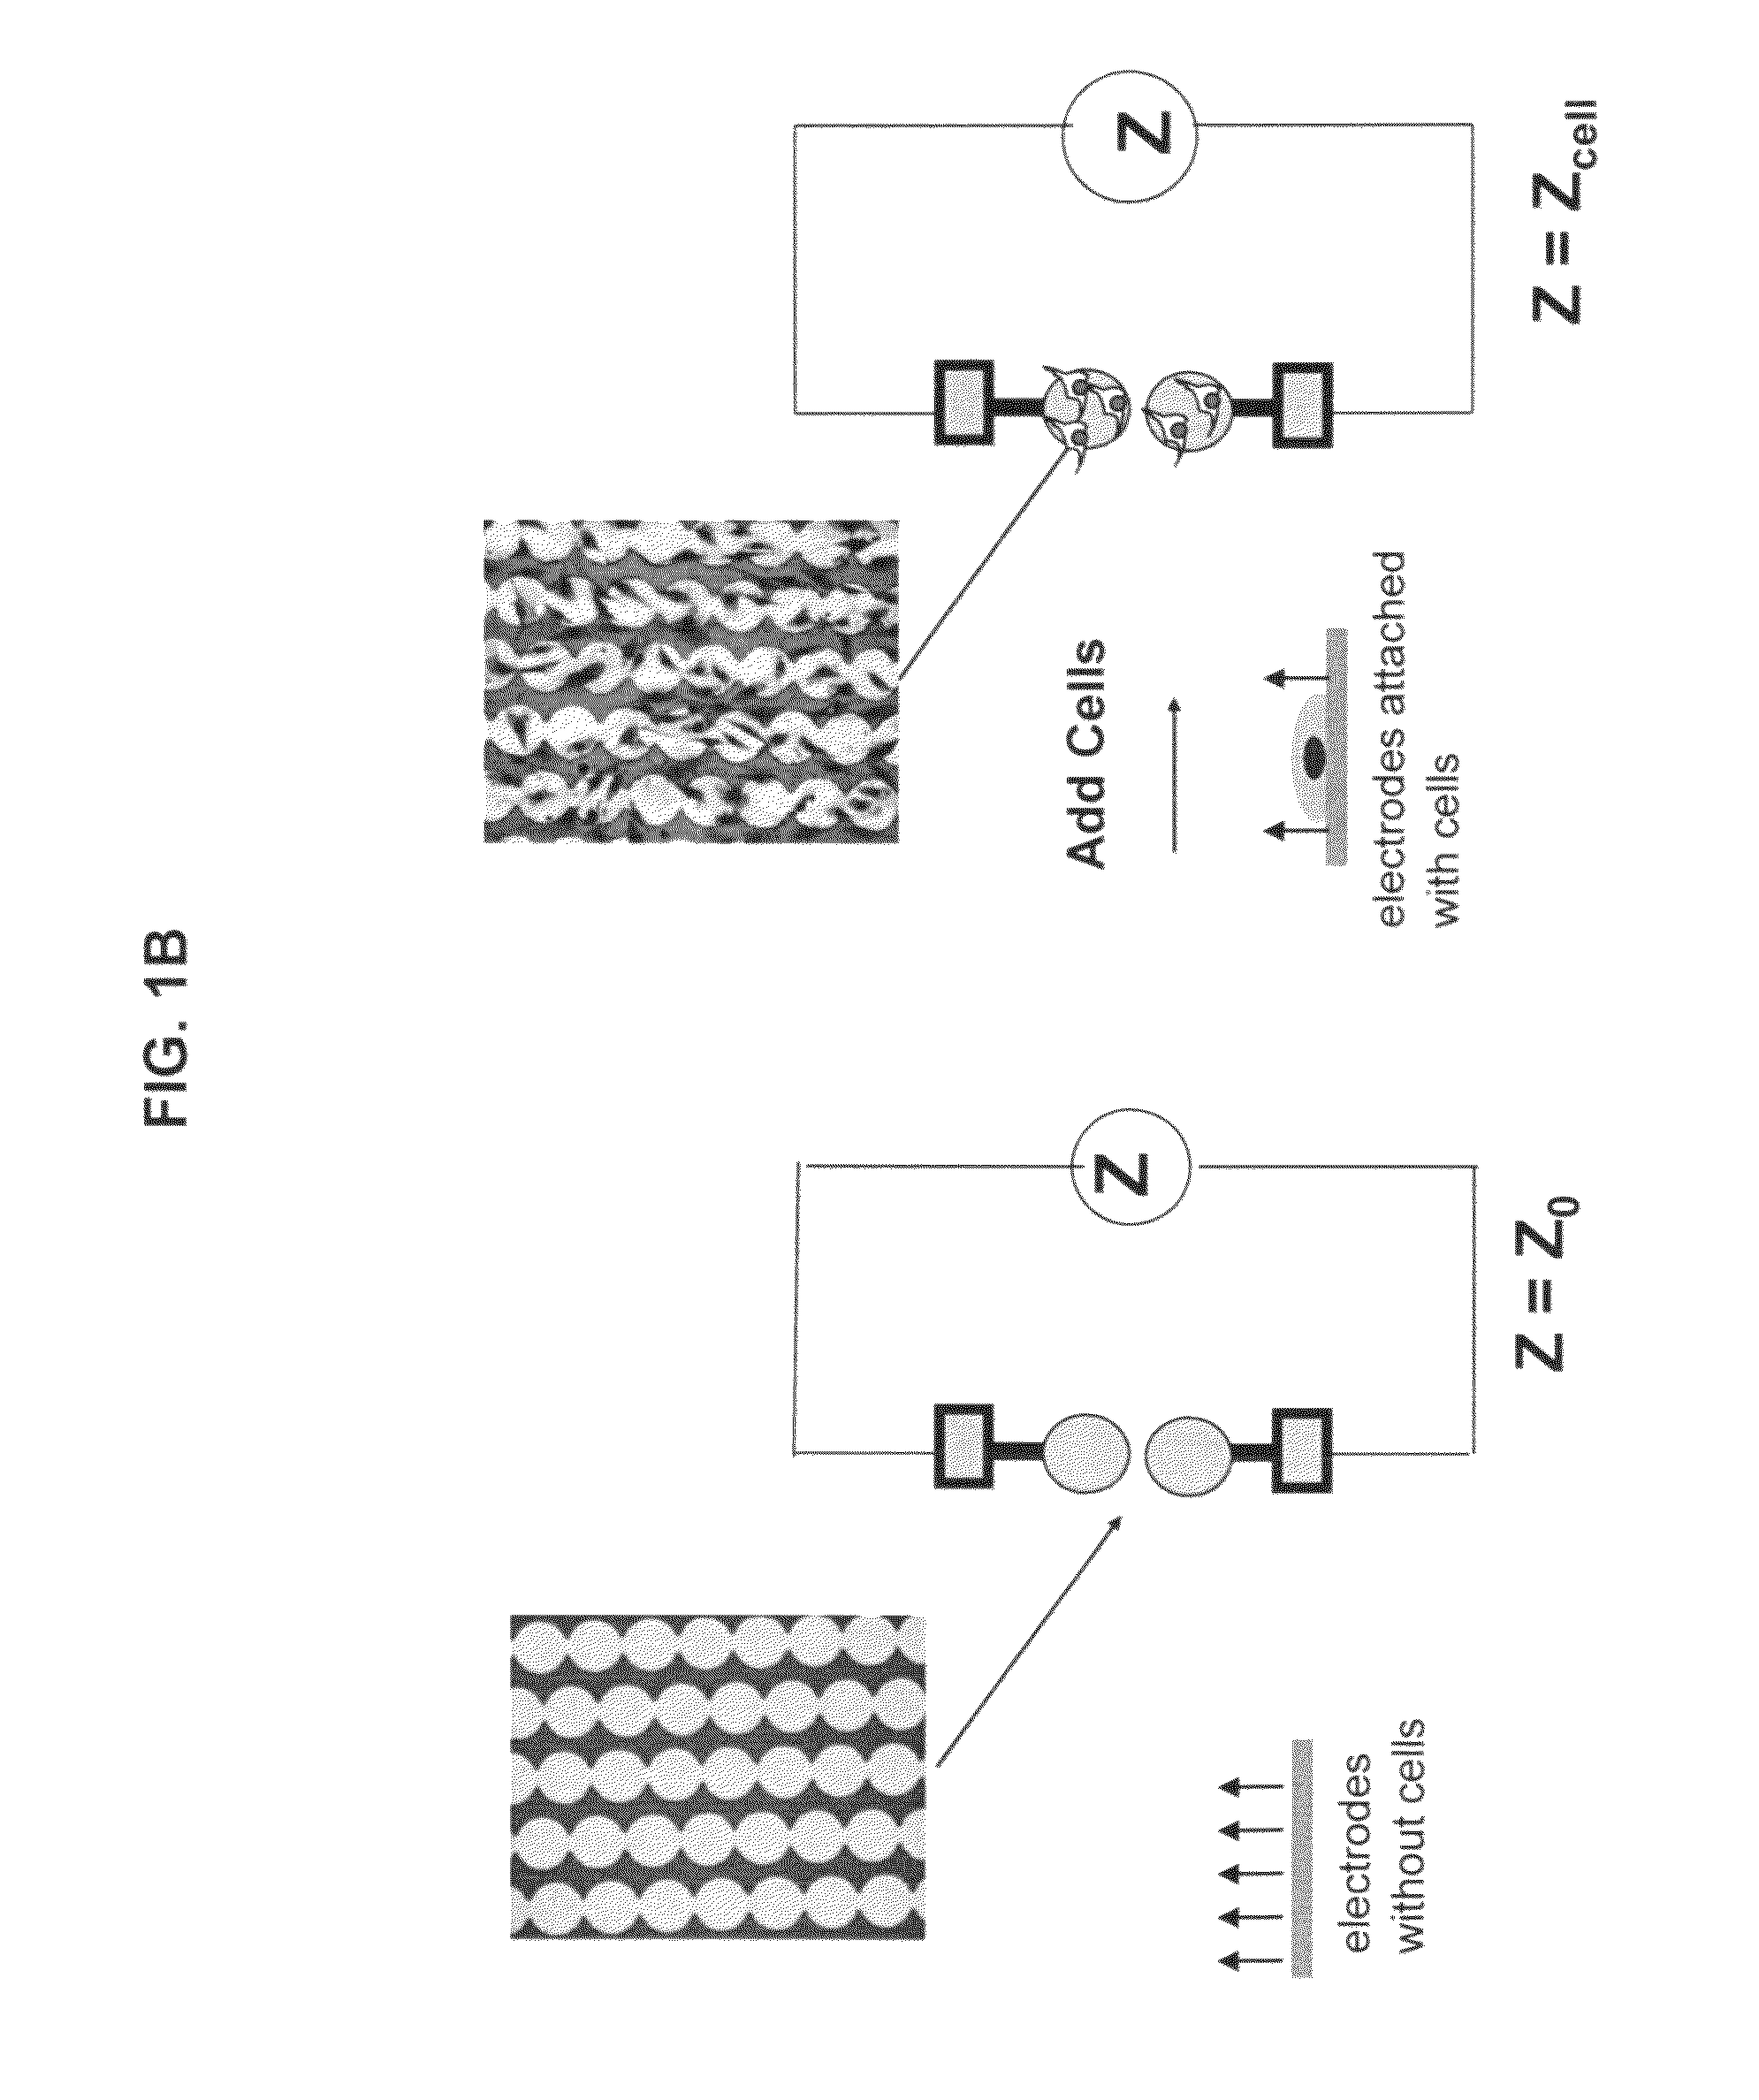
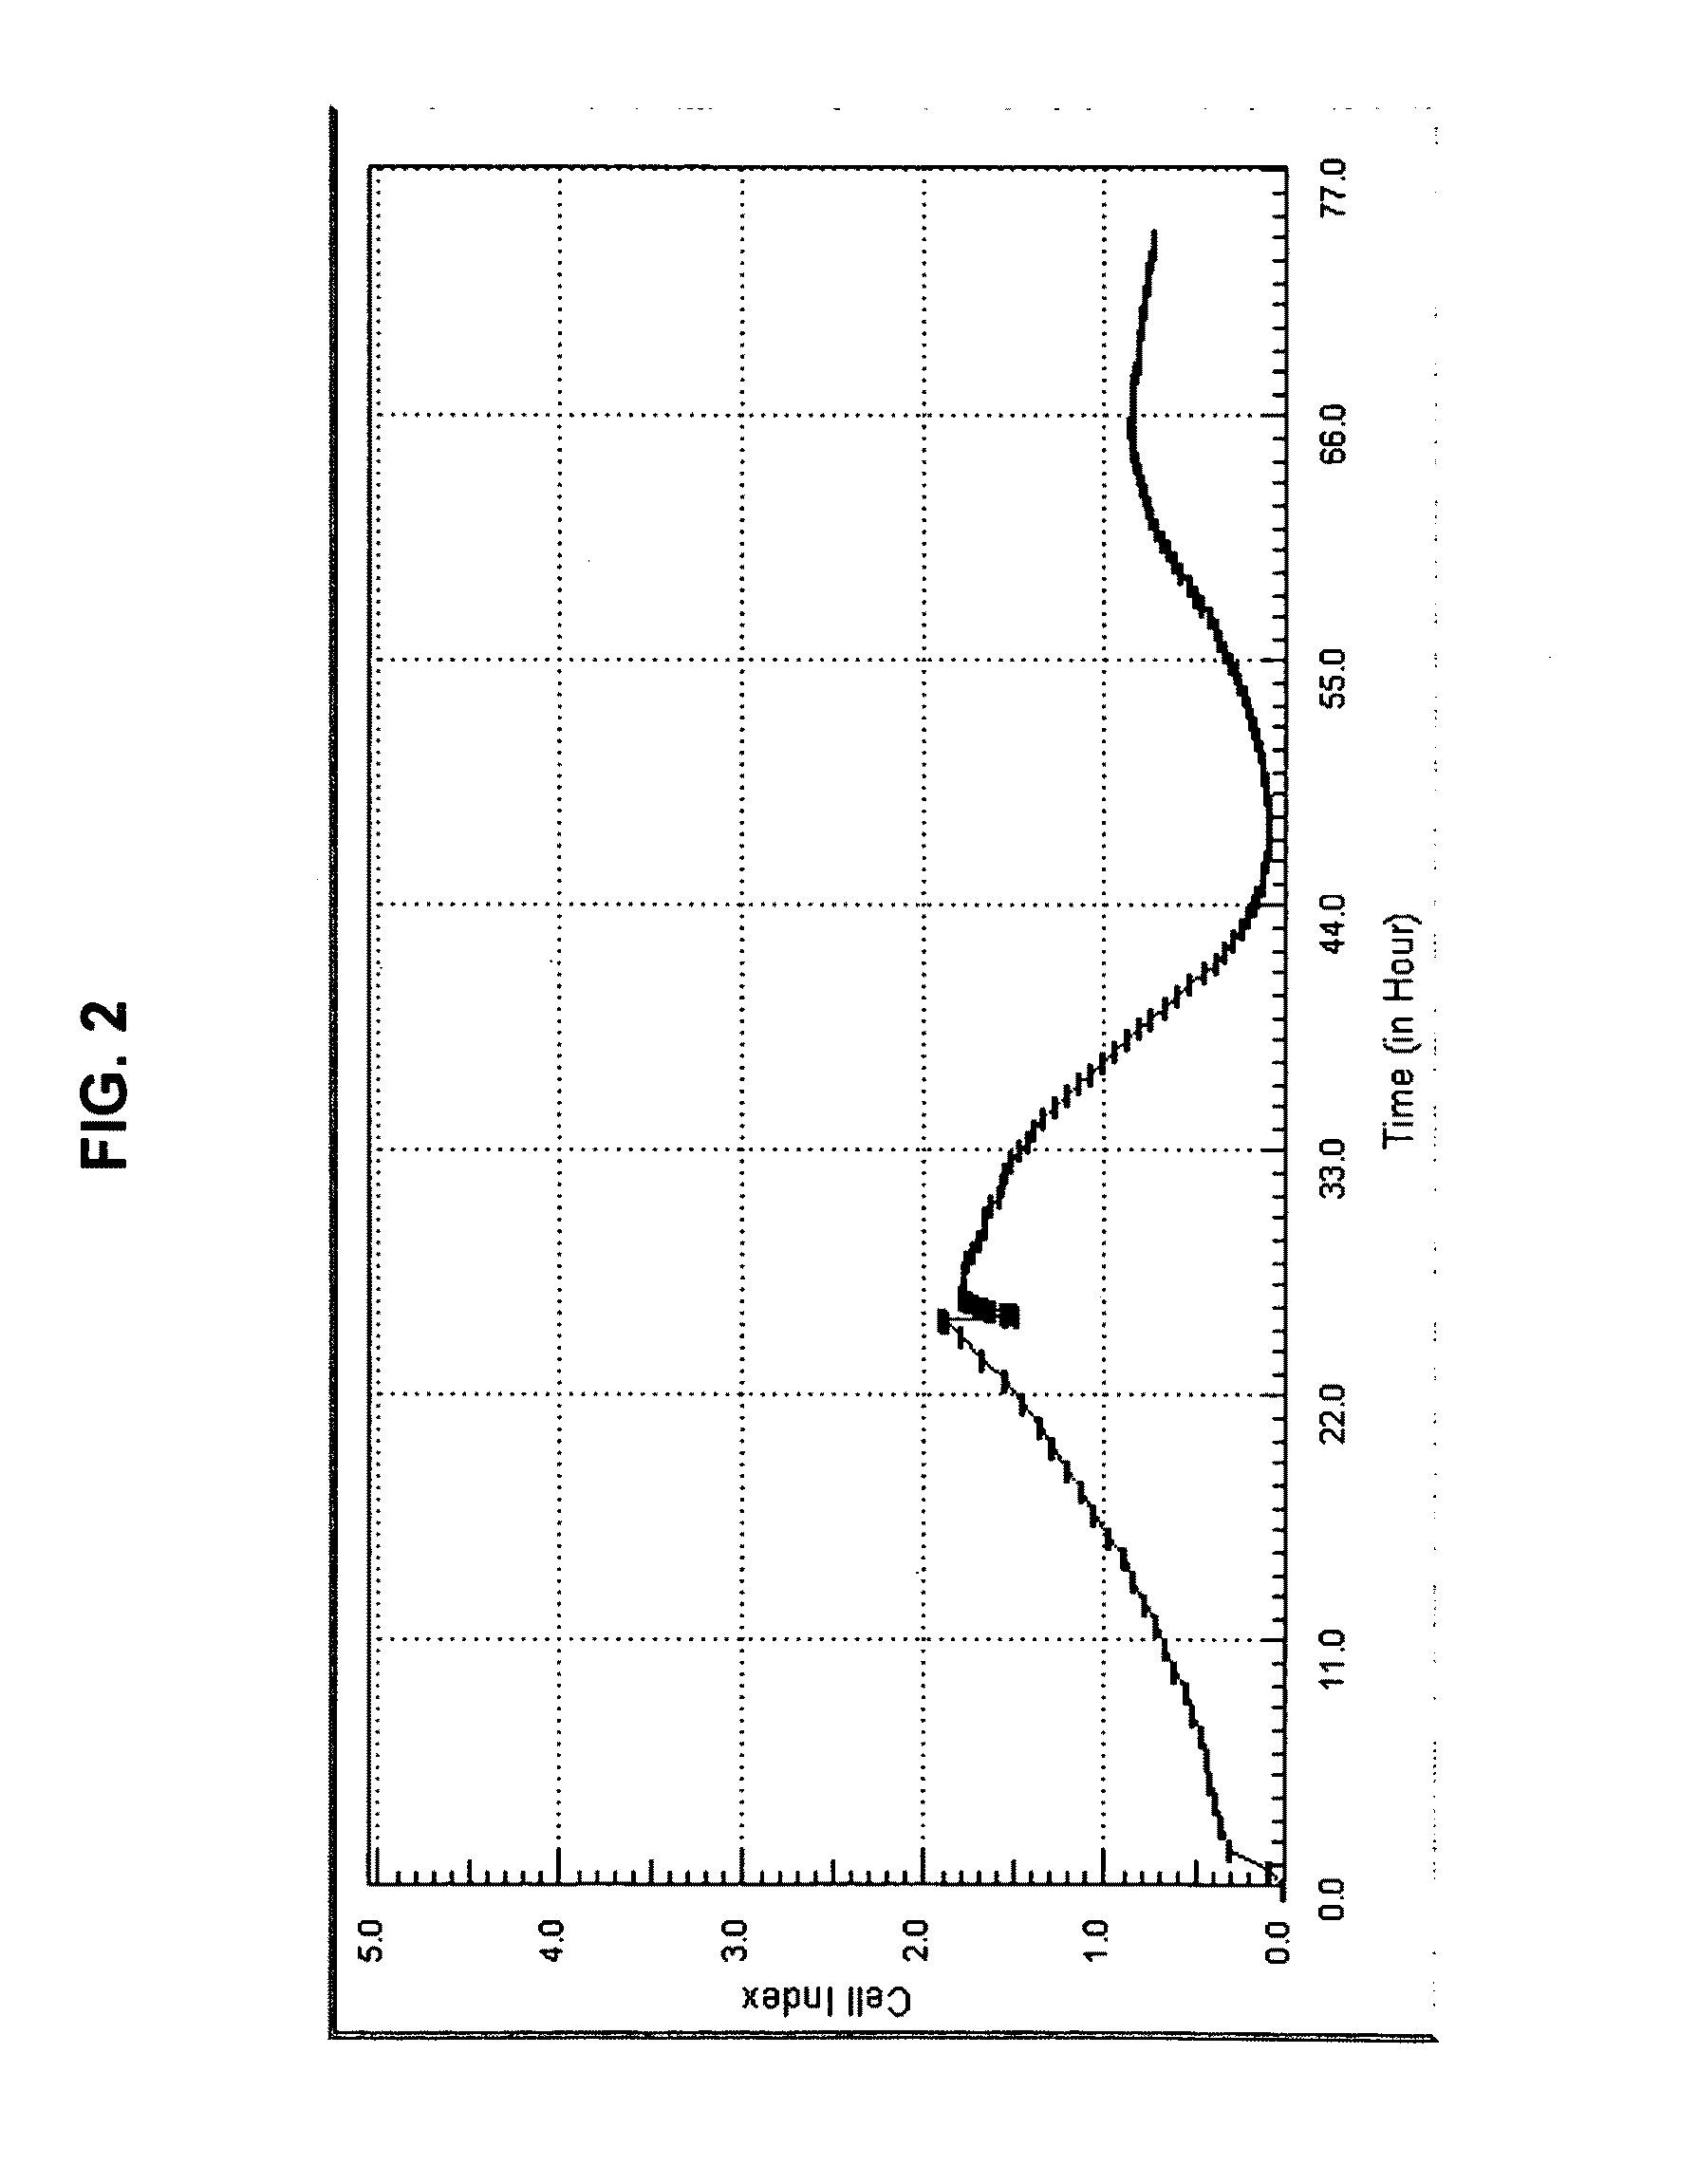
  • Abstract
  • Description
  • Claims
  • Application Information

AI Technical Summary

Benefits of technology

[0005]The present invention provides methods of multi-dimensional profiling of biologically active agents and determining their effects on biological systems. The methods of the present invention include real-time impedance monitoring of cellular responses to biologically active agents and categorization of cellular kinetic profiles into mechanism specific cellular response profile groups. The grouping of similar cellular response profiles allows the correlation between agent and mechanism, thus allowing for the identification of potential therapeutic applications of agents or further study of cellular responses or mechanisms.
[0006]The impedance-based system of the present invention provides numerous benefits over the currently used techniques. First, the signature activity profiles are derived from a single well without any extensive manipulations such as washing, fixation, lysing and staining. Second, impedance measurements are based on the inherent cellular response to compounds such as modulation of cell viability, morphology and or adhesion, and therefore precludes the need for engineering the cell with reporter proteins such as GFP or luciferase. Thirdly, impedance-based technology can monitor both short and long term responses and therefore can better predict off target effects or mechanisms that may be kinetically distinct and isolated. This is a key difference between impedance-based technology and previous multi-dimensional profiling technologies. In impedance-based technology, the multi-dimensional nature of the data relates to the impedance measurement being conducted at multiple time points after cells are exposed to biologically active agents. Thus, the impedance-based technology can monitor entire process of cellular response to a treatment by biologically active agents. This is in contrast with conventional multi-dimensional profiling technologies where multi-assay targets are analyzed and monitored at a given time after cells are treated with biologically active agents. Therefore, there is generally no kinetic information about cellular response processes in these conventional multi-dimensional profiling technologies. Indeed, the present invention includes monitoring kinetic cell-electrode impedance response curves to biologically active agents and classifying these response curves to different groups.

Problems solved by technology

Therefore, there is generally no kinetic information about cellular response processes in these conventional multi-dimensional profiling technologies.

Method used


Image

  • Use of impedance-based cytological profiling to classify cellular response profiles upon exposure to biologically active agents
  • Use of impedance-based cytological profiling to classify cellular response profiles upon exposure to biologically active agents
  • Use of impedance-based cytological profiling to classify cellular response profiles upon exposure to biologically active agents

Examples


example 1

Comparing Curves

[0142]A variety of nonlimiting approaches may be used to identify similarities between curves and thus correlate biologically active agents to specific mechanisms. In one approach, the correlation coefficient between the two curves is used to define the similarity degree between the two curves. For example, give a curve one being

C1(ti); {i=1, 2, 3, . . . N},

and another curve being

C2(ti); {i=1, 2, 3, . . . N},

where curve one attains a value C1(ti) at a time point ti and curve two has a value of C1(ti) at the time point ti.

[0143]The correlation coefficient between these two curves is calculated using this approach,

[0144]CC⁡(1,2)=N⁢∑i⁢⁢[C1⁡(ti)⁢C2⁡(ti)]-∑i⁢⁢C1⁡(ti)·∑C2⁡(ti)[N⁢∑i⁢⁢[C1⁡(ti)]2-(∑i⁢⁢C1⁡(ti))2][N⁢∑i⁢⁢[C2⁡(ti)]2-(∑i⁢⁢C2⁡(ti))2].

The larger the correlation coefficient, the more similar the two curves are. Since calculation of correlation coefficients is for comparing and categorizing cell responses to biologically active agents, thus, the time points used for c...

example 2

Determining the Distance Between a Curve and Curve Group

[0163]Assuming a is a single curve, B is a curve group which contains M curves, there are several ways to define the distance between a curve a and a curve group B. The curve group B contains M curves, being curve b1, b2, b3, . . . bM. One distance between curve a and curve group B is the average distance, defined as follows:

[0164]d(ave)⁢aB=1M⁢∑k=1M⁢⁢dabkHere⁢⁢dabk⁢⁢is⁢⁢defined⁢⁢as⁢⁢⁢dabk=∑i=1n⁢⁢(Yai-Ybk⁢i)2

Here, Yai is the y value of curve a at ith-time point i, Ybki is the y value of curve bk at ith time point.

The minimum distance between curve a and curve group B may be determined by:

d(min)aB=min(dab1, dab2, . . . , dabM)

The maximum distance between curve a and curve group B may be determined by:

d(max)aB=max(dab1,dab2, . . . , dabM)

example 3

Calculating Distances Between Two Curve Groups

[0165]In many cases the distance between two curve groups must be determined. Assuming A is a curve group with J curves: being curve a1, a2, a3, . . . aJ, B is another curve group with M curves being curve b1, b2, b3, . . . bM, the distances between A and B are defined as follows:

[0166]The average distance between curve group A and curve group B can be calculated by:

[0167]d(ave)⁢AB=1JM⁢∑l=1J⁢⁢∑k=1M⁢⁢dal⁢bk

[0168]The minimum distance between curve group A and curve group B may be the minimum distance between any curve pair, one of the pair from curve group A and another from curve group B, being determined by:

[0169]d(min)⁢AB=minl=1:J;k=1:M⁢(dal⁢bk)

The maximum distance between A and B may be the maximum distance between any curve pair, one of the pair from curve group A and another from curve group B, being determined by:

[0170]d(min)⁢AB=minl=1:J;k=1:M⁢(dal⁢bk)


PUM

PropertyMeasurementUnit
timeaaaaaaaaaa
lengthaaaaaaaaaa
lengthaaaaaaaaaa

Abstract

The present invention provides methods of multi-dimensional profiling of biologically active agents and determining their effects on biological systems. The methods of the present invention include real-time impedance monitoring of cellular responses to biologically active agents and categorization of cellular kinetic profiles into mechanism specific cellular response profile groups. The grouping of similar cellular response profiles allows the correlation between agent and mechanism, thus allowing for the identification of potential therapeutic applications of agents or further study of cellular responses or mechanisms.

Description

CROSS REFERENCE TO RELATED APPLICATIONS[0001]This application claims benefit of priority to U.S. patent application Ser. No. 60 / 846,067, filed on Sep. 20, 2006, and is herein incorporated by reference in its entirety.TECHNICAL FIELD OF THE INVENTION[0002]The present invention relates generally to methods of determining effects on biological systems upon exposure to biologically active molecules and more specifically to the categorization of mechanism specific cellular response profile groups and their association with biologically active agents.BACKGROUND OF THE INVENTION[0003]The advent of combinatorial chemistry and high throughput screening techniques has revolutionized the drug discovery process allowing for screening and generation of small molecule lead compounds against molecular targets at an unprecedented rate. Most screening assays for small molecule compounds are target driven and it is often difficult to control for off-target interactions. However, the potential interac...

Claims


Application Information

Patent Timeline
Patent Type & Authority Patents(United States)
IPC IPC(8): G06F19/00C12Q1/02C12M1/42
CPCG01N33/502
Inventor WANG, XIAOBOABASSI, YAMA A.ZHANG, WEN FUXU, XIAO
Owner AGILENT TECH INC
Why Eureka
Try Eureka