System and method for three-dimensional visualization of vulnerability and asset data

a technology of asset data and system and method, applied in the field of system and method for three-dimensional visualization of asset data, can solve problems such as reducing the amount of tim

Active Publication Date: 2013-10-01
TENABLE INC
View PDF101 Cites 49 Cited by
  • Summary
  • Abstract
  • Description
  • Claims
  • Application Information

AI Technical Summary

Benefits of technology

[0008]Accordingly to one aspect of the invention, the system and method for three-dimensional visualization of vulnerability and asset data described herein may distribute one or more active vulnerability scanners, one or more passive vulnerability scanners, and a log correlation engine at various locations in a network, and the system and method described herein may further distribute a management console in communication with the active vulnerability scanners, the passive vulnerability scanners, and the log correlation engine, whereby the management console may provide a comprehensive solution to manage topologies, vulnerabilities, assets, and other information associated with the network.
[0010]Accordingly to one aspect of the invention, the passive vulnerability scanners may passively observe traffic in the network to further build the model or topology of the network and further identify the vulnerabilities in the network and detect activity that may potentially target the vulnerabilities. In one implementation, the passive vulnerability scanners may be distributed at various locations in the network to monitor traffic traveling across the network, including traffic originating from the remote network and / or directed to the remote network, thereby supplementing the information obtained by the active vulnerability scanners. For example, the passive vulnerability scanners may monitor the traffic to identify vulnerabilities, assets, or information from that the active vulnerability scanners may be unable to obtain from previously inactive assets that subsequently participate in network sessions. Additionally, the passive vulnerability scanners may be deployed directly within or adjacent to an intrusion detection system sensor, which may provide visibility into intrusion events or other security exceptions that the intrusion detection system sensor identifies. Thus, the passive vulnerability scanners may generally sniff packets traveling across, originating from, or directed to the network to identify new hosts, open ports, client / server applications, vulnerabilities, network sessions, or information associated with the activity that occurs in the network. In one implementation, the information that the passive vulnerability scanners obtains from sniffing the traffic associated with the network may therefore provide a real-time record describing the activity that occurs in the network, whereby the passive vulnerability scanners may behave like a security motion detector on the network (i.e., mapping and monitoring any vulnerabilities, assets, services, applications, sensitive data, and other information that newly appear or change in the network).
[0012]According to one aspect of the invention, as noted above, the management console may integrate the information obtained by the active vulnerability scanners, the passive vulnerability scanners, and the log correlation engine. The management console may therefore provide a unified solution that aggregates the vulnerability and asset information obtained by the active vulnerability scanners, the passive vulnerability scanners, and the log correlation engine, whereby the management console may comprehensively manage governance, risk, and compliance across the network. In one implementation, the management console may further include a three-dimensional visualization tool that provides capabilities that administrators or other suitable users can use to search the information aggregated at the management console for particular vulnerabilities, assets, compliance data, or other information relating to the network. Thus, the three-dimensional visualization tool included in the management console may generate three-dimensional visualizations that graphically represent the vulnerabilities, assets, compliance data, or other information relating to the network in a manner that can simplify management of the network.

Problems solved by technology

Thus, limiting the portions of the network and / or the remote network that the active vulnerability scanners interrogate, probe, or otherwise scan, and having the active vulnerability scanners perform the scans in parallel may reduce the amount of time that the active vulnerability scans consume because the active vulnerability scanners can be distributed closer to scanning targets, the active vulnerability scanners may scan limited portions of the network rather than the entire network, and the parallel active scans may obtain information from the different portions of the network in an amount of time that substantially corresponds to the amount of time associated with one active scan.

Method used


Image

  • System and method for three-dimensional visualization of vulnerability and asset data
  • System and method for three-dimensional visualization of vulnerability and asset data
  • System and method for three-dimensional visualization of vulnerability and asset data

Examples


Embodiment Construction

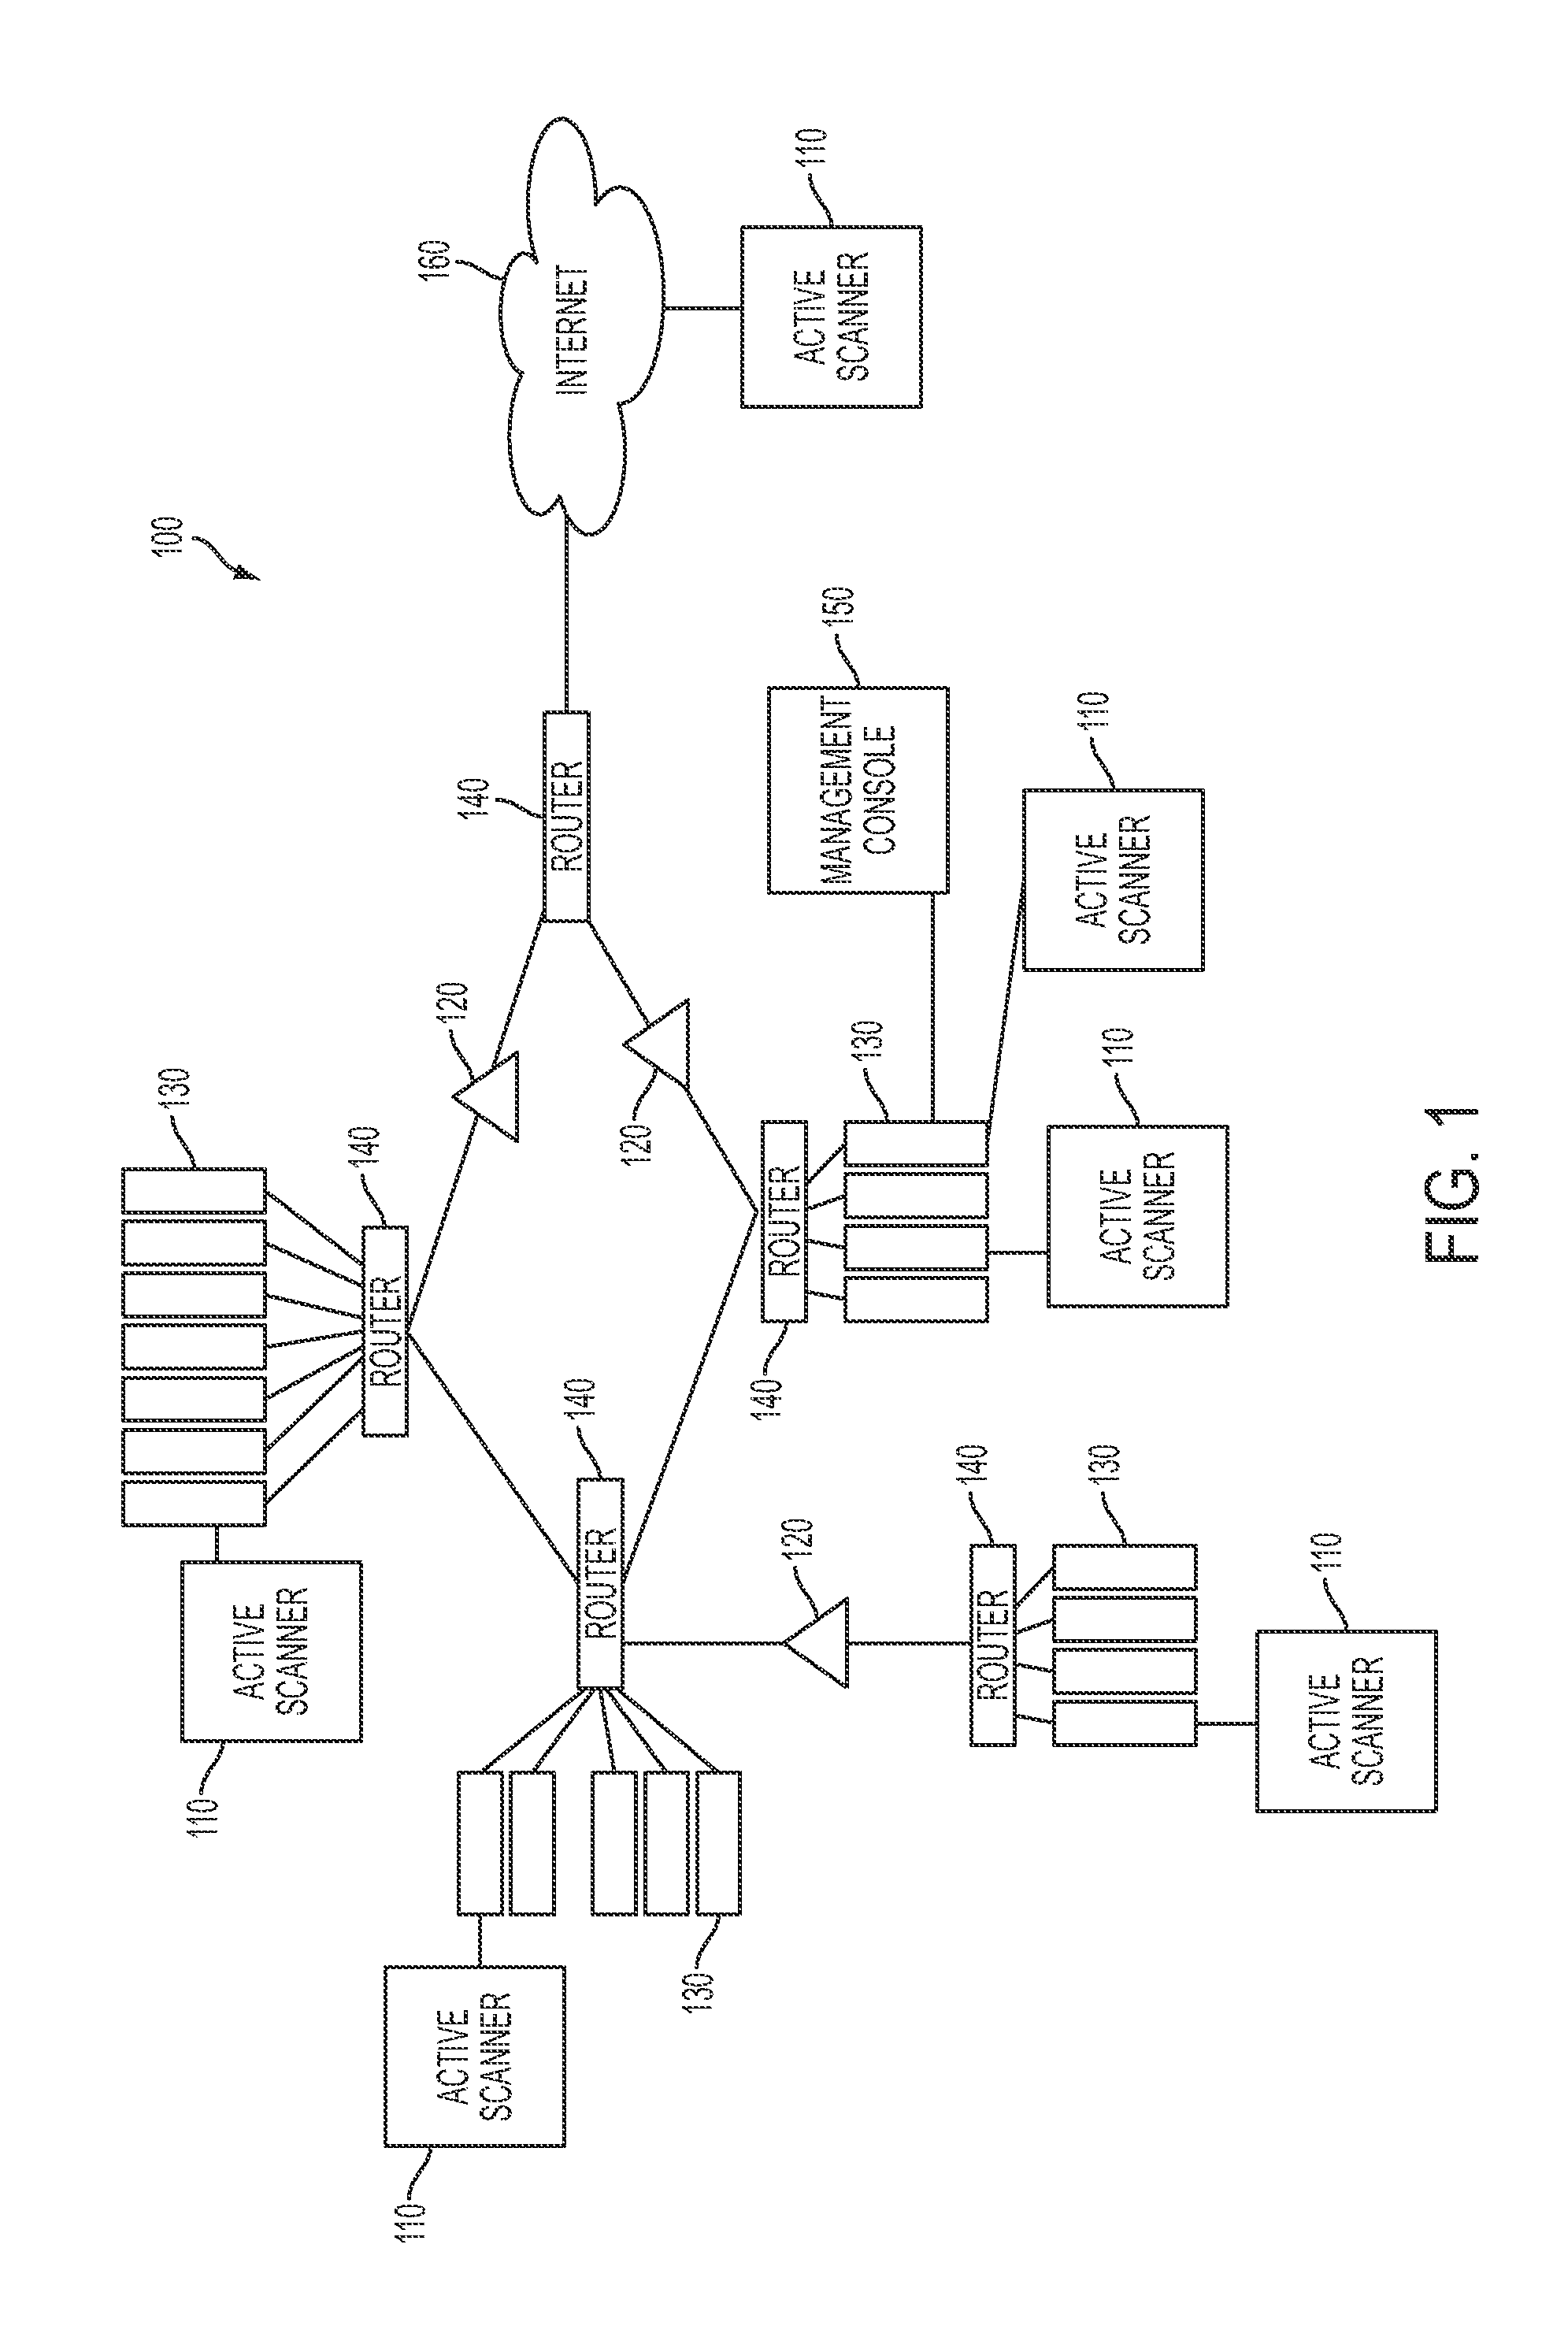
[0021]According to one aspect of the invention, FIG. 1 illustrates a schematic diagram of an exemplary system 100 for three-dimensional visualization of vulnerability and asset data in a network. In particular, the system 100 shown in FIG. 1 may generally include one or more passive vulnerability scanners 120 that can observe traffic in a packet stream traveling in a network to identify vulnerabilities in the network and detect activity that may target the identified vulnerabilities, and may further include one or more active vulnerability scanners 110 that can communicate packets or other messages within the network to detect new or changed information describing various routers 140, hosts 130, servers 130, or other devices 130 in the network. For example, in one implementation, the active vulnerability scanners 110 may scan certain hosts 130, servers 130, or other devices 130 in the network during a security audit. The information obtained from the active vulnerability scanners 11...


PUM


Abstract

The system and method for three-dimensional visualization of vulnerability and asset data described herein may provide a management console that integrates various active vulnerability scanners, various passive vulnerability scanners, and a log correlation engine distributed in a network. In particular, the management console may include a three-dimensional visualization tool that can be used to generate three-dimensional visualizations that graphically represent vulnerabilities and assets in the network from the integrated information that management console collects the active vulnerability scanners, the passive vulnerability scanners, and the log correlation engine distributed in the network. As such, the three-dimensional visualization tool may generate three-dimensional representations of the vulnerabilities and assets in the network that can be used to substantially simplify management of the network.

Description

CROSS-REFERENCE TO RELATED APPLICATIONS[0001]This application is related to co-pending U.S. patent application Ser. No. 10 / 863,238, entitled “System and Method for Managing Network Vulnerability Analysis Systems,” filed Jun. 9, 2004, co-pending U.S. patent application Ser. No. 11 / 016,761, entitled “System and Method for Scanning a Network,” filed Dec. 21, 2004, U.S. patent application Ser. No. 11 / 313,710, entitled “System and Method for Managing Events,” filed Dec. 22, 2005, now abandoned, co-pending U.S. patent application Ser. No. 12 / 693,803, entitled “System and Method for Correlating Network Identities and Addresses,” filed Jan. 26, 2010, co-pending U.S. patent application Ser. No. 12 / 695,659, entitled “System and Method for Enabling Remote Registry Service Security Audits,” filed Jan. 28, 2010, and co-pending U.S. patent application Ser. No. 12 / 729,036, entitled “System and Method for Passively Identifying Encrypted and Interactive Network Sessions,” filed Mar. 22, 2010, the co...

Claims


Application Information

Patent Timeline
Patent Type & Authority Patents(United States)
IPC IPC(8): H04L29/06
CPCG06F21/554H04L63/1433
Inventor HANSON, JIM
Owner TENABLE INC
Why Eureka
Try Eureka