Noise spectrum tracking in noisy acoustical signals
a technology of noise spectrum and noise spectrum, applied in the field of identification of noise in acoustic signals, can solve the problems of loss of speech quality, too much or too little noise suppression, difficult noise psd estimation, etc., and achieve the effect of accurate estimation of noise psd and low computational complexity
- Summary
- Abstract
- Description
- Claims
- Application Information
AI Technical Summary
Benefits of technology
Problems solved by technology
Method used
Image
Examples
example 1
Different Resolution, K>J
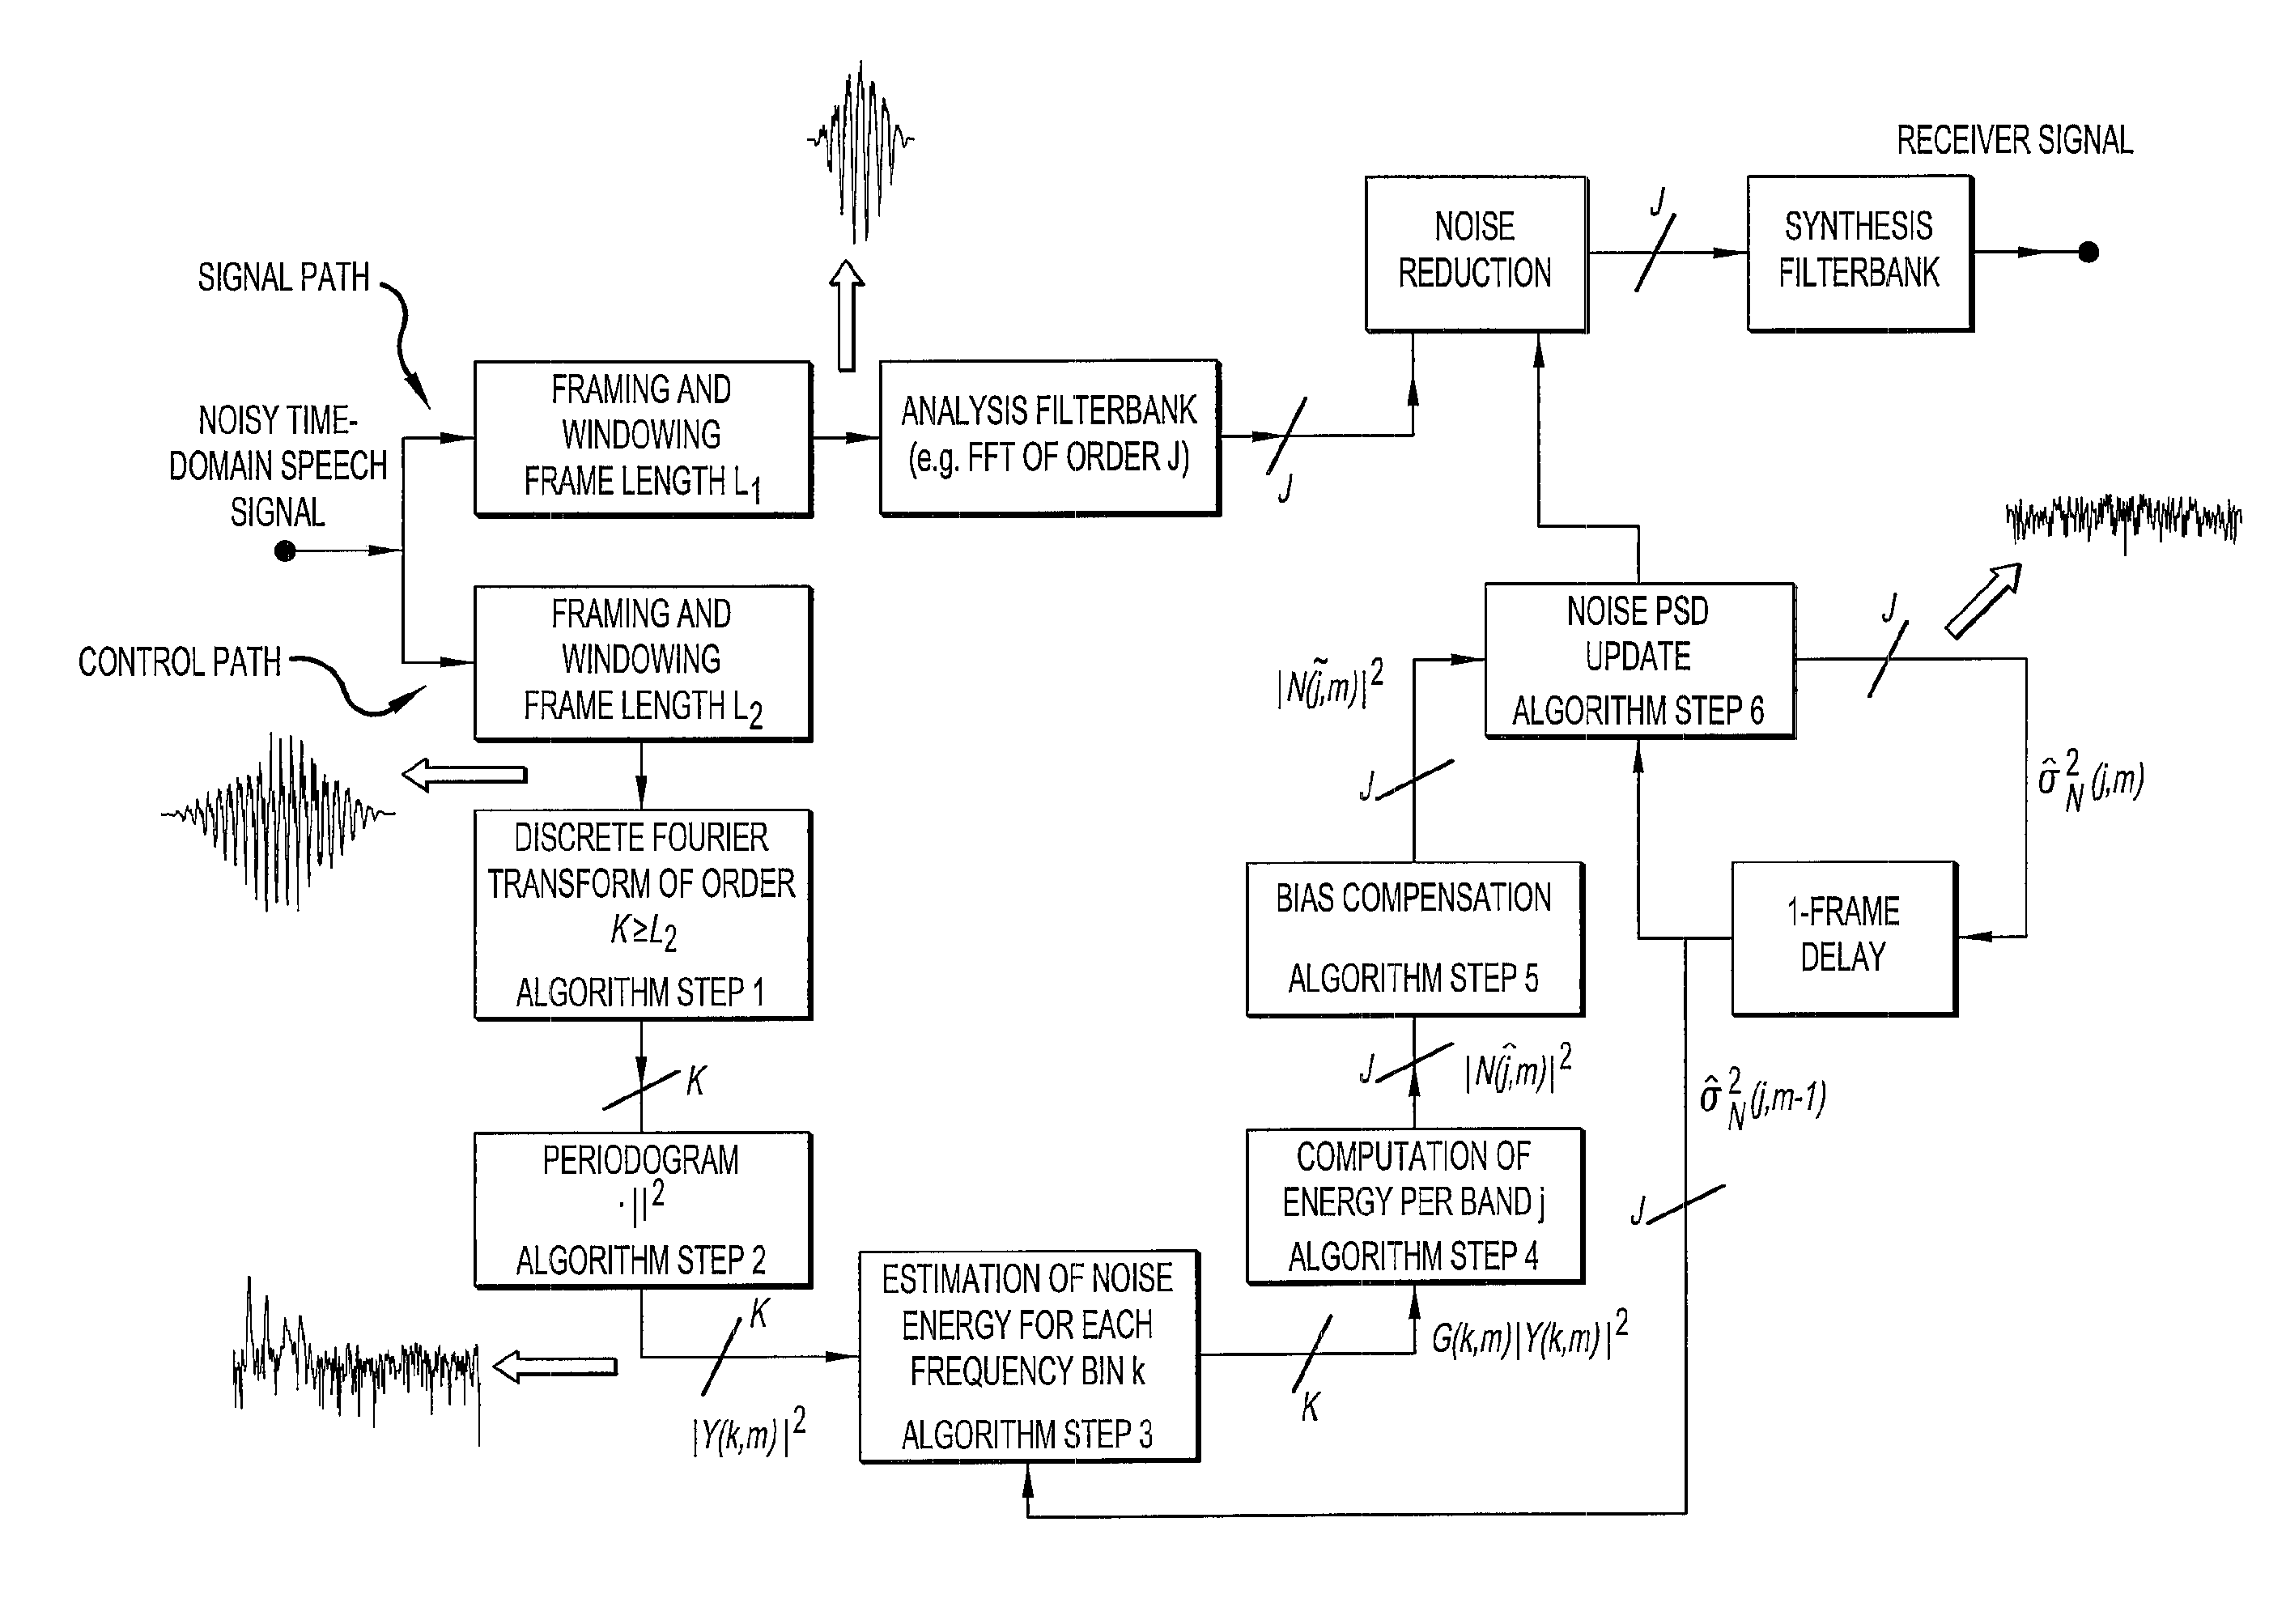
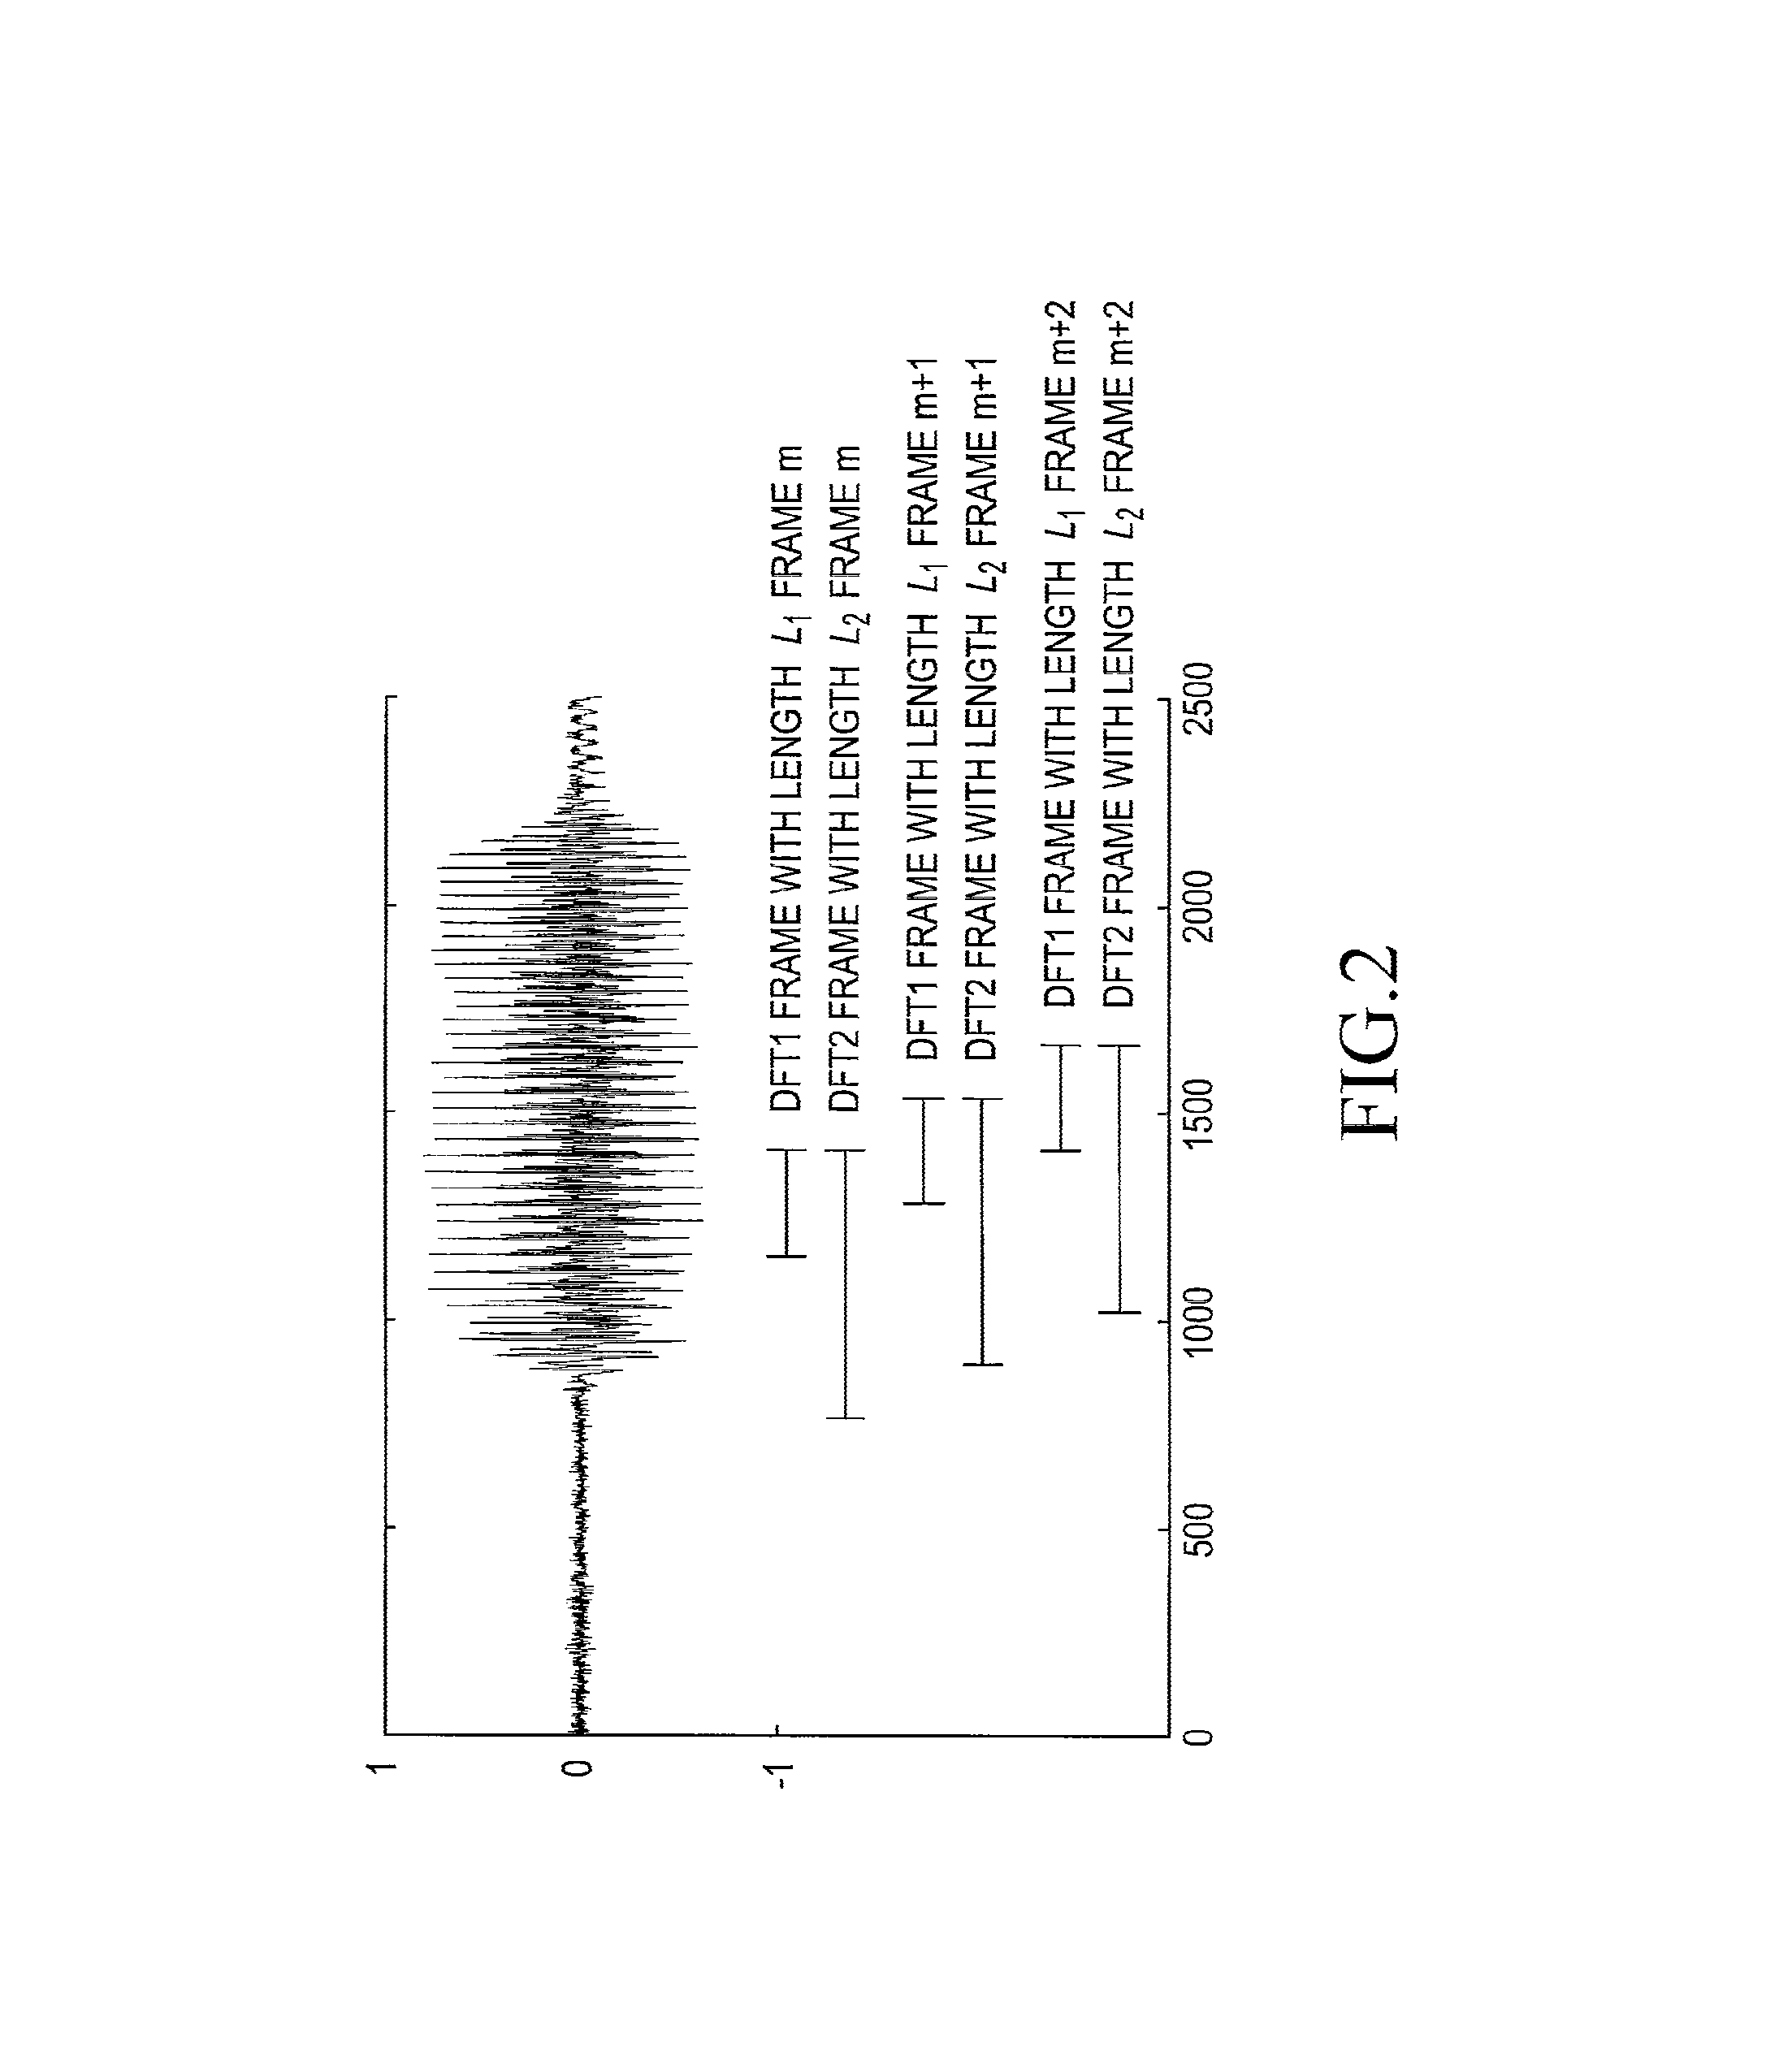
[0128]In a first example of the proposed system we consider the case K>J. Let the sampling frequency fs=8 kHz, and let the DFT1 and DFT2 analysis frames have lengths L1=64 samples and L2=640 samples, respectively. The lengths of the DFT analysis frame and the DFT2 analysis frame then correspond to 8 ms and 80 ms, respectively. The orders of the DFT2 and DFT transform are in this example set at K=1024 (=210) and J=64 (26), respectively.
[0129]The indices of the DFT2 bins corresponding to a sub-band with index-number j, are given by the index set
Bj={k1, . . . , k2}, where k1=(j−½)K / J and k2=(j+½)K / J,
where it is assumed that K and J are integer powers of 2.
[0130]In this example, sub band j consists of P=17 DFT2 spectral values. For example, the sub-band with index-number j=1 then consists of the DFT2 bins with index-numbers 8 . . . 24, and the centre frequency of this band is at the DFT2 bin with index-number k=16.
[0131]Another configuration would be one where ...
example 2
Same Resolution, J=K
[0137]In this example we consider the case K=J, i.e., there is no difference in spectral resolution between the DFT1 and DFT2. Let us again assume that the sampling frequency fs=8 kHz, and let the DFT1 analysis frame have a size of L1=64 samples and the DFT2 analysis frame a size of L2=64 samples. The orders of the DFT2 and DFT1 transform are in this example set at K=J=64, i.e., there is one DFT2 bin k per sub-band j.
[0138]In order to estimate the noise PSD for each sub-band j the steps 3 to 8 from the algorithm description should be followed. An important difference with respect to the previous example is that in step 4 the average noise level in the band is computed by taking the average across one spectral sample, which is, in fact, the spectral sample value itself.
[0139]The present embodiment of the algorithm can e.g. advantageously be used in signal processing applications where an estimate of the noise PSD is needed and processing power is constrained (e.g....
PUM
 Abstract
Description
Claims
Application Information
 - R&D
- Intellectual Property
- Life Sciences
- Materials
- Tech Scout
- Unparalleled Data Quality
- Higher Quality Content
- 60% Fewer Hallucinations
Browse by: Latest US Patents, China's latest patents, Technical Efficacy Thesaurus, Application Domain, Technology Topic, Popular Technical Reports.
© 2025 PatSnap. All rights reserved.Legal|Privacy policy|Modern Slavery Act Transparency Statement|Sitemap|About US| Contact US: help@patsnap.com


