Quantitative analysis method using mass spectrometer

a mass spectrometer and quantitative analysis technology, applied in the direction of calibration apparatus, instruments, separation processes, etc., can solve the problems of inaccurate data, inability to accurately obtain quantitative values (concentration) in mass spectrometry, and inability to measure concentration at high concentration levels

Inactive Publication Date: 2015-03-03
SHIMADZU CORP
View PDF25 Cites 5 Cited by
  • Summary
  • Abstract
  • Description
  • Claims
  • Application Information

AI Technical Summary

Benefits of technology

[0026]With the quantitative analysis method according to the first aspect of the present invention and the mass spectrometer according to the second aspect of the present invention, it is possible to create a correct calibration curve and derive a quantitative value with reference to the calibration curve even if an ion-intensity signal obtained for a high concentration of target compound becomes saturated due to the limitation on the dynamic range of a processing circuit (such as an A / D converter for digitizing signals obtained with an ion detector). Thus, a quantitative analysis covering a wide range of concentrations can be performed without being limited by the dynamic range of the processing circuit.

Problems solved by technology

An input signal exceeding this upper limit causes the output to saturate and makes the data incorrect.
Thus, the range in which the quantitative value (concentration) can be correctly obtained in a mass spectrometry is limited by the dynamic range of the A / D converter.
Therefore, for example, when the system is tuned so as to enable A / D conversion of low ion-intensity signals for the purpose of determining an extremely small quantity, the ion-intensity signal for a high concentration of compound will exceed the dynamic rage of the A / D converter, so that the concentration cannot be measured at high levels of concentration.

Method used


Image

  • Quantitative analysis method using mass spectrometer
  • Quantitative analysis method using mass spectrometer
  • Quantitative analysis method using mass spectrometer

Examples


Embodiment Construction

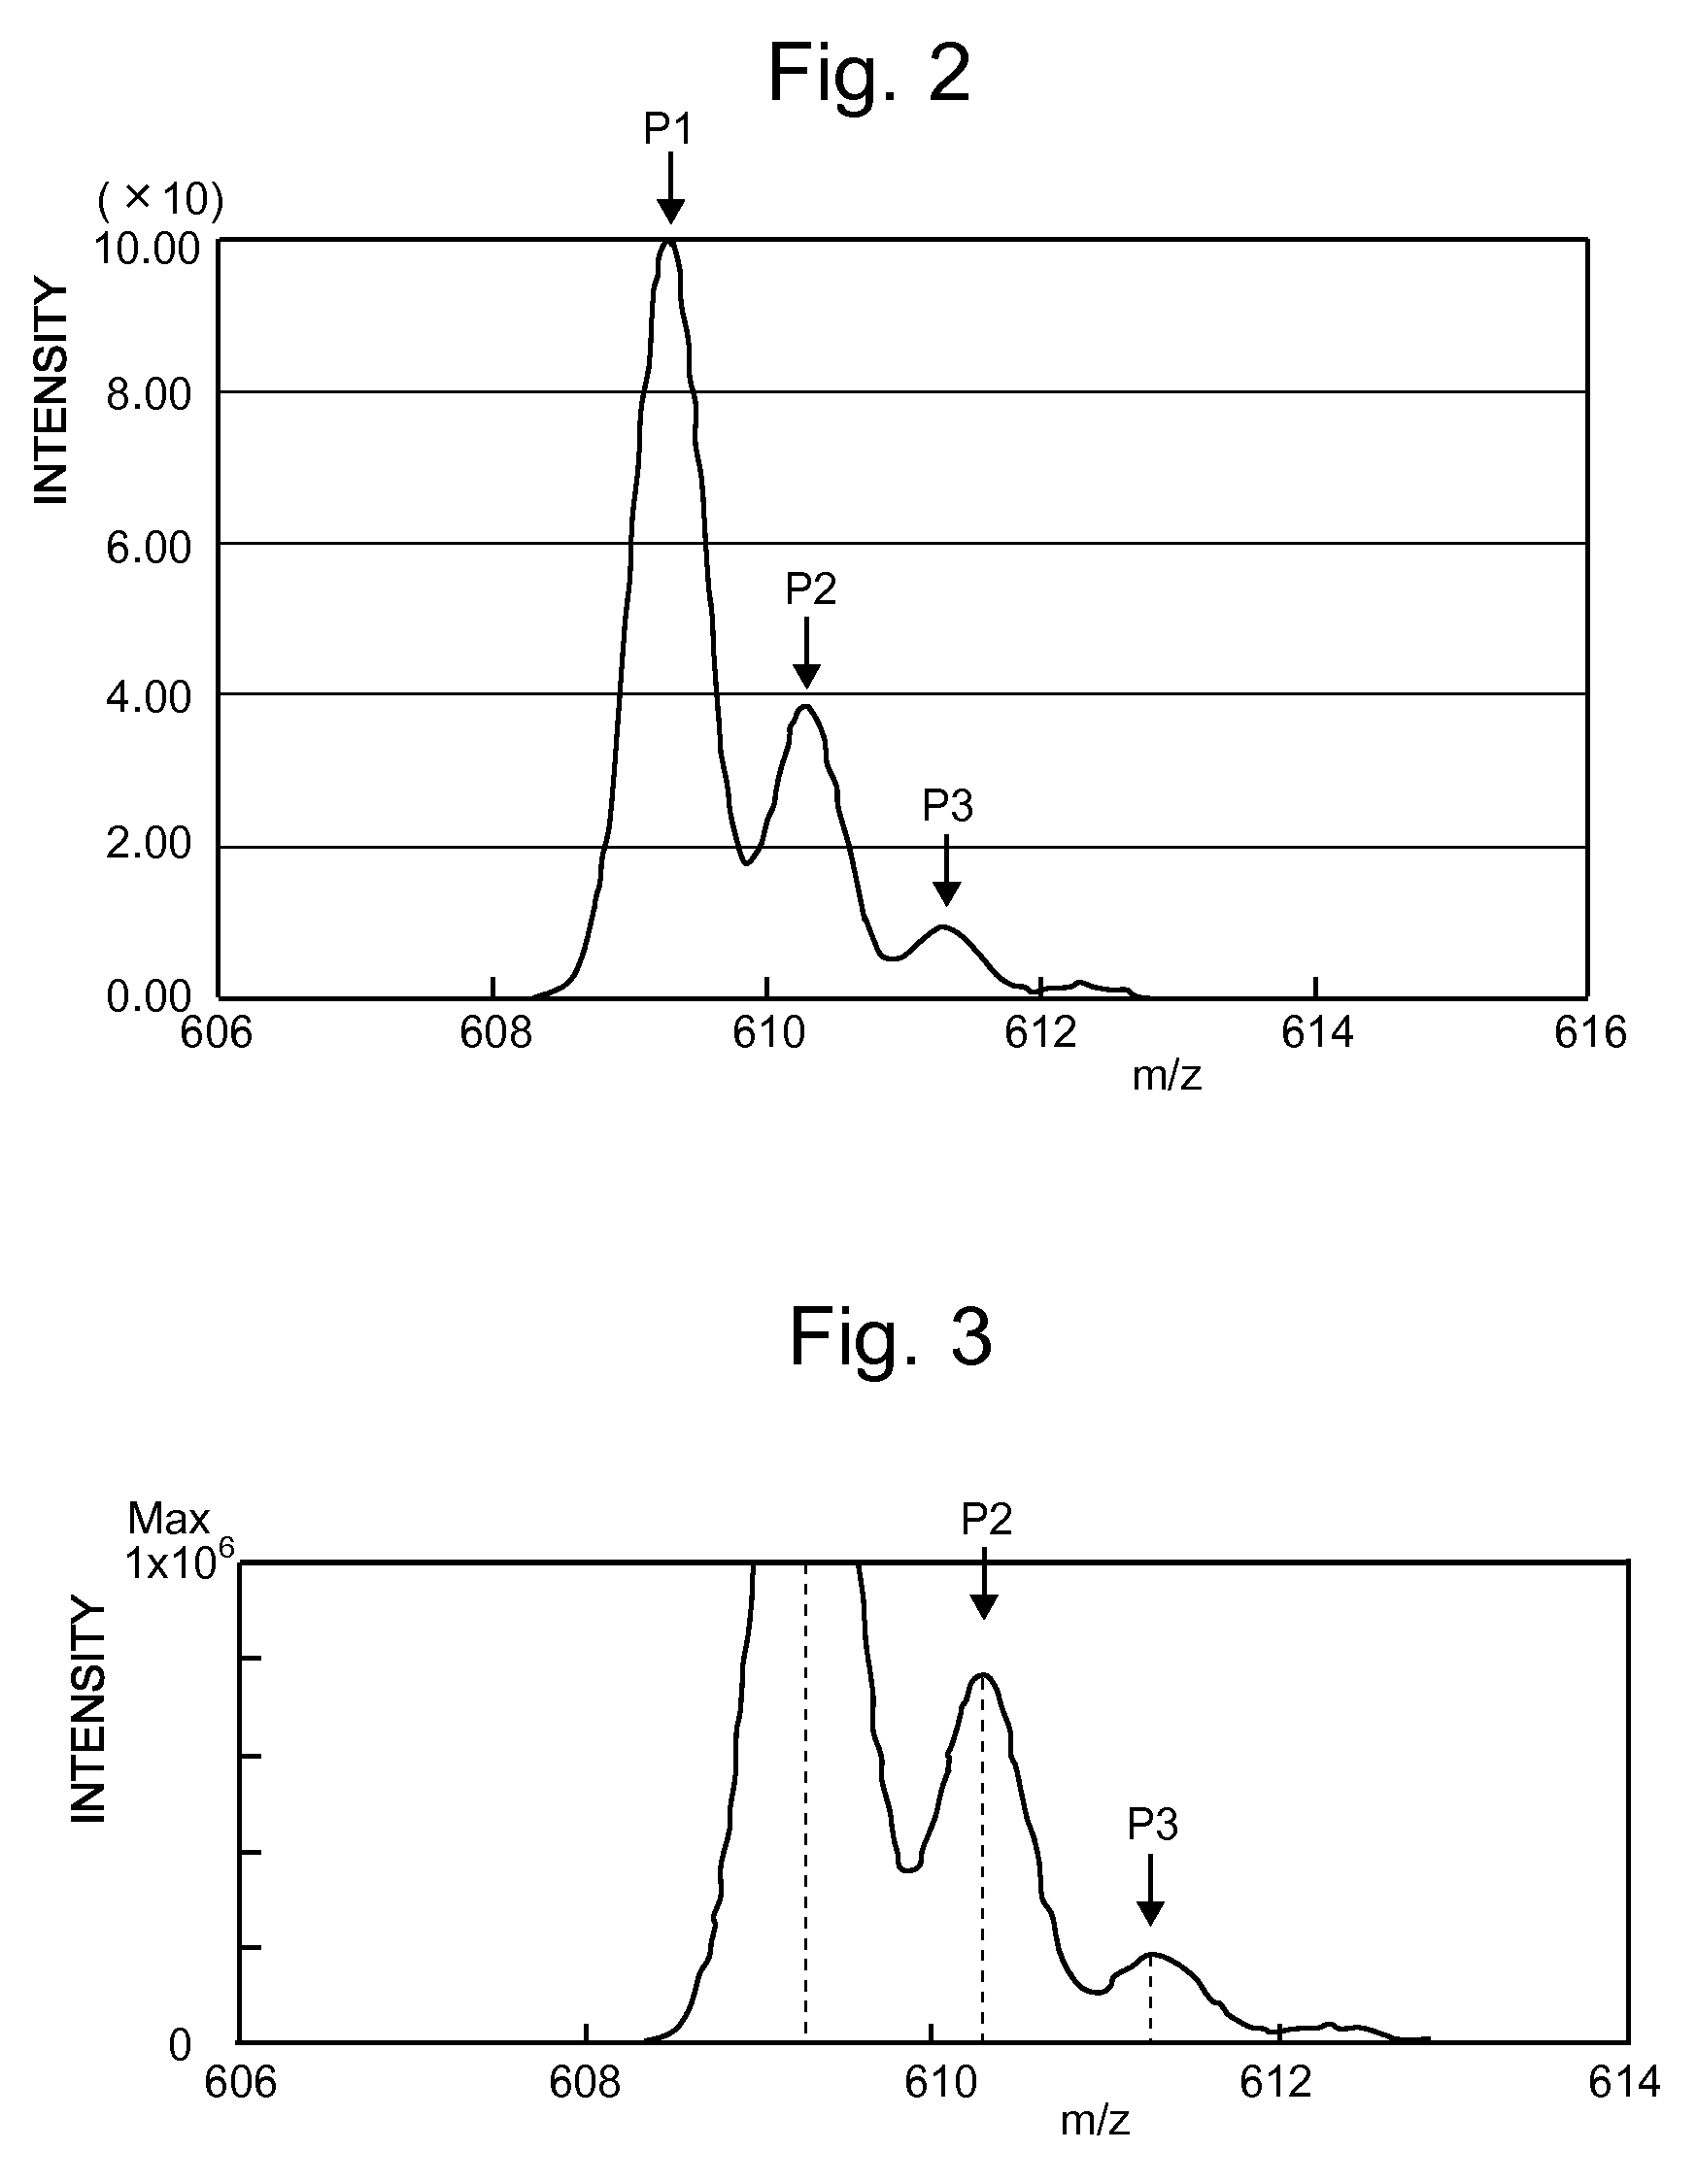
[0033]The principle of the quantitative analysis method according to the present invention is initially described with reference to FIGS. 2 and 3.

[0034]FIG. 2 shows one example of the mass spectrum (profile data) obtained by a mass spectrometry of reserpine (C33H40N2O9) in the positive ionization mode. As shown, a principal peak P1 having the highest ion intensity occurs at m / z 609.3. This principal peak P1 corresponds to the peak of the molecular ion ([M+H]+) of the reserpine composed of only the principal isotopes. Additionally, two subsidiary peaks P2 and P3, which are isotopic peaks of reserpine containing an isotope other than the principal isotopes, are present at m / z 610.3 and m / z 611.3 displaced from the principle peak P1 by 1 Da and 2 Da, respectively.

[0035]The natural isotopic abundance ratios of the constituent elements of reserpine, i.e. carbon (C), hydrogen (H), nitrogen (N) and oxygen (O), are generally known. For example, carbon has two isotopes, 12C and 13C, whose ma...


PUM

PropertyMeasurementUnit
mass spectrometeraaaaaaaaaa
mass-to-charge ratioaaaaaaaaaa
mass-to-charge ratiosaaaaaaaaaa

Abstract

In an MS unit, both an intensity of an ion having the highest intensity among the ions originating from a compound as the target of quantitative determination and an intensity of an isotopic ion are measured. A saturation detector determines whether or not digital data produced by an A / D converter from ion-intensity signals have reached a saturation level. A data selection controller selects the ion-intensity data showing the highest intensity when the signal is not saturated or the intensity data of the isotopic ion when the saturation has occurred or is probable to occur. When the latter data is selected, an ion intensity converter converts the intensity data into values corresponding to the intensity data of the highest-intensity ion by multiplying the intensity data by a factor calculated from a known isotopic abundance ratio.

Description

CROSS REFERENCE TO RELATED APPLICATIONS[0001]This application is a National Stage of International Application No. PCT / JP2011 / 074181, filed on Oct. 28, 2011, the contents of all of which are incorporated herein by reference in their entirety.TECHNICAL FIELD[0002]The present invention relates to a quantitative analysis method for measuring the intensity of an ion originating from a target compound using a mass spectrometer and for determining the quantity of the target compound based on the measured result, as well as a mass spectrometer using this method.BACKGROUND ART[0003]In a mass spectrometer, an ion having a specific mass-to-charge ratio m / z originating from a target compound in a sample is selectively detected and an ion intensity corresponding to the quantity of the ion is obtained. The ion intensity changes depending on the concentration (content) of the target compound. In the case of detecting the ion intensity of the same kind of ion, the higher the concentration of that ...

Claims


Application Information

Patent Timeline
Patent Type & Authority Patents(United States)
IPC IPC(8): G01N27/00G01N30/72H01J49/00H01J49/26
CPCH01J49/0031H01J49/0036H01J49/26G01N30/72
Inventor MUKAIBATAKE, KAZUO
Owner SHIMADZU CORP
Why Eureka
Try Eureka