

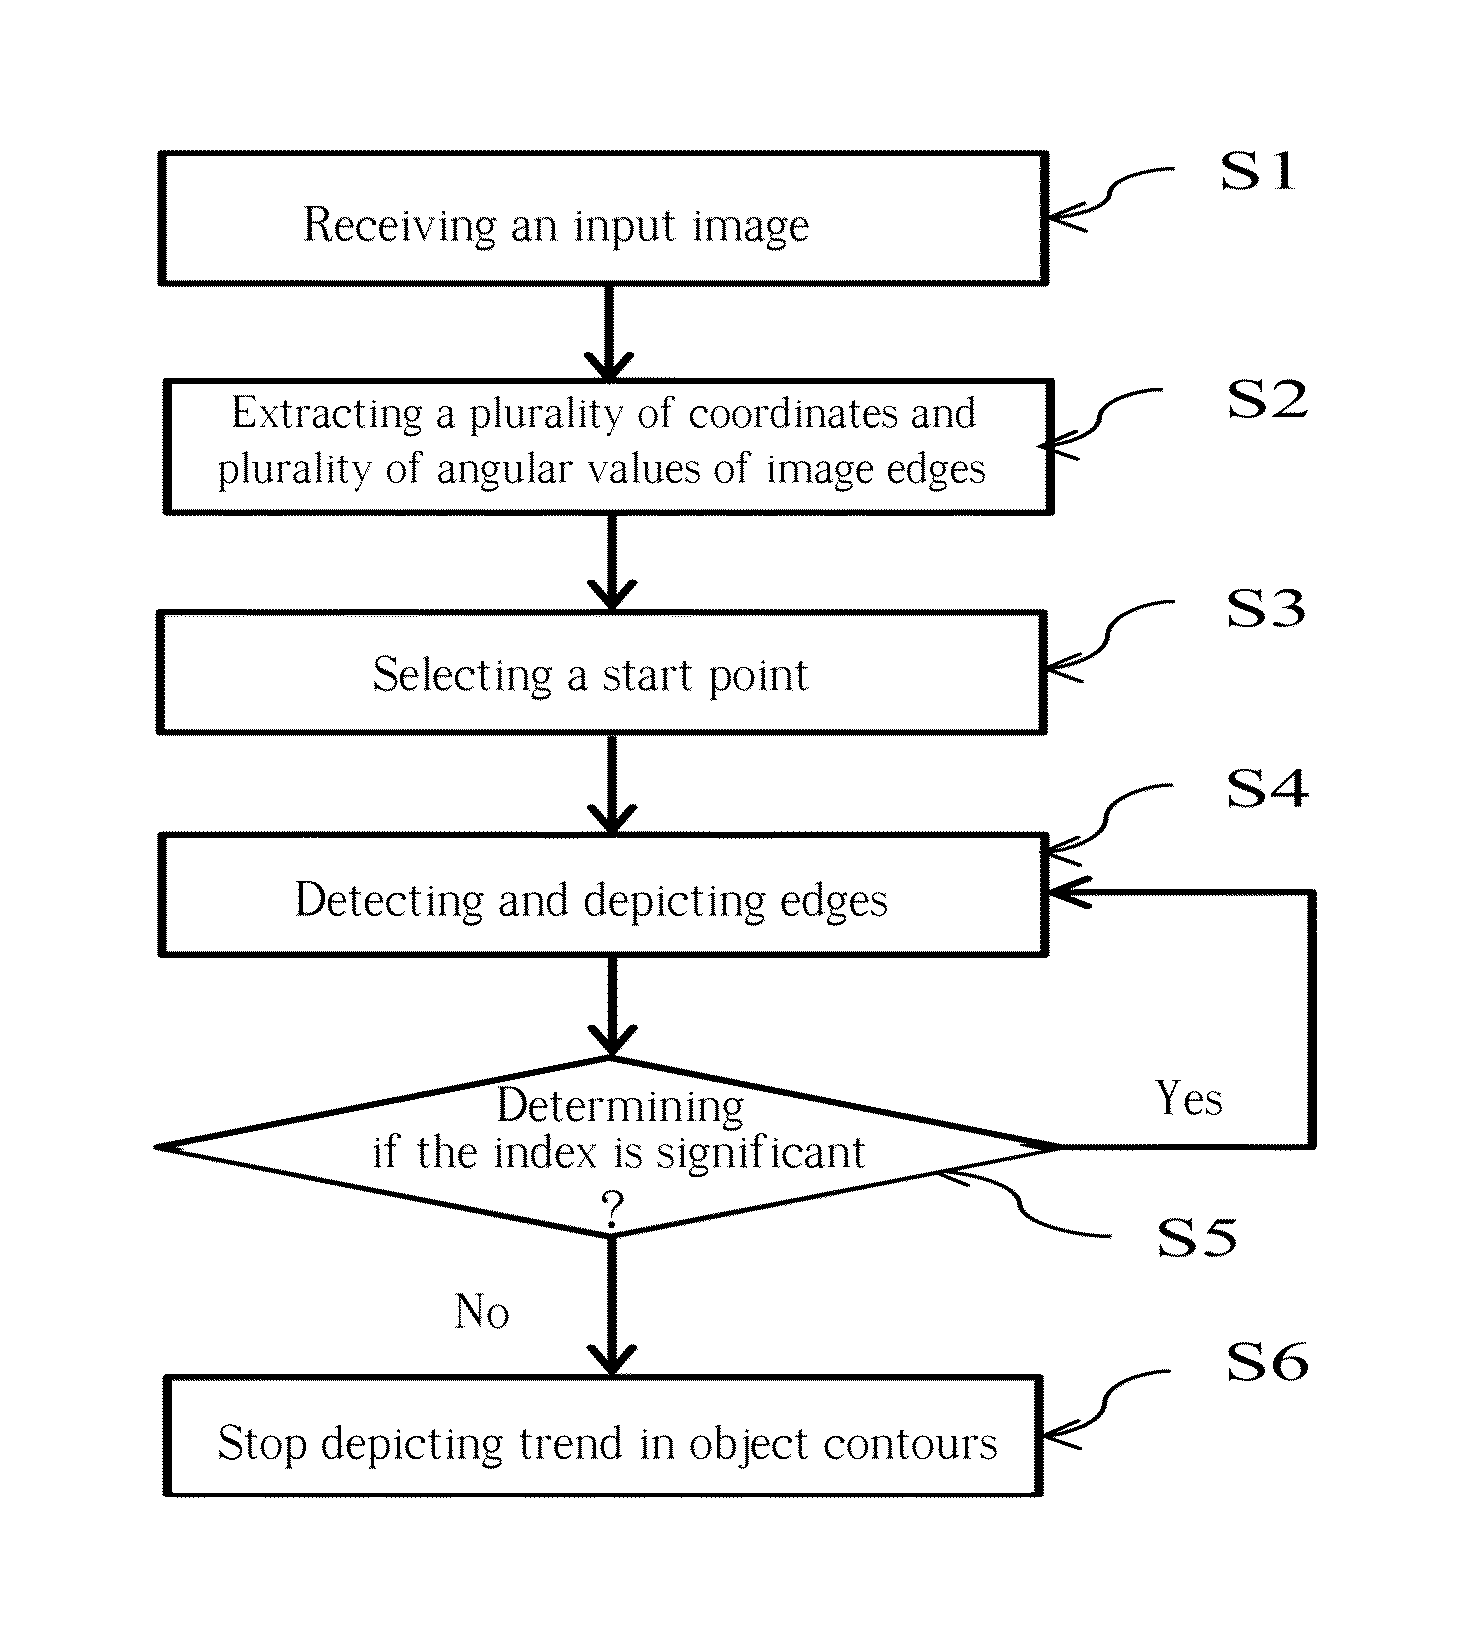
Method for auto-depicting trends in object contours
a technology of object contours and trend detection, applied in image analysis, instruments, computing, etc., can solve the problems of deviation or error, incomplete object contours cannot be created, and subsequent image processing is likely to be worse than expected, so as to improve method reliability, accurately depict edge curvature, and select an angular value
- Summary
- Abstract
- Description
- Claims
- Application Information
AI Technical Summary
Benefits of technology
Problems solved by technology
Method used
Image

Examples
embodiment 1
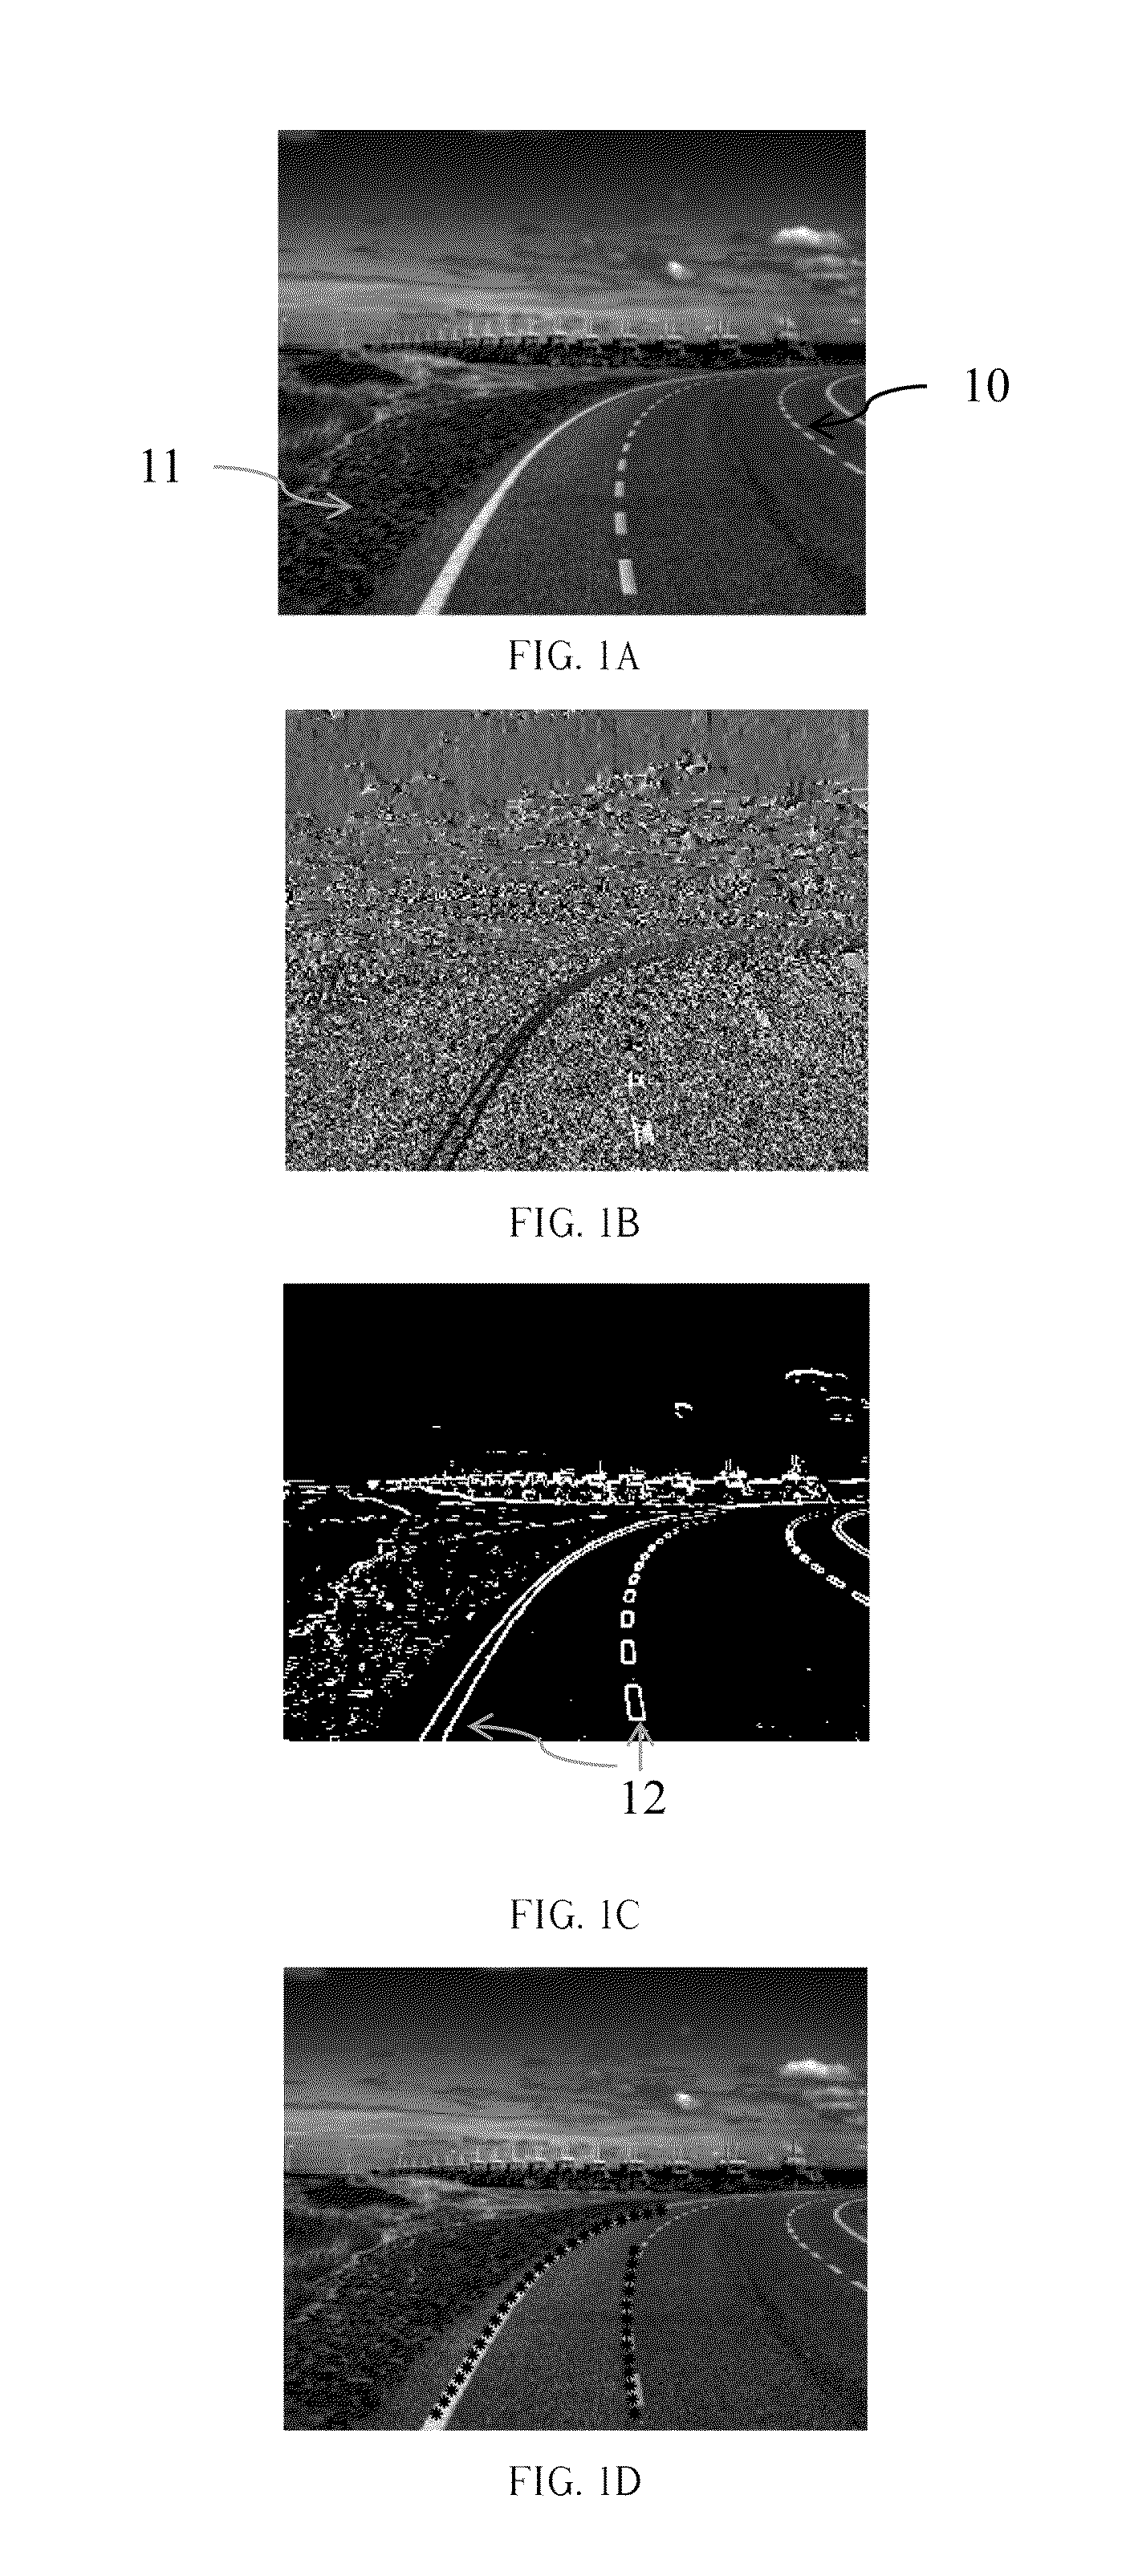
[0047]FIG. 1A is an input image containing a roadway. First, if the input image is a color image, the color image will be converted to a grayscale image. The conversion of the color image to grayscale is performed by using software such as Adobe Photo Shop, Ulead Photo Impact, etc. FIG. 1B and FIG. 1C are an angular value distribution diagram (angular values are indicated by different grayscale values) and an edge detection result (white points indicate the edges) respectively obtained from FIG. 1A through the step S2. The step S2 is to retrieve and extract coordinates and angular values of the image edges by an edge detection method, where the edge detection method may be referred to as a method capable of obtaining gradient information. For example, the edge detection method may employ a conventional edge detection algorithm such as Sobel, Prewitt, Roberts, etc.
[0048]Sobel algorithm is taken as an example of the edge detection method, and the equations for calculating a plurality ...
embodiment 2
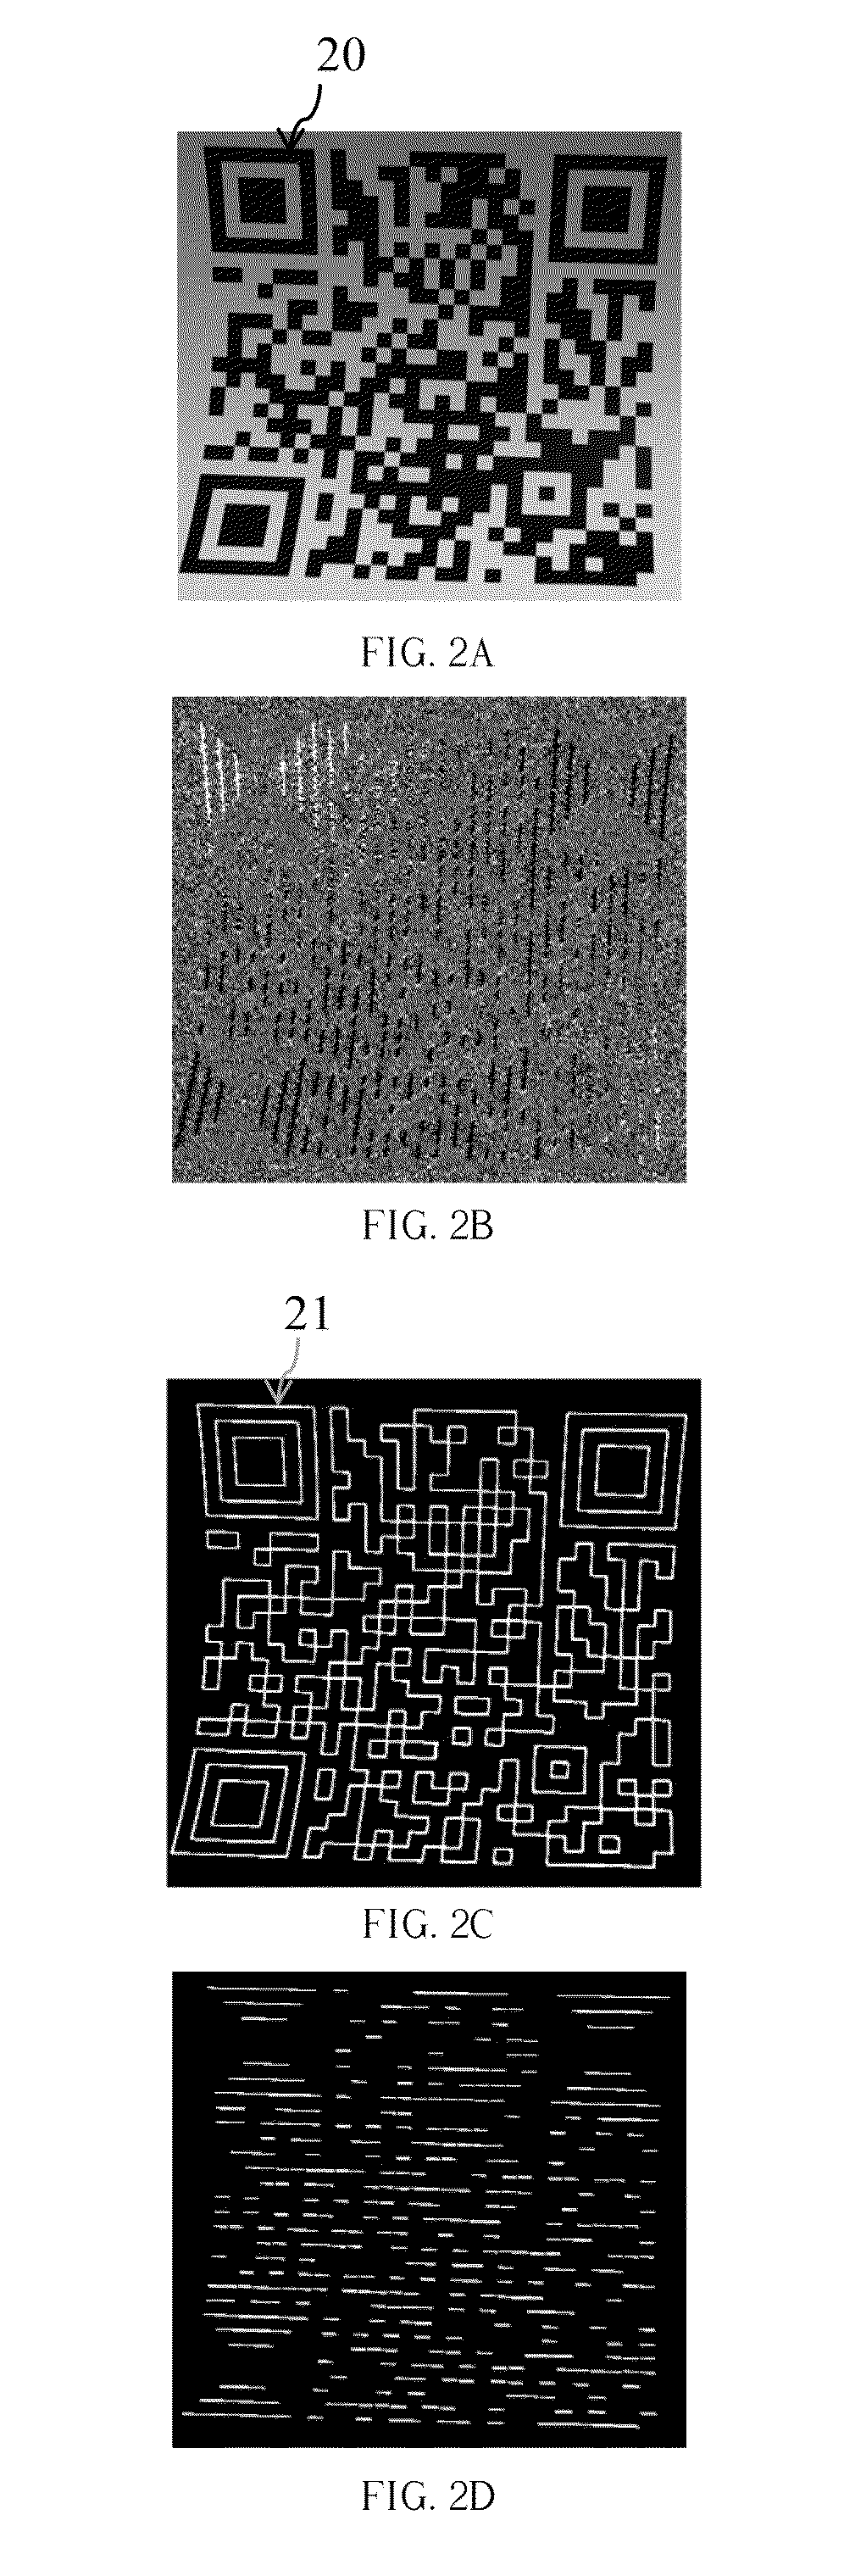
[0077]FIG. 2A is an input image containing a QR code. First, if the input image is a color image, the color image will be converted to a grayscale image. The conversion of the color image to grayscale is performed by using software such as Photo Shop, Photo Impact, etc. FIG. 2B and FIG. 2C are an angular value distribution diagram (angular values are indicated by different grayscale values) and an edge detection result (white points indicate the edges) respectively obtained from FIG. 2A through the step S2. The step S2 is to retrieve and extract coordinates and angular values of the image edges by utilizing an edge detection method, where the edge detection method may be referred to as a method capable of obtaining gradient information. For example, the edge detection method may employ a conventional edge detection algorithm such as Sobel, Prewitt, Roberts, etc.
[0078]Sobel algorithm is taken as an example of the edge detection method, and a plurality of angular values θ and a plural...
PUM
 Abstract
Description
Claims
Application Information