Three-dimensional visualization method for power system real time node data base on rapid space interpolation

A space interpolation and node data technology, applied in the direction of electrical digital data processing, image data processing, special data processing applications, etc., can solve problems such as poor practicality and affecting the visual effect of 3D visualization graphics, so as to ensure real-time performance and improve visual effects and practical effects

Inactive Publication Date: 2008-07-30
TSINGHUA UNIV
View PDF0 Cites 17 Cited by
  • Summary
  • Abstract
  • Description
  • Claims
  • Application Information

AI Technical Summary

Problems solved by technology

[0023] The above three deficiencies have seriously affected the visual effect of the generated 3D visuali...

Method used


Image

  • Three-dimensional visualization method for power system real time node data base on rapid space interpolation
  • Three-dimensional visualization method for power system real time node data base on rapid space interpolation
  • Three-dimensional visualization method for power system real time node data base on rapid space interpolation

Examples


Embodiment Construction

[0041] The three-dimensional visualization method for real-time node data of the power system based on fast spatial interpolation proposed by the present invention is described in detail as follows in conjunction with the accompanying drawings and embodiments:

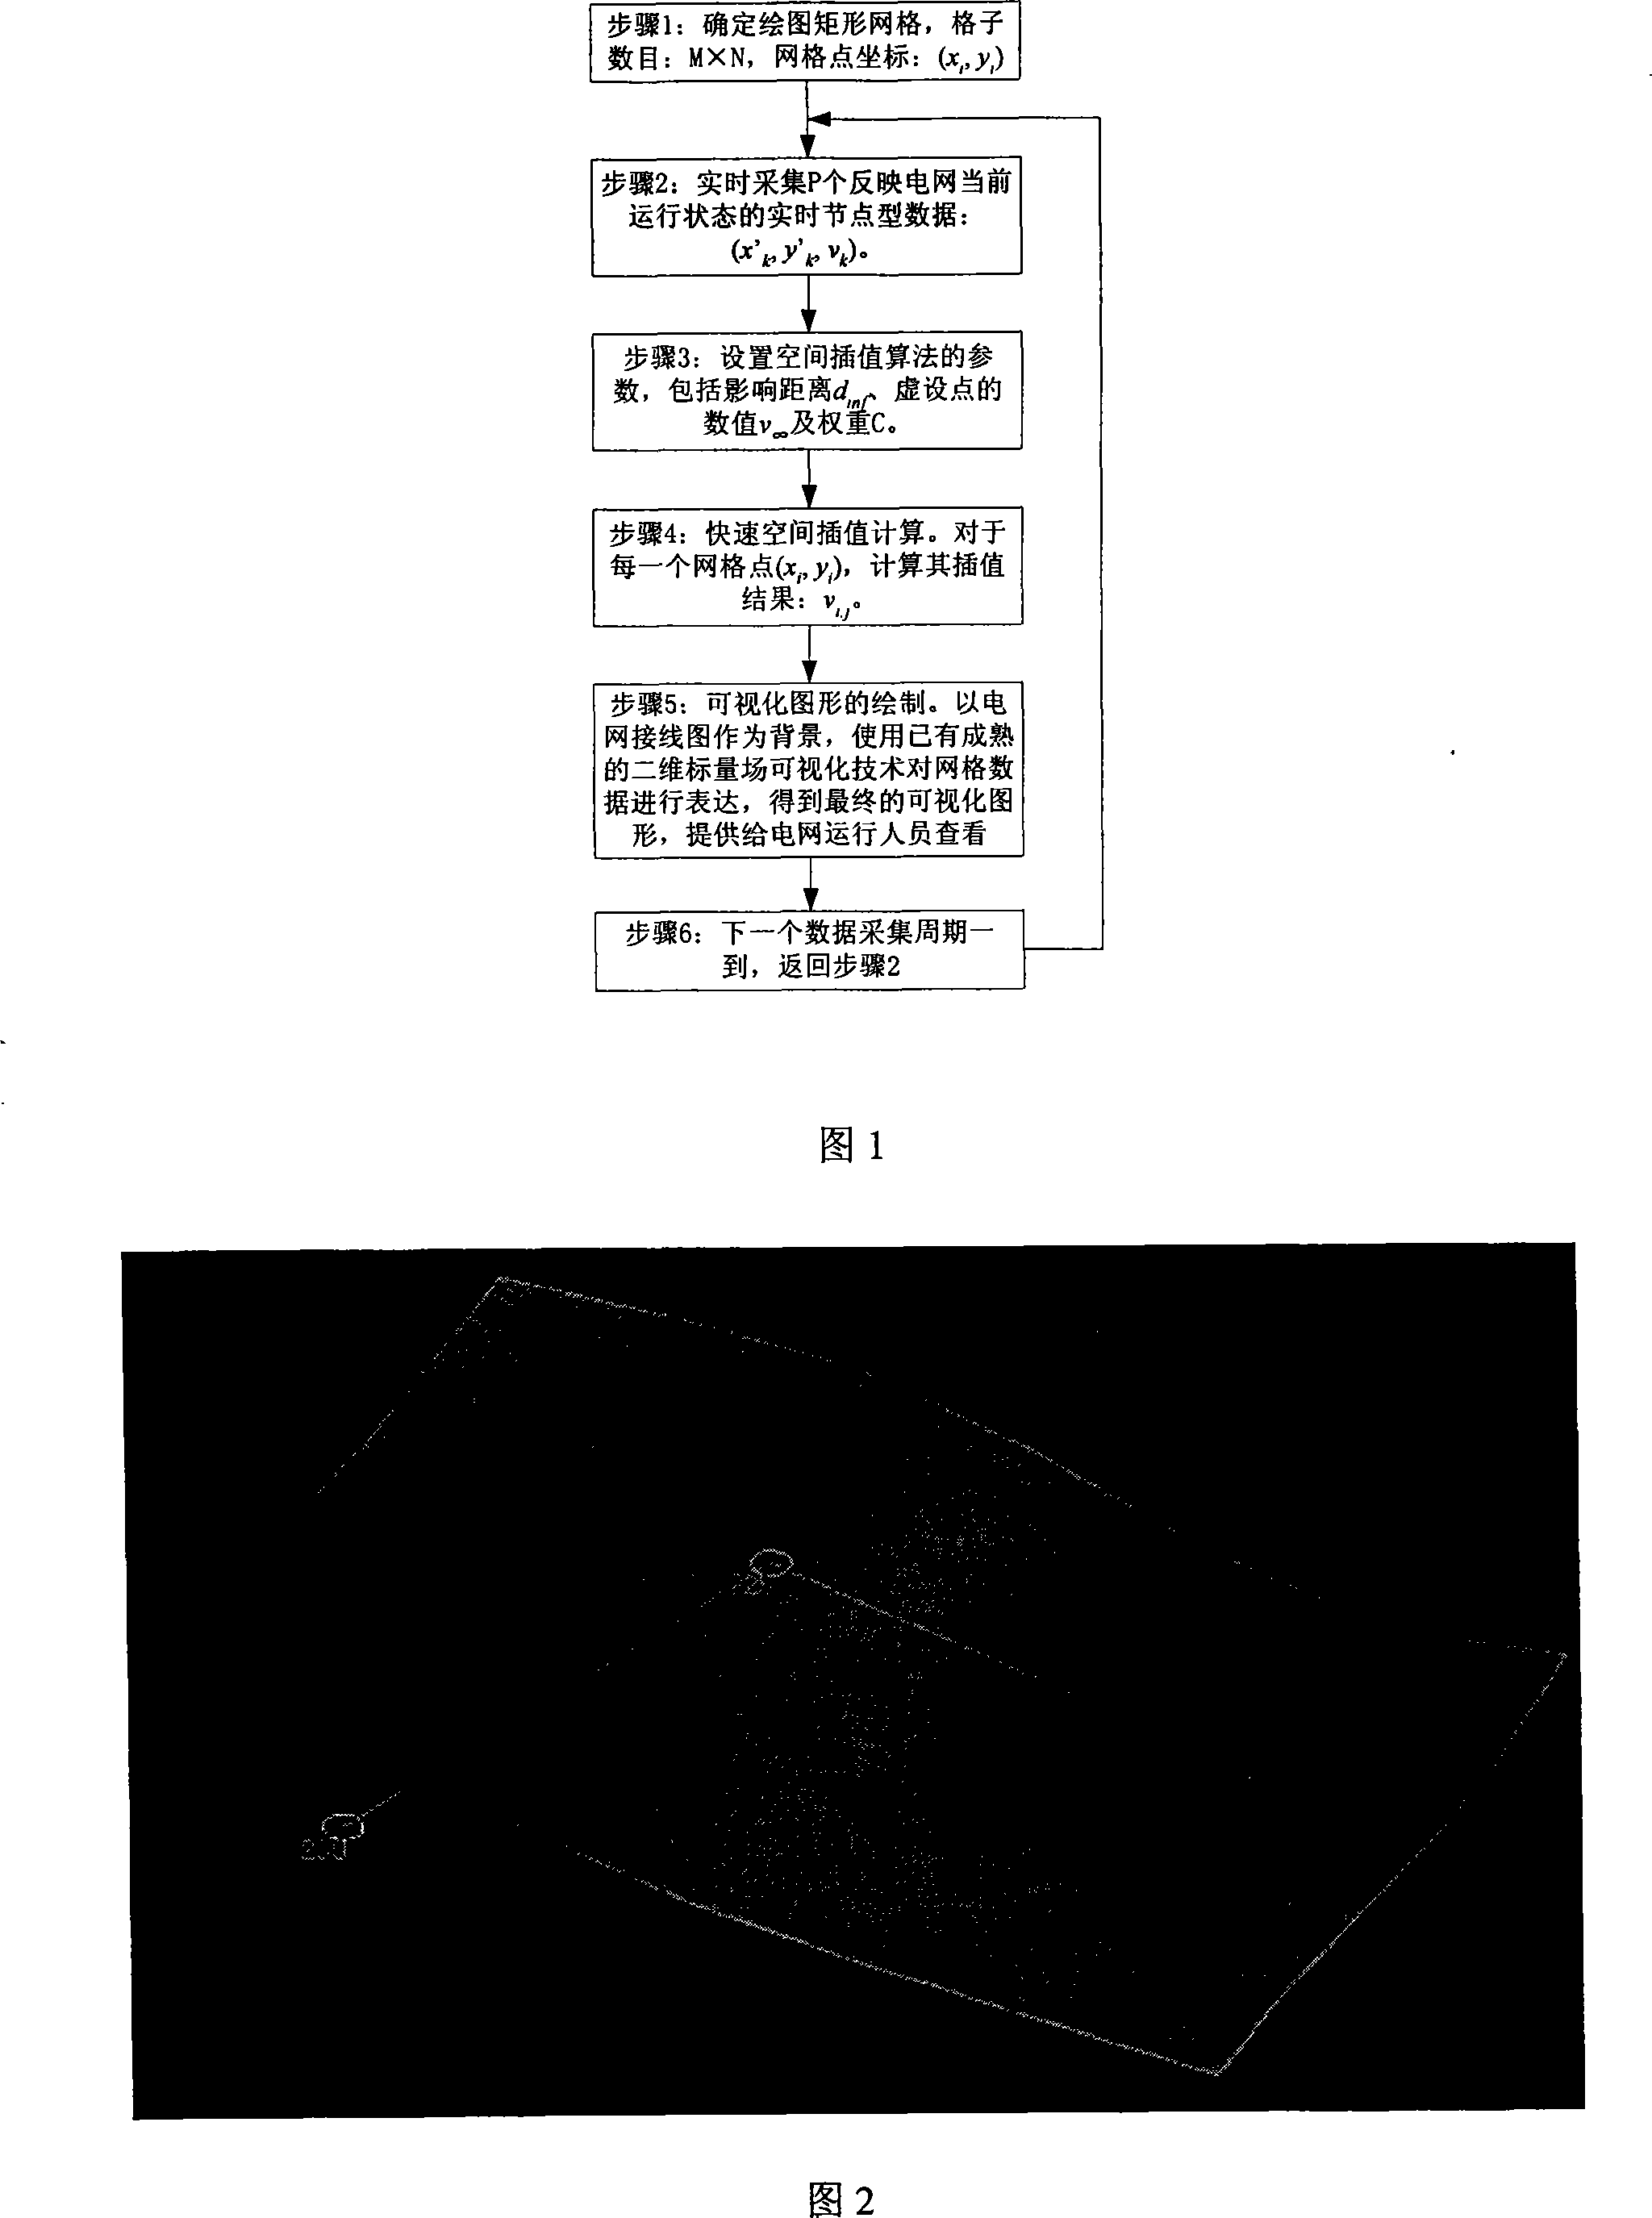
[0042] The three-dimensional visualization method for real-time node data of a power system based on fast spatial interpolation proposed by the present invention, as shown in Figure 1, includes the following steps:

[0043] Step 1) Determine the drawing rectangular grid, including the number of grids in the grid as M × N, and the coordinates of the grid points (x i ,y j ), i=0, 1,..., M, j=0, 1,..., N; where x i =x 0 +iΔx,y j =y 0 +jΔy, Δx>0 and Δy>0 are the grid spacing in the x-axis and y-axis directions, respectively;

[0044] Step 2), at the beginning of a data collection cycle, collect P real-time node-type data reflecting the current operating state of the power grid in real time: (x k ',y k ', v k ), k=1...


PUM


Abstract

The invention relates to a power system real time nodal data three-dimensional visualization method which is based on the fast spatial interpolation, and belongs to the power system three-dimensional visualization techniology field. The method comprises the following steps that: the scale of rectangular grids is determined and drawn; the nodal data in a power network are collected; the parameters of the spatial interpolation algorithm are set; the calculation is carried out through the fast spatial interpolation algorithm; for each grid point (xi, yj), the interpolation result (vi, j) is calculated, the power network wiring diagram is taken as the background, and the two-dimensional scalar field visualization technology is used to express grid data (xi, yj, vi, j), so as to obtain the visual graphic of the real time nodal data, which is used to carry out the real time safety economy monitoring to the power network; while ensuring the rapidity, the invention remarkably improves the visual effect and the practicability of the three-dimensional visual graphic through introducing a dummy average point and modifying the weight coefficient.

Description

technical field [0001] The invention belongs to the technical field of power system 3D visualization (power system 3D visualization), in particular to a method for three-dimensional visualization of real-time node data in a power system based on fast spatial interpolation. Background technique [0002] With the continuous expansion of the scale of the power system, the data generated during the operation of the power system has greatly increased in both types and quantities. In order to conduct real-time security and economic monitoring of large-scale power systems, operators need to pay close attention to various real-time operating data in the power system and distinguish valuable information from them. Therefore, how to display the real-time operation data of the power system more efficiently and intuitively in front of the operator is an energy management system (EMS, Energy Management System), automatic voltage control system (AVC, Automatic Voltage System), wide-area p...

Claims


Application Information

Patent Timeline
IPC IPC(8): G06F17/00G06T15/10
Inventor 孙宏斌陈佳张伯明吴文传郭庆来汤磊
Owner TSINGHUA UNIV
Why Eureka
Try Eureka