

Monitoring system based on J2EE framework and method
A monitoring system and monitored technology, which is applied in transmission systems, hardware monitoring, digital transmission systems, etc., can solve problems such as reducing system performance and heavy server load, so as to speed up development time, improve stability, and reduce post-maintenance costs Effect
- Summary
- Abstract
- Description
- Claims
- Application Information
AI Technical Summary
Problems solved by technology
Method used
Image

Examples
Embodiment 1
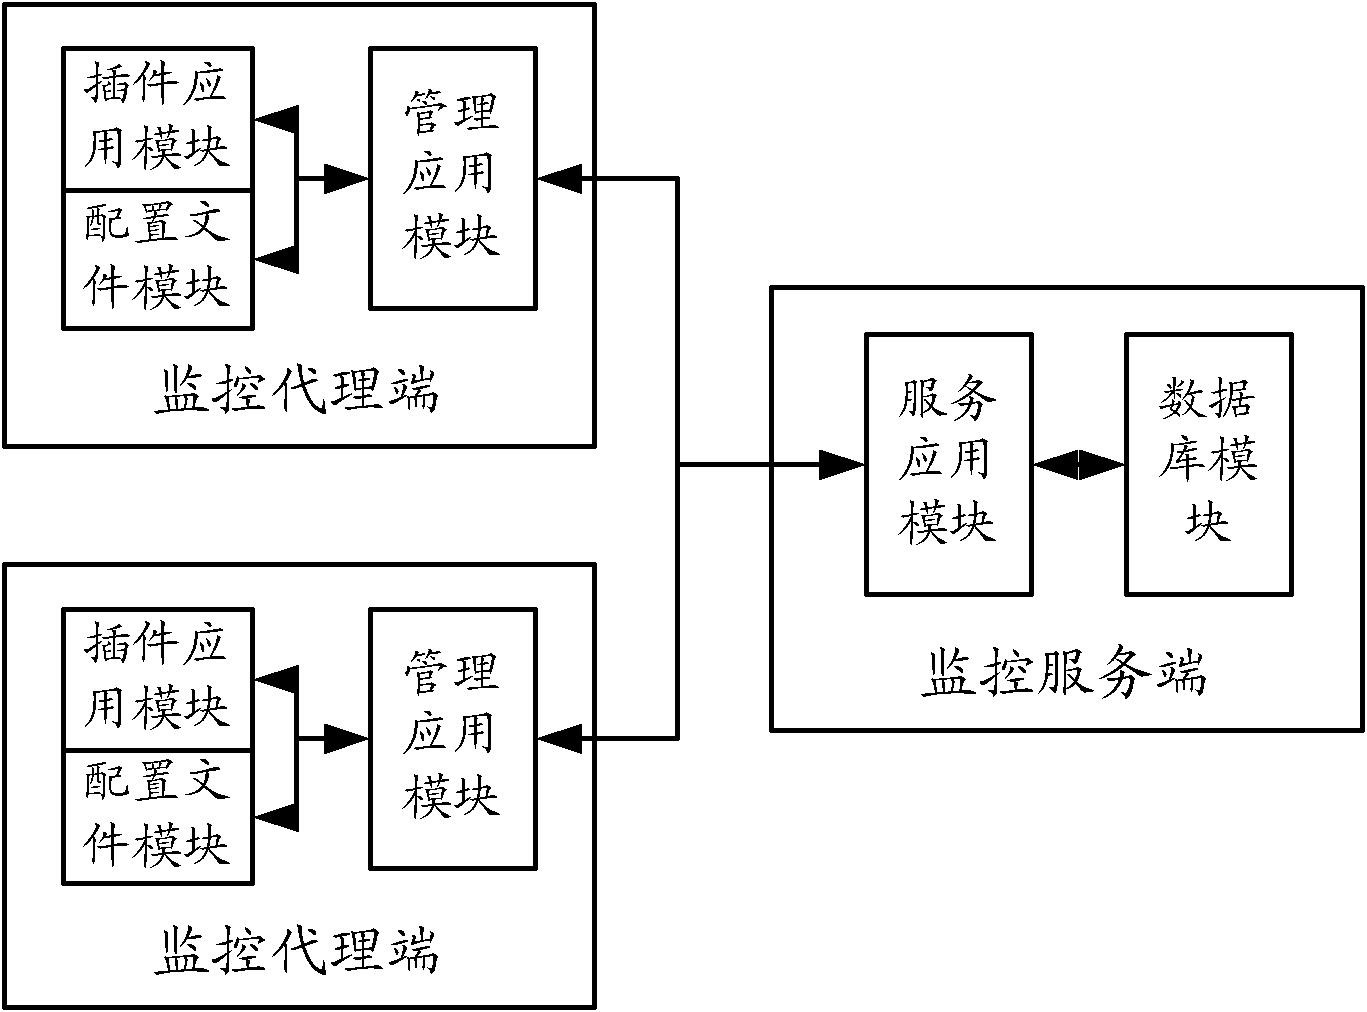
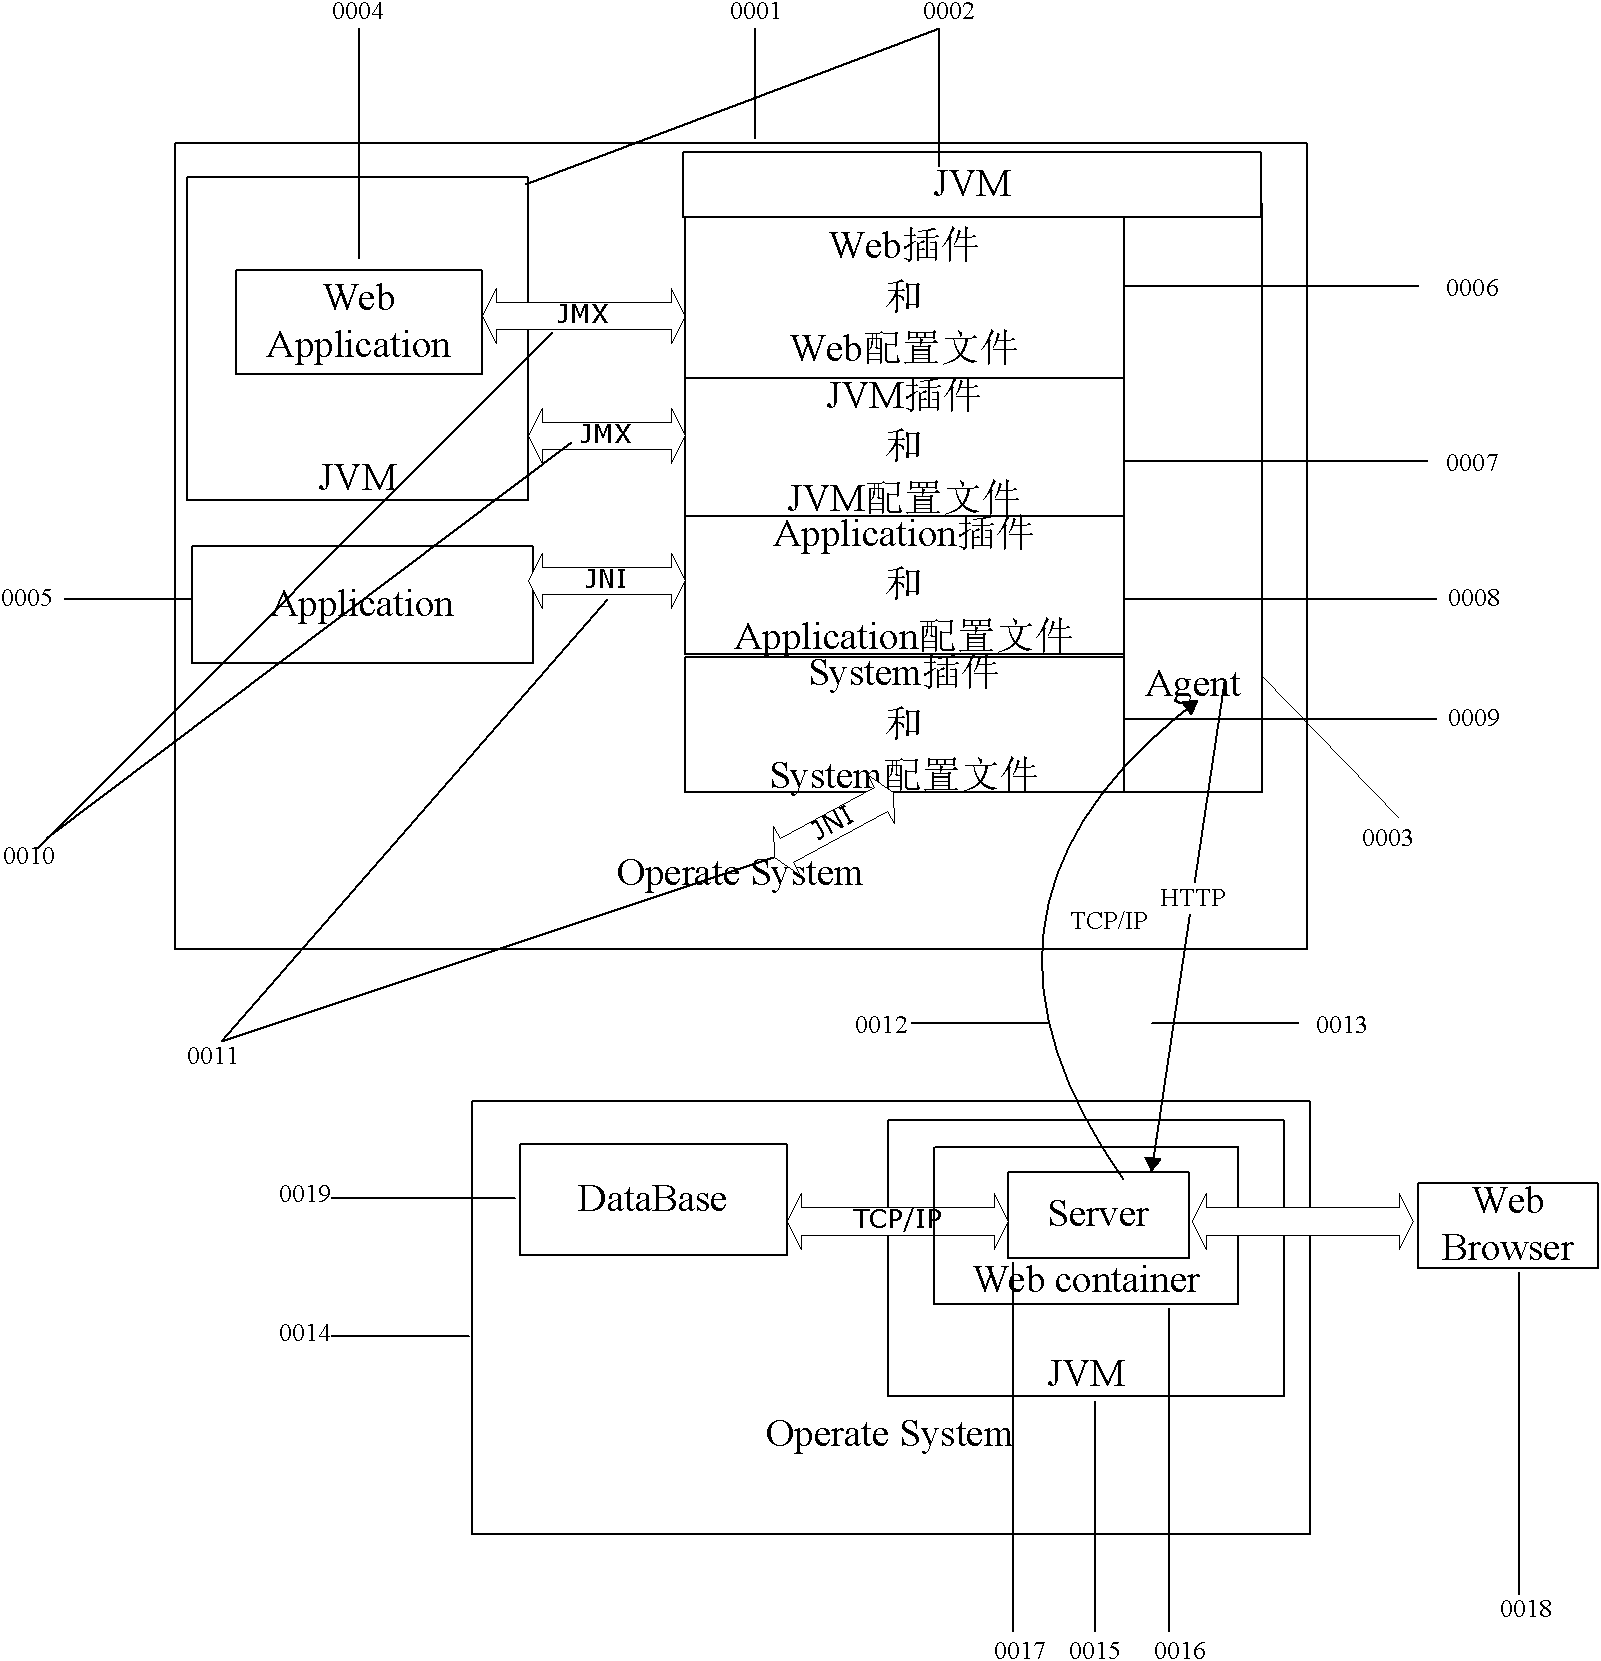
[0026] Please refer to figure 1 , the monitoring system based on the J2EE architecture in this embodiment includes: a monitoring agent set on the monitored device and a monitoring server set on the J2EE WEB container; there are two monitoring agents in the figure. Set at least one plug-in and a corresponding plug-in configuration file on the monitoring agent, and obtain relevant data of the monitored device through the plug-in. The plug-in on the monitoring agent can obtain the relevant data of the monitored device through at least one of the following methods: JMX, JNI, RMI. Control instructions and data can be exchanged between the monitoring agent and the monitoring server. For example, the monitoring agent can monitor instructions and data sent by the monitoring server by starting a Socket port.
[0027] The monitoring server is used to register and manage the monitoring agent, and analyze and process the received data about the monitored device.
[0028] The monitoring ...
Embodiment 2
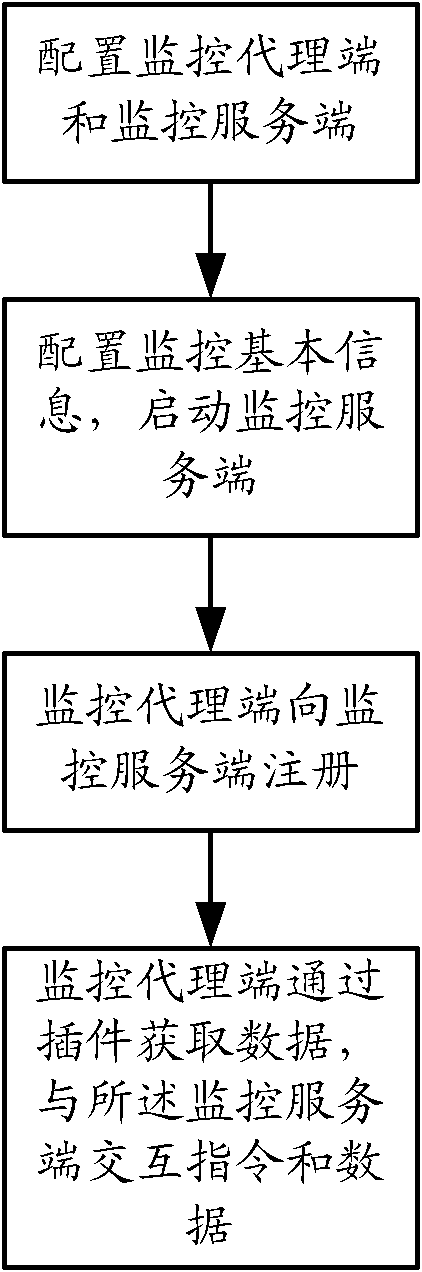
[0032] Please refer to figure 2 , the monitoring method based on J2EE framework in the present embodiment, comprises following process:
[0033] Step 1, configure the monitoring agent on the monitored device, and configure the monitoring server on the J2EE WEB container;
[0034] Step 2, configure the monitoring basic information on the monitoring server, and start the monitoring server;
[0035] Step 3, the monitoring agent registers with the monitoring server, loads or configures the plug-in and the corresponding plug-in configuration file according to the instructions and data of the monitoring server, and feeds back the basic information of the monitoring agent to the monitoring server; The information sent by the monitoring server can be transmitted through the HTTP protocol, and the information sent by the monitoring server to the monitoring agent can be transmitted through the TCP / IP protocol;
[0036] Step 4: The monitoring agent obtains the relevant data of the mon...
PUM
 Abstract
Description
Claims
Application Information