Diagnosing and monitoring depression disorders based on multiple biomarker panels
A technology of biomarkers and depression, applied in biological testing, biochemical equipment and methods, microbiological determination/inspection, etc., can solve problems such as inaccurate diagnosis, insufficient dose of antidepressants, and suboptimal treatment results
- Summary
- Abstract
- Description
- Claims
- Application Information
AI Technical Summary
Problems solved by technology
Method used
Image
Examples
Embodiment 1
[0114] Example 1 - Diagnostic Markers for Depression
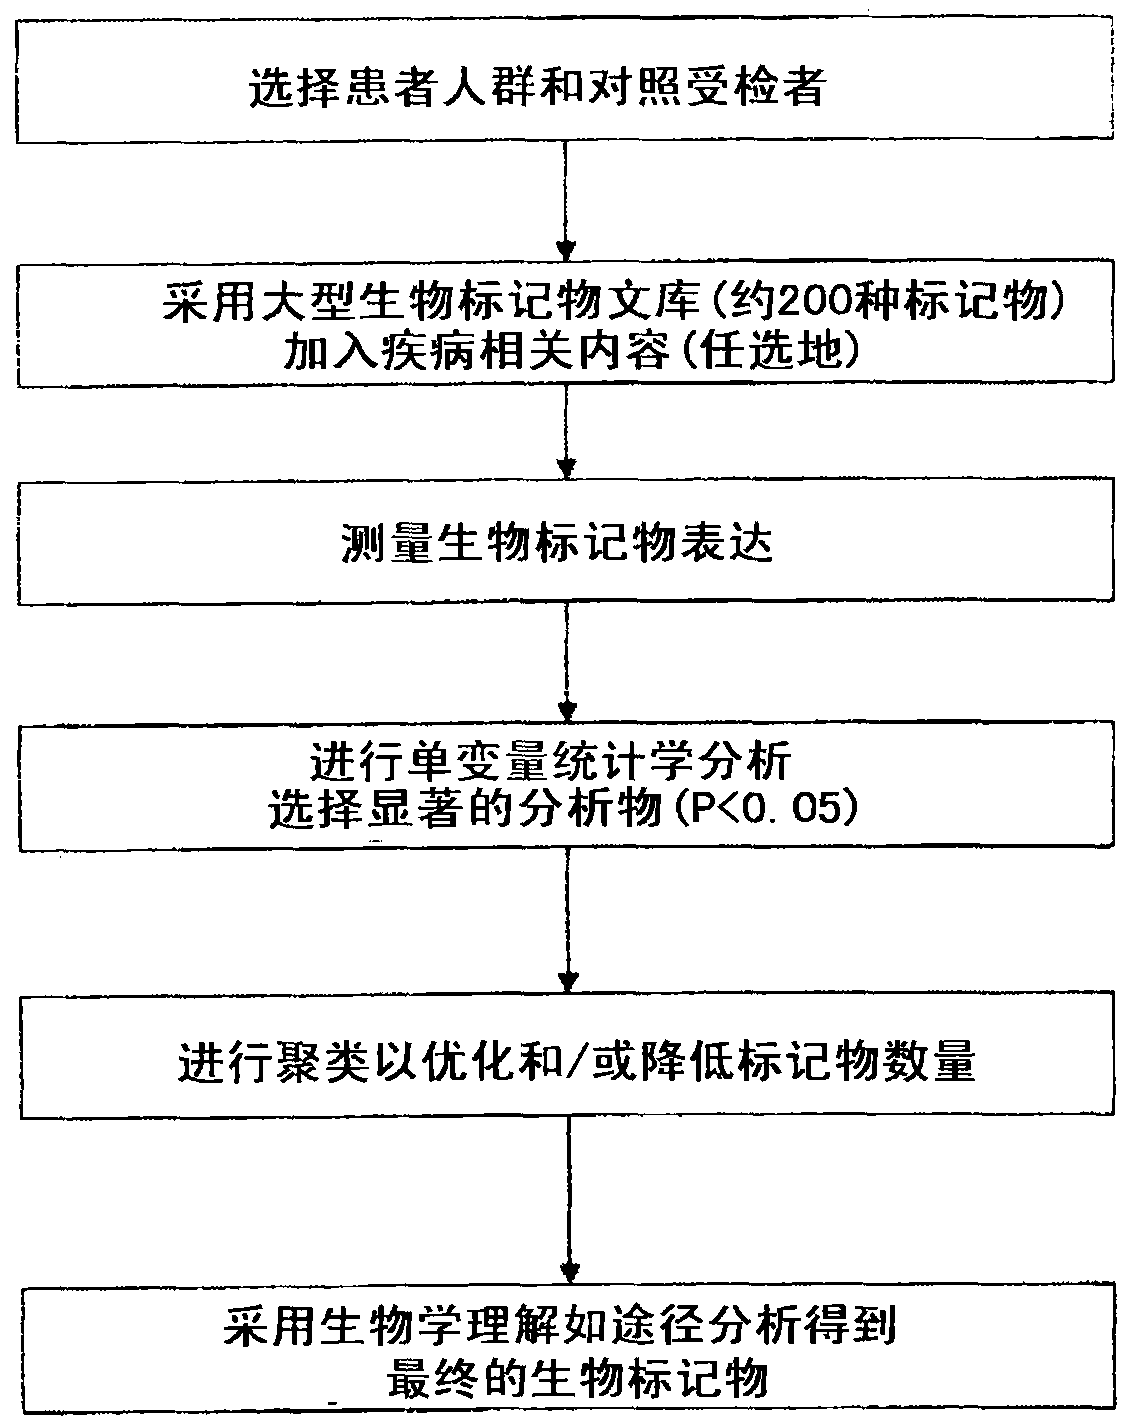
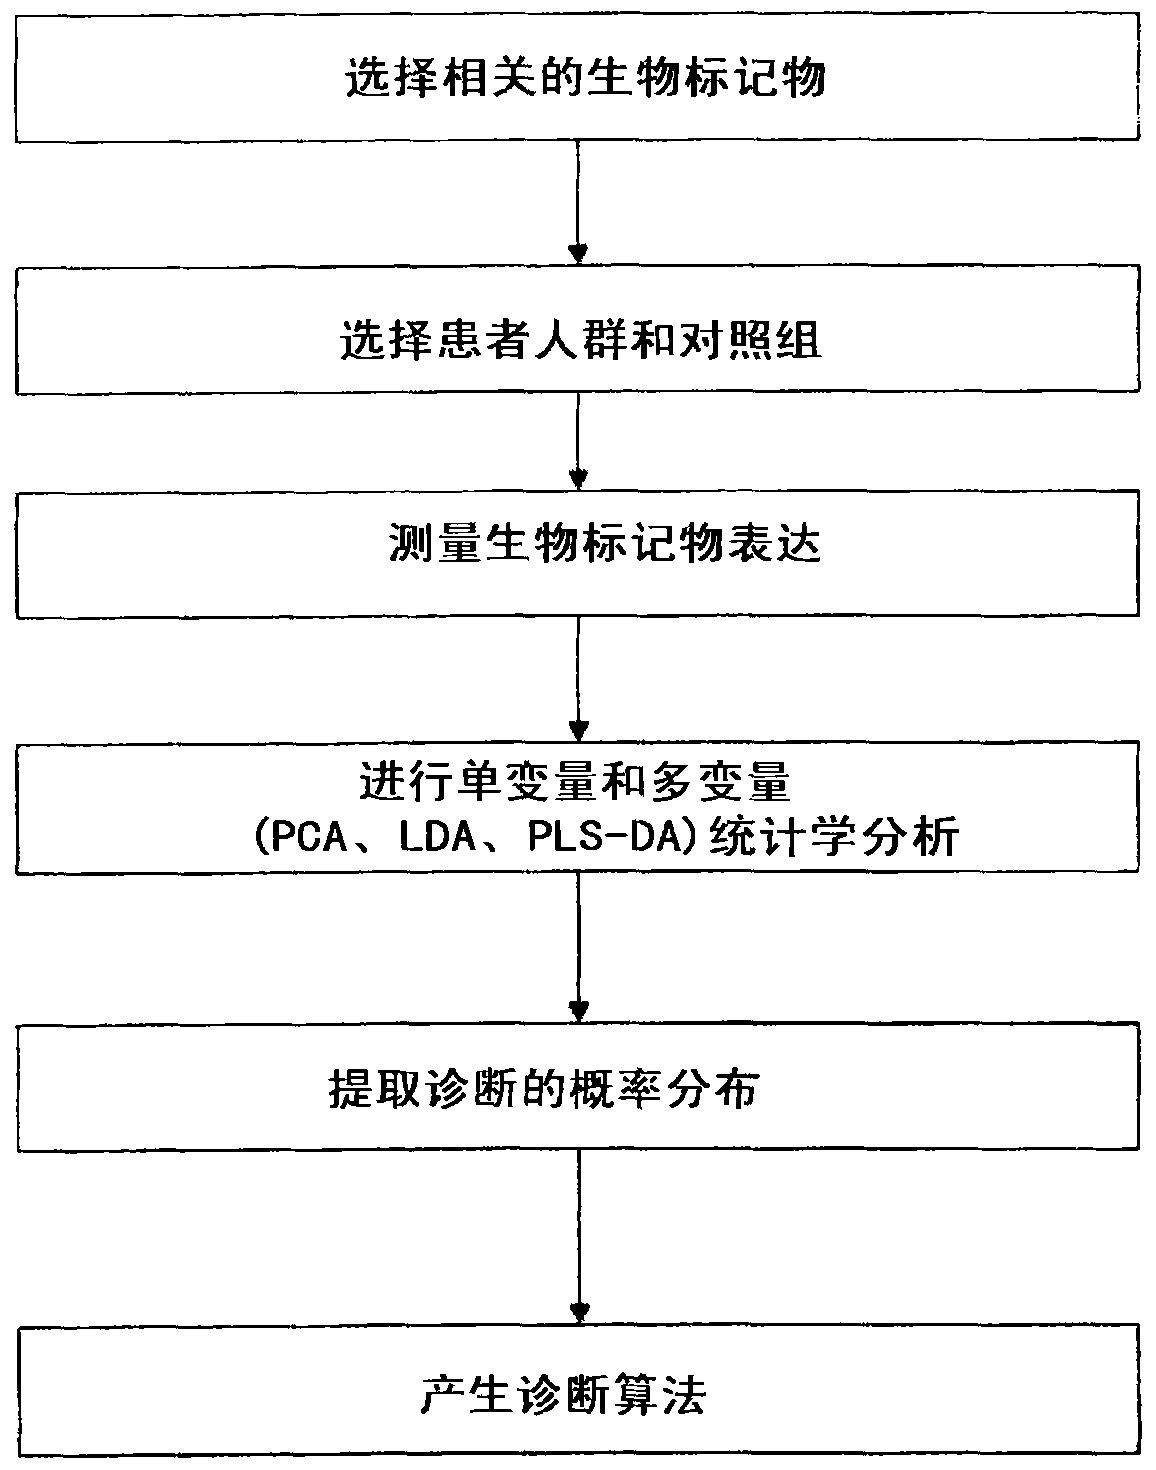
[0115] The methods provided herein were used to develop an algorithm for determining a depression score that can be used to diagnose or determine the predisposition to MDD, and to evaluate a subject's response to antidepressant treatment. Characterization of molecular correlates of depression using a multiplex assay system. Three statistical approaches were used for biomarker evaluation and algorithm development: (1) univariate analysis examining the distribution of biomarkers associated with MDD; and (2) linear discriminant analysis (LDA) and (3) for the algorithm Constructed binary logistic regression.
[0116] Univariate analysis of individual analyte levels: Serum levels of each analyte were determined using Luminex multiplex technology and compared between depressed patients and normal subjects using "Student" t-test. The significance level was set at α≤0.05. Univariate analysis explores each variable in the data...
Embodiment 2
[0125] Example 2 - Selection of multiplex biomarkers for MDD
[0126] Serum levels of approximately 100 analytes were determined using the Luminex multiplex technique using the "Student" t-test. The data were then analyzed for comparison between depressed and normal subjects. The significance level was set at α≤0.05. Following preliminary studies, the analytes listed in Table 1 were selected based on statistical significance. This is followed by multivariate analysis (PCA, PLS-DA, LDA) to identify markers that can be used to differentiate MDD patients from the normal population.
[0127] Table 1 lists 18 biomarkers and shows the nature of each analyte's potential relationship to the pathophysiology of unipolar depression.
[0128] Table 1
[0129]
[0130] The potential relevance of each marker to MDD is discussed further here.
Embodiment 3
[0131] Example 3 - Using Algorithms to Calculate MDD Score and Evaluate Treatment
[0132] Using 16 of the markers listed in Table 1 and ACTH, a diagnostic score was established based on the following algorithm:
[0133] Depression diagnostic score = f(a1*analyte 1+a2*analyte 2+a3*analyte 3+a4*analyte 4+a5*analyte 5+a6*analyte 6+a7*analyte 7+a8* Analyte 8+a9*Analyte 9+a10*Analyte 10+a11*Analyte 11+a12*Analyte 12+a13*Analyte 13+a14*Analyte 14+a15*Analyte 15+a16*Analyte 16+a17*ACTH)
[0134] Using this algorithm, a depression score per unexamined subject was assigned.
[0135] Using five of the markers listed in Table 1 (A2M, BDNF, IL-10, IL-13, and IL-18), a statistically plausible diagnostic score was established based on the following algorithm:
[0136] Depression diagnostic score = f(a1*A2M+a2*BDNF+a3*IL-10+a4*IL-13+a5*IL-18)
[0137] In practice, a small set of biomarkers is sufficient to aid in the diagnosis and treatment monitoring of MDD, with or without additiona...
PUM
 Abstract
Description
Claims
Application Information
 - R&D
- Intellectual Property
- Life Sciences
- Materials
- Tech Scout
- Unparalleled Data Quality
- Higher Quality Content
- 60% Fewer Hallucinations
Browse by: Latest US Patents, China's latest patents, Technical Efficacy Thesaurus, Application Domain, Technology Topic, Popular Technical Reports.
© 2025 PatSnap. All rights reserved.Legal|Privacy policy|Modern Slavery Act Transparency Statement|Sitemap|About US| Contact US: help@patsnap.com


