
A method and system for image fusion quality assessment

A quality assessment and image fusion technology, applied in the field of computer vision, to achieve good versatility and easy implementation.

Active Publication Date: 2015-11-04
TSINGHUA UNIV +1
View PDF2 Cites 0 Cited by
  • Summary
  • Abstract
  • Description
  • Claims
  • Application Information

AI Technical Summary

Problems solved by technology

[0007] In summary, there is no performance evaluation method for multi-source image fusion based on human eye attention mechanism in the prior art

Method used


Image

  • A method and system for image fusion quality assessment
  • A method and system for image fusion quality assessment
  • A method and system for image fusion quality assessment

Examples


Embodiment 1

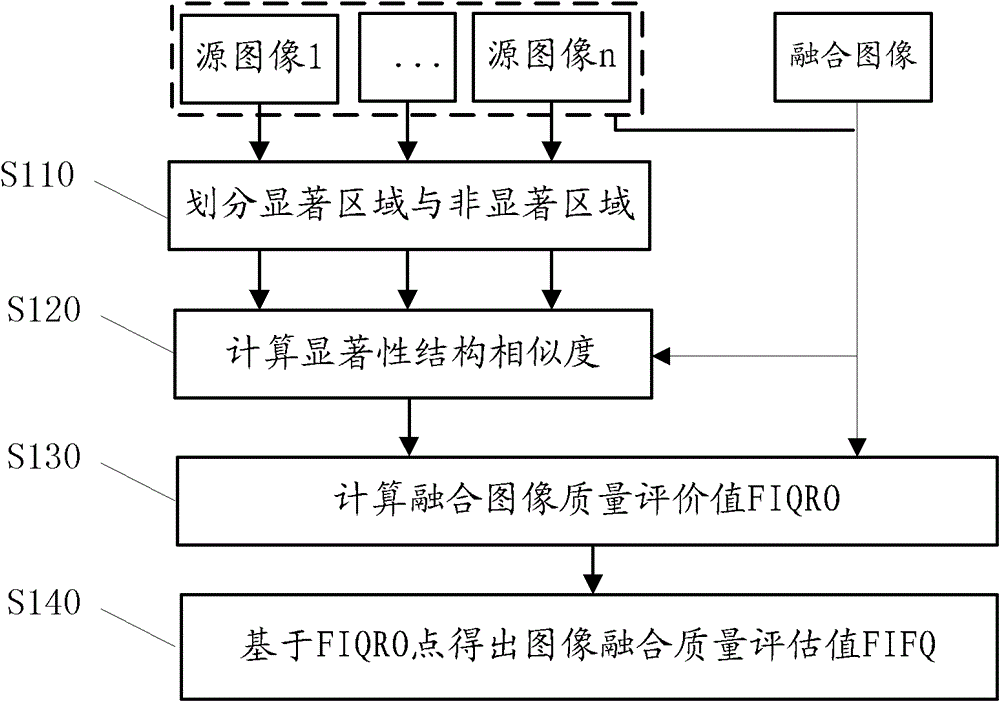
[0037] figure 1 It is a flow chart of the image fusion quality assessment method according to Embodiment 1 of the present invention, refer to below figure 1 Each step of the method is described in detail.

[0038] Step S110, for each source image X of the fused image i (i is a natural number less than or equal to the total number of source images corresponding to the fused image) to divide salient areas and non-salient areas.

[0039] Preferably, before the salient area and the non-salient area are divided, the saliency of each source image itself should be detected first. Salient regions are local regions that have less similarity in global comparison. In order to meet the non-single-point characteristics of the visual system, for each pixel point, the surrounding neighborhood blocks are used to represent the pixel point, and then the significance of the point is determined by comparing the difference between the neighborhood block and the rest of the neighborhood blocks. s...

Embodiment 2

[0076] Figure 6 It is a schematic structural diagram of an image fusion quality assessment system according to Embodiment 2 of the present invention, according to the following Figure 6 Describe in detail the composition of the system.

[0077] The system includes the following units:

[0078] The area division unit divides each source image of the fused image into a salient area and a non-salient area.

[0079] a similarity calculation unit, which, for each of the source images, calculates the structural similarity value between the fusion image and the salient region of the source image and the structural similarity between the fusion image and the non-salient region of the source image value.

[0080] an evaluation value calculation unit for calculating, for each of the source images, a fused image between the fused image and the source image based on the structural similarity value of the salient region and the structural similarity value of the non-salient region of ...


PUM


Abstract

The present invention discloses a performance evaluation method and system for fused images. The method includes the following steps: a region division step, which divides each source image into a salient region and a non-remarkable region; a similarity calculation step, which calculates the fused image The structural similarity value between the salient area of ​​the source image and the structural similarity value between the fusion image and the non-salient area of ​​the source image; the evaluation value calculation step, according to the structural similarity value of the salient area of ​​the source image Structural similarity value and the structural similarity value of the non-significant region, calculating the fused image quality evaluation value FIQRO between the fused image and the source image; the quality evaluation step, based on the calculated value obtained by the evaluation calculation step The fusion image quality evaluation value FIQRO of each source image is calculated to calculate the image fusion quality evaluation value FIFQ. The invention enables the evaluation result to be based on the visual attention mechanism of the human eye, which is more consistent with the human eye evaluation, and the evaluation result is more real and accurate.

Description

technical field [0001] The present invention relates to the field of computer vision, in particular to the field of image fusion, in particular to a method and system for evaluating the quality of multi-source image fusion based on saliency analysis. Background technique [0002] Information fusion theory and technology are becoming research hotspots in the field of information and signal processing, and image fusion, as an important field of information fusion, has been widely used in remote sensing, computer vision, medicine, military target detection and recognition and other fields, the so-called image fusion It refers to combining the information of two or more source images to obtain a more accurate, comprehensive and reliable image description of the same scene. [0003] In order to compare different fusion schemes or improve a certain fusion algorithm, it is necessary to evaluate the fusion performance. These include subjective or objective evaluation criteria. Sin...

Claims


Application Information

Patent Timeline
Patent Type & Authority Patents(China)
IPC IPC(8): G06T7/00
Inventor 戴琼海罗晓燕
Owner TSINGHUA UNIV
Learn More