Station area electricity utilization monitoring method based on bad electric quantity data identification
A technology of electricity data and electricity monitoring, applied in the direction of circuit devices, electrical components, etc., can solve the problems of high data platform requirements, poor engineering practicability, limited applicability, etc.
- Summary
- Abstract
- Description
- Claims
- Application Information
AI Technical Summary
Problems solved by technology
Method used
Image

Examples
Embodiment Construction
[0090] In the following, the correctness of the present invention will be further verified by taking the power grid of a station in Hangzhou, Zhejiang as an example in combination with specific implementation methods.
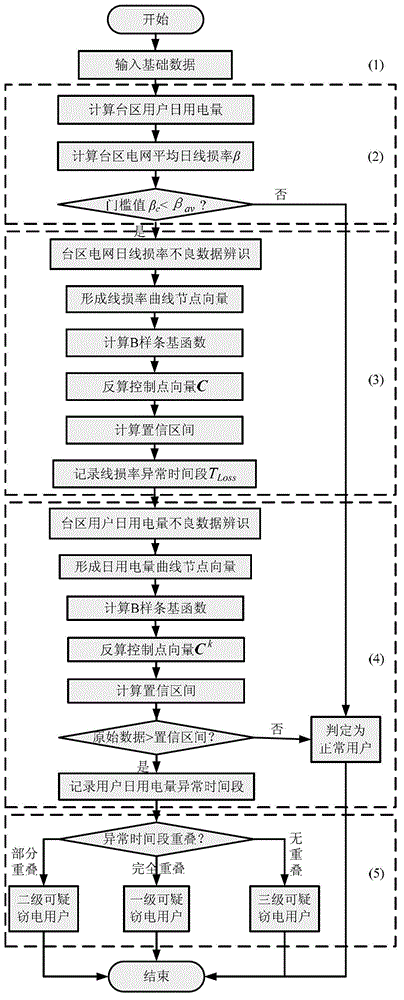
[0091] Such as figure 1 As shown, the specific steps of a power consumption monitoring method based on bad electricity data identification are as follows
[0092] (1), input basic data
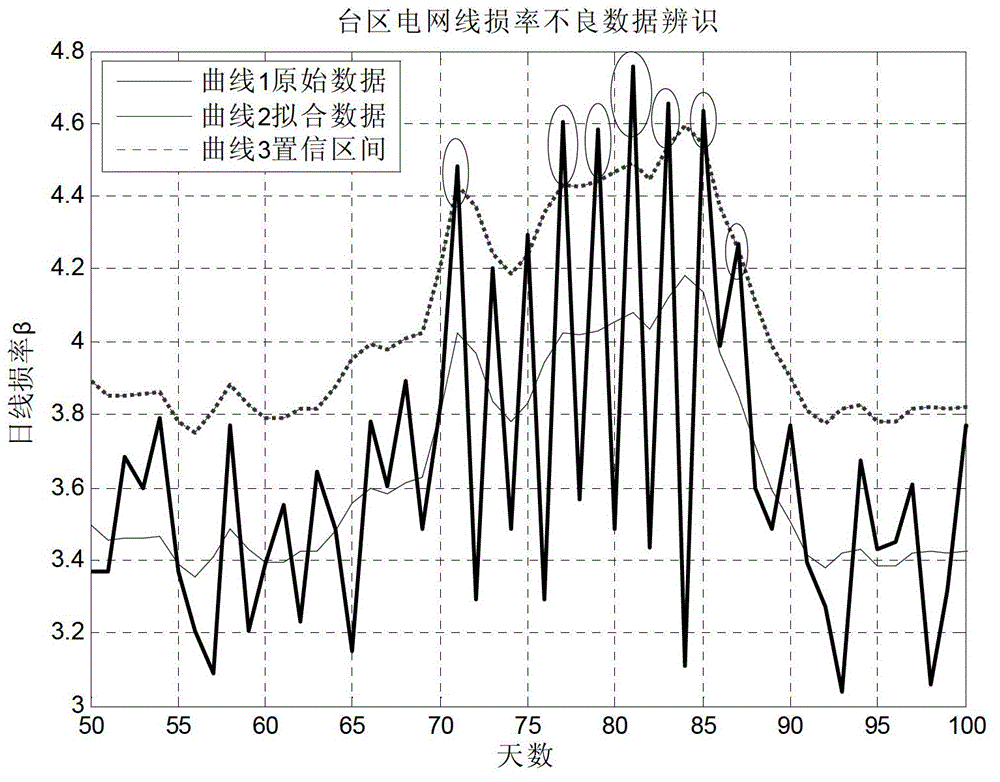
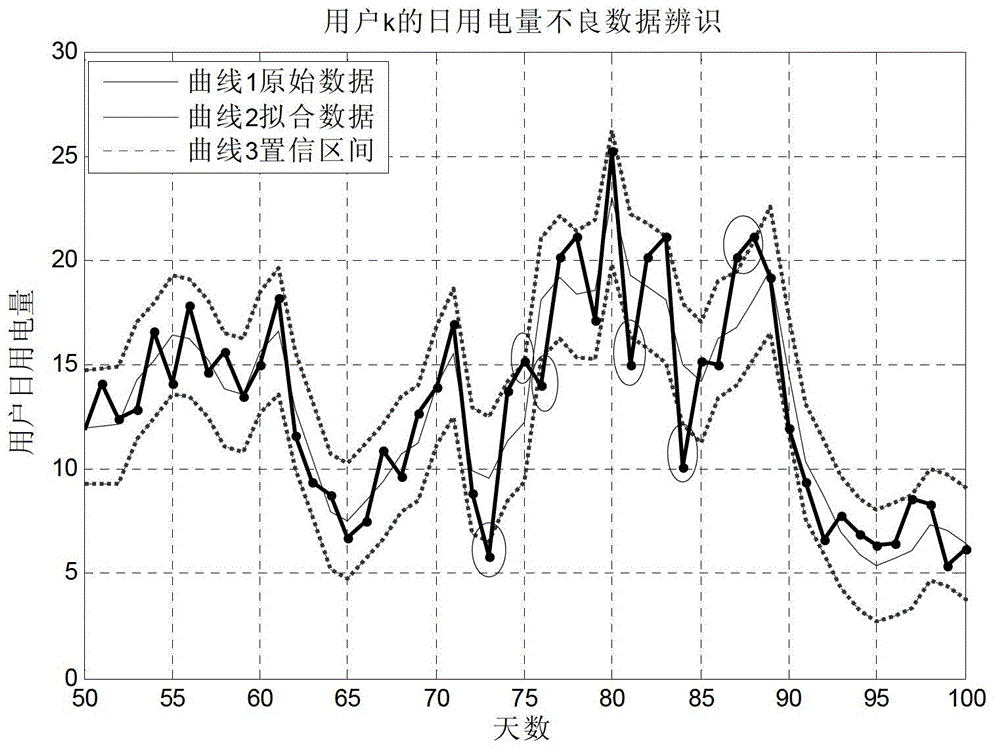
[0093] Input the daily meter reading power data of the general meter of the station area and the sub-meters of each user and the threshold value of the daily line loss rate β within a certain period of time c .
[0094] Input into the power grid of a certain station area in Hangzhou, Zhejiang Province between July and November 2011 (recorded as time period T 1 ) and the daily meter reading electricity data of 39 users (a total of 151 days), the threshold value of the statistical line loss rate of the power grid in the station area: β c =3.5%.
[0095] (2) Calculate the dai...
PUM
 Abstract
Description
Claims
Application Information