Supercharge Your Innovation With Domain-Expert AI Agents!

Method for dynamically showing operating state and spatial distribution of power plant or unit in SVG

A technology of running status and spatial distribution, applied in the direction of program control devices, etc., can solve the problem of underutilization of the excellent features of SVG, and achieve the effect of low development difficulty, strong practicability, and high development efficiency

Active Publication Date: 2013-08-14
TSINGHUA UNIV
View PDF3 Cites 4 Cited by
  • Summary
  • Abstract
  • Description
  • Claims
  • Application Information

AI Technical Summary

Problems solved by technology

At present, there is still no case of dynamically displaying the power plant's operating status and its spatial distribution in SVG using color mapping technology, and the excellent features, rapid development, and strong scalability of SVG have not been fully utilized

Method used


Image

  • Method for dynamically showing operating state and spatial distribution of power plant or unit in SVG
  • Method for dynamically showing operating state and spatial distribution of power plant or unit in SVG
  • Method for dynamically showing operating state and spatial distribution of power plant or unit in SVG

Examples


Embodiment Construction

[0013] The present invention will be described in further detail below in conjunction with the accompanying drawings and embodiments. It should be understood that the specific embodiments described here can be used to explain the present invention, but not to limit the present invention.

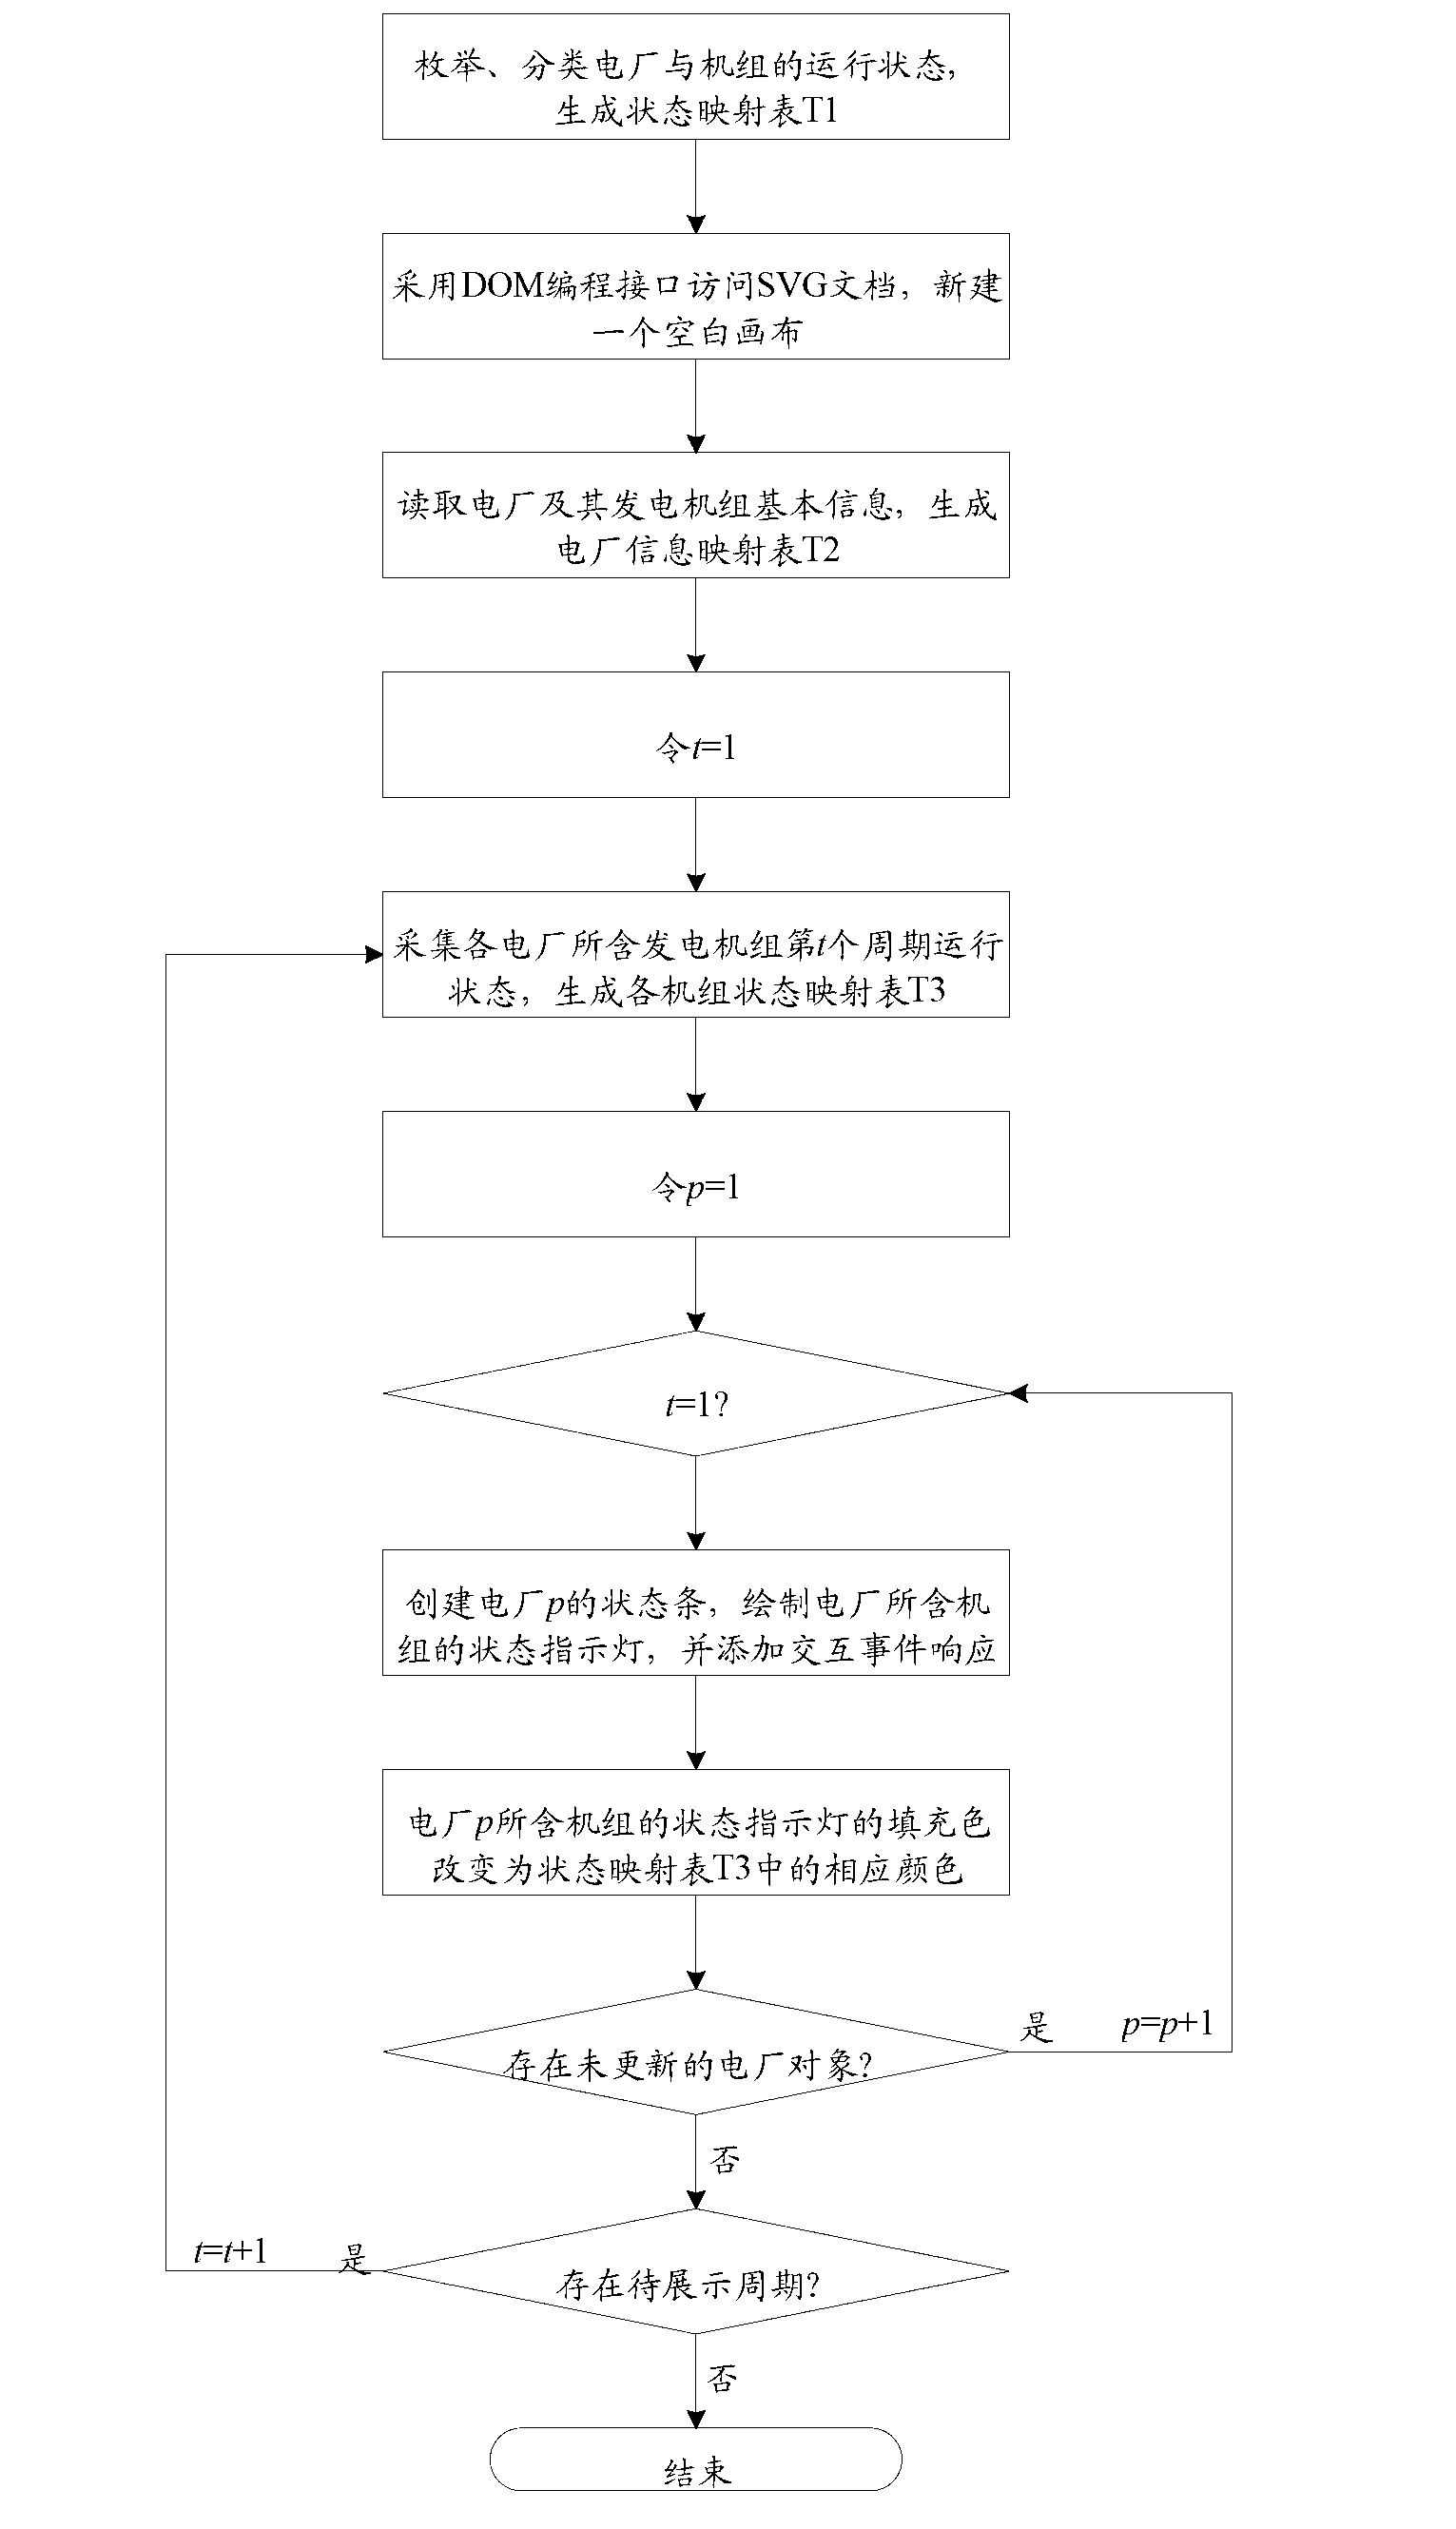
[0014] Based on the SVG graphic format, the present invention provides a method for dynamically displaying the operating state of a power plant or unit and its spatial distribution in SVG. The specific implementation is as follows:

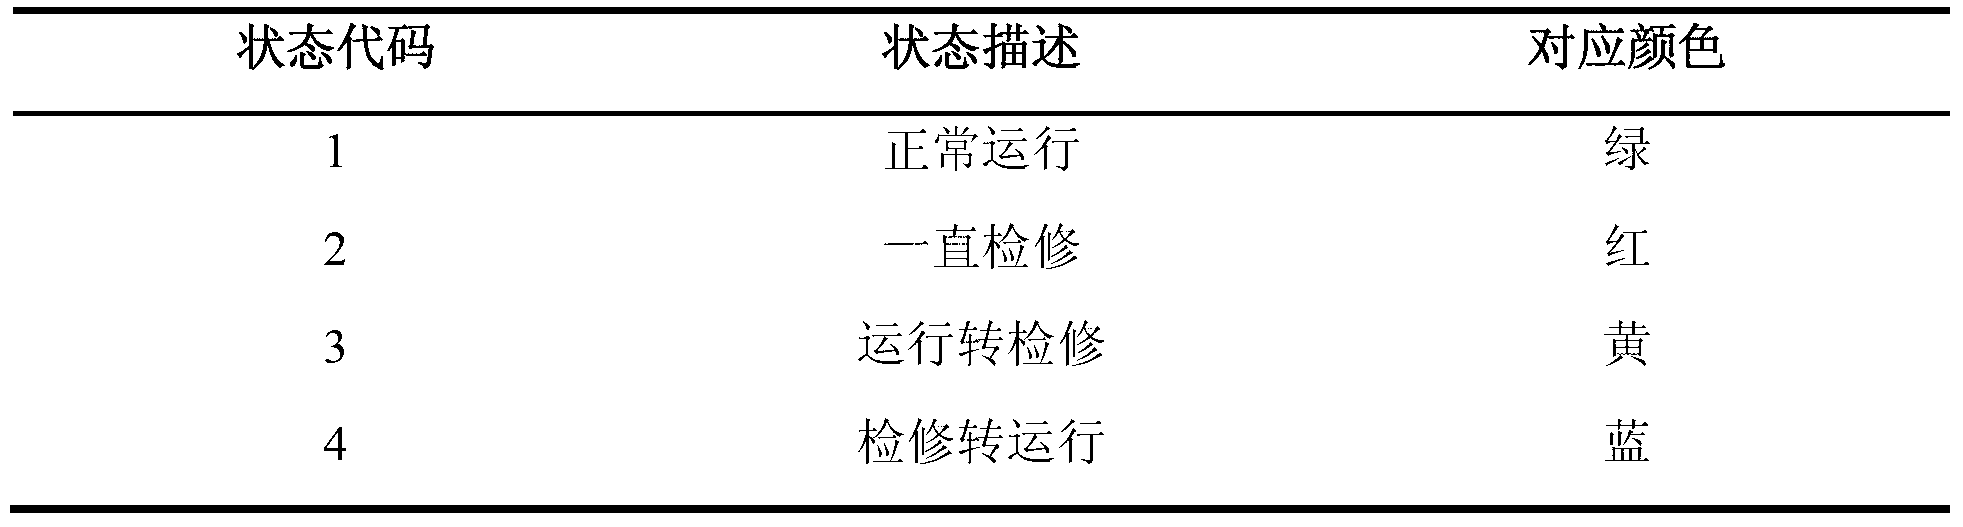
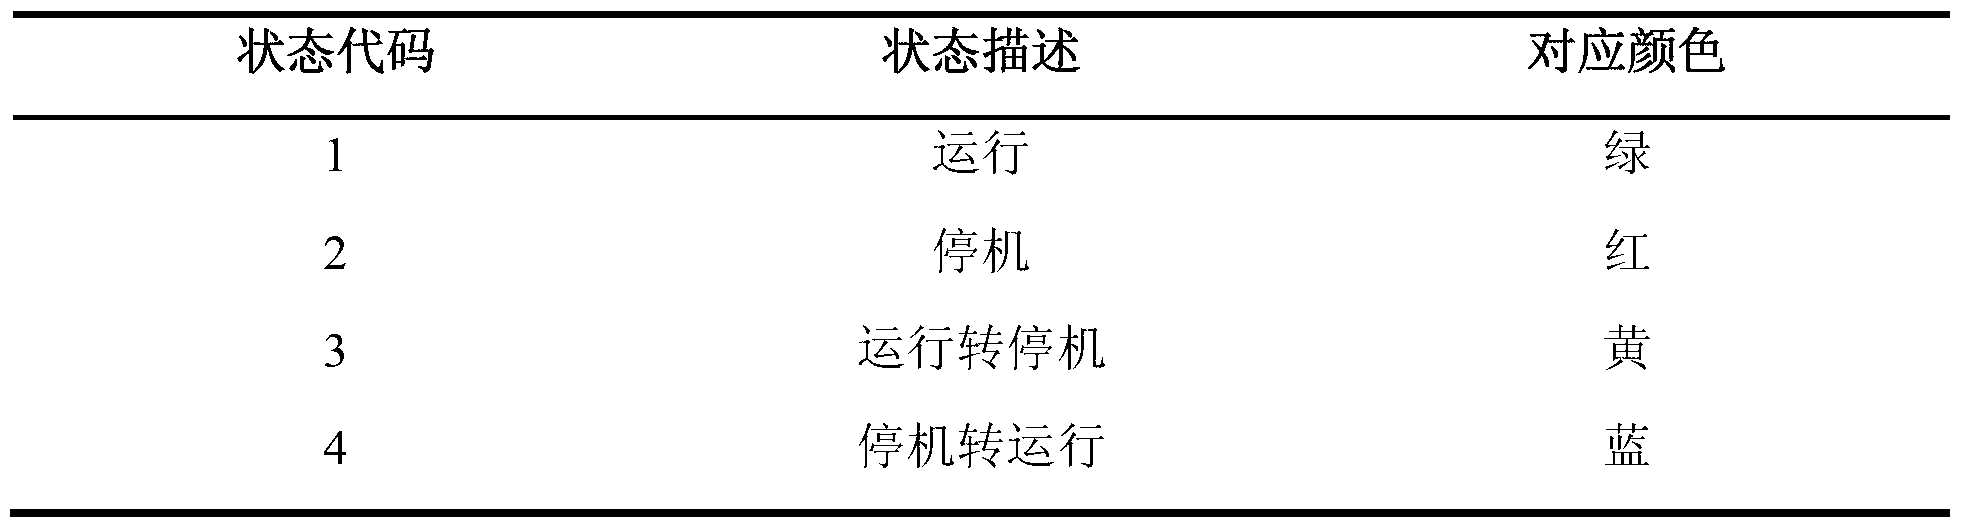
[0015] (1) Enumerate and classify the operating states of power plants and units, map various operating states to specific colors that can express their characteristics, and generate a state mapping table T1 including state codes, state descriptions and corresponding colors;

[0016] For different business themes, there are different ways to distinguish the operating status of power plants and units; for example, the maintenance status of the unit includes four ...


PUM


Abstract

The invention provides a method for dynamically showing an operating state and spatial distribution of a power plant or a unit in SVG (Scalable Vector Graphics). The method takes full advantage of the characteristics that the SVG is flexible in format and easy to use, and supports a DOM (Digital Orthophoto Map) programming interface and interactive response; a changing process of the operating state of the power plant, and a geographical spatial distribution condition of the power plant are showed dynamically on a new canvas by state mapping, information acquisition and circulation refresh; a visual interface used for dynamically showing the operating state and the spatial distribution of the power plant is developed quickly on a programming language platform with a DOM interface function and an SVG renderer; an interactive event is supported; and the method can be embedded into a B / S (Browser / Server) or C / S (Client / Server) software system, can be implemented in a local or network application, is applicable to services such as on-line monitoring of power dispatching, state perception, data visualization, and benefit assessment and analysis, and is low in developing difficulty, high in developing efficiency and very high in practicability.

Description

technical field [0001] The invention relates to the field of electric power system and automation thereof, and provides a method for dynamically displaying the operating state of a power plant and its spatial distribution in SVG (Scalable Vector Graphics, scalable vector graphics). Background technique [0002] The power plant is an important part of supplying electric energy and ensuring the real-time balance of the power system. Intuitive and dynamic display of the operating status of the power plant and its generating units, and then an overall grasp of the power supply situation in the area under the jurisdiction of the power dispatching center, is particularly important in the operation monitoring, status perception, analysis and evaluation of the power system. In power system dispatching, operators are usually concerned with various information such as the maintenance, start-up and shutdown of power plants and generator sets, the status of AGC unit operation, and the c...

Claims


Application Information

Patent Timeline
Patent Type & Authority Applications(China)
IPC IPC(8): G06F9/44
Inventor 赖晓文陈启鑫夏清赵翔宇康重庆
Owner TSINGHUA UNIV
Features
  • R&D
  • Intellectual Property
  • Life Sciences
  • Materials
  • Tech Scout
  • Unparalleled Data Quality
  • Higher Quality Content
  • 60% Fewer Hallucinations
Learn More