A Dynamic Multilevel Histogram Display Method for Hierarchical Data

A layered, rectangular graph technology, applied in the direction of electronic digital data processing, other database retrieval, special data processing applications, etc., can solve problems such as dynamic display of data that cannot be layered

Inactive Publication Date: 2017-05-31
ZHEJIANG GONGSHANG UNIVERSITY +1
View PDF6 Cites 0 Cited by
  • Summary
  • Abstract
  • Description
  • Claims
  • Application Information

AI Technical Summary

Problems solved by technology

[0006] The purpose of the present invention is to overcome the deficiency that the display method in the prior art cannot be used for dynamic display of hierarchical data, and to provide a method for hierarchical data that can efficiently and quickly draw rectangular diagrams on a mobile platform Dynamic Multi-Level Histogram Display Method

Method used


Image

  • A Dynamic Multilevel Histogram Display Method for Hierarchical Data
  • A Dynamic Multilevel Histogram Display Method for Hierarchical Data
  • A Dynamic Multilevel Histogram Display Method for Hierarchical Data

Examples


Embodiment Construction

[0044] The present invention will be further described below in conjunction with the accompanying drawings and specific embodiments.

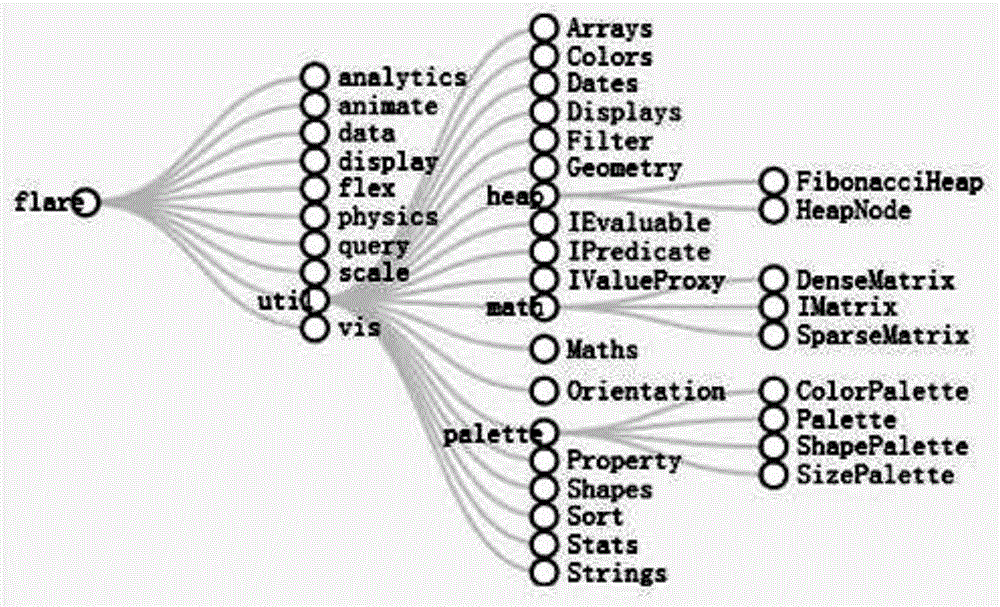
[0045] Such as figure 1 The illustrated embodiment is a dynamic multi-level histogram display method for hierarchical data. The display screen of this embodiment has WIDTH=1260 pixels and HEIGHT=696 pixels, such as figure 2 As shown, the second layer of nodes includes the nodes analytics, animate, data, display, flex, physics, query, scale, util, and vis, as well as the nodes of the third and fourth layers.

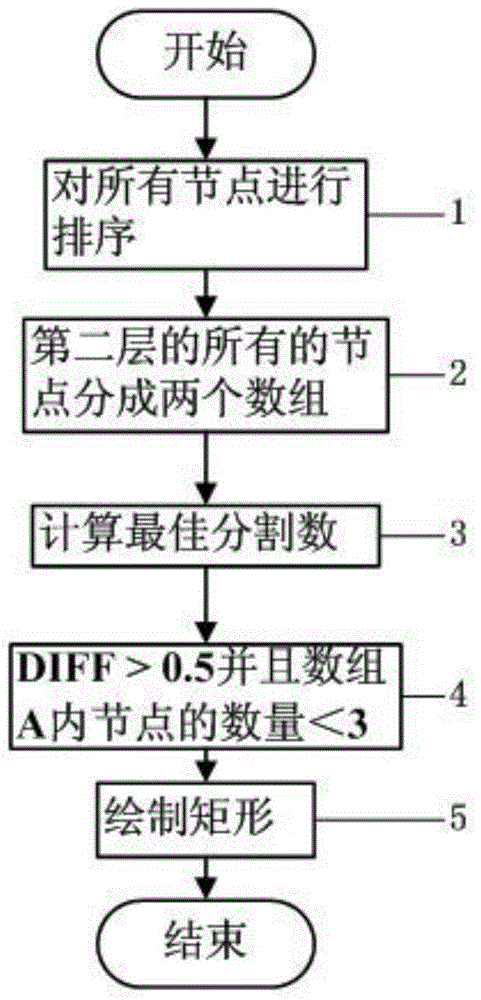
[0046] Such as figure 1 shown, including the following steps:

[0047] Step 1, sort all nodes in descending order of quantized attribute values. Sort the results in descending order as follows: analytics, animate, data, display, flex, physics, query, scale, util, vis.

[0048] Step 2, divide all nodes in the second layer into two arrays: array A and array B. Array A contains analytics, array B contains animate, data and all other nod...


PUM


Abstract

The invention discloses a dynamic multi-stage histogram display method of layering data. The dynamic multi-stage histogram display method is a context-based layering layout algorithm, the layering data are better expressed by exploring a length-width ratio of a rectangle of an array, efficient and rapid drawing of a histogram on a mobile platform can be achieved, and a dynamic multi-stage histogram can be displayed to the layering data.

Description

technical field [0001] The invention relates to the technical field of hierarchical data, in particular to a dynamic multi-level histogram display method capable of efficiently and rapidly drawing hierarchical data of a histogram on a mobile platform. Background technique [0002] As a visual display method of spatially hierarchical data, the tree diagram can make full use of the display space to present large-scale hierarchical data, and emphatically express the quantitative attributes and distribution relationships of data nodes through the size and position of its nodes. [0003] The treemap layout algorithm is the core content of the treemap visualization method, which is used to draw visual graphics on a two-dimensional plane according to the hierarchical structure, node weight and node sequence of the treemap of hierarchical data. [0004] However, due to the recursive nature of the tree graph layout algorithm, it cannot be used for dynamic display of hierarchical data...

Claims


Application Information

Patent Timeline
Patent Type & Authority Patents(China)
IPC IPC(8): G06F17/30
CPCG06F16/904
Inventor 孔丁科刘菁菁刘丹胡玉彪黄道峰王勋
Owner ZHEJIANG GONGSHANG UNIVERSITY
Why Eureka
Try Eureka