
Method for rapidly and automatically identifying cell subsets of streaming data
A cell subgroup, automatic identification technology, applied in character and pattern recognition, recognition of medical/anatomical patterns, instruments, etc., can solve the problems of loss of biological information, large sample size, long calculation time, etc., and achieve high accuracy of results. , the effect of short time
- Summary
- Abstract
- Description
- Claims
- Application Information
AI Technical Summary
Problems solved by technology
Method used
Image

Examples
Embodiment Construction
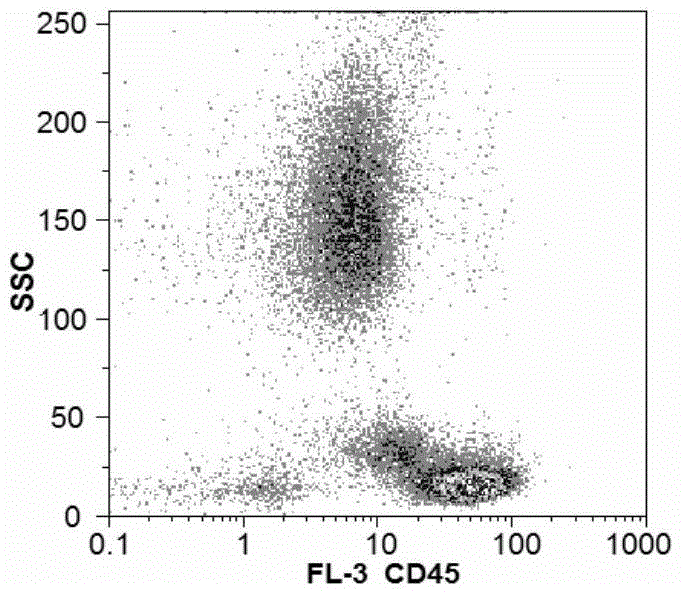
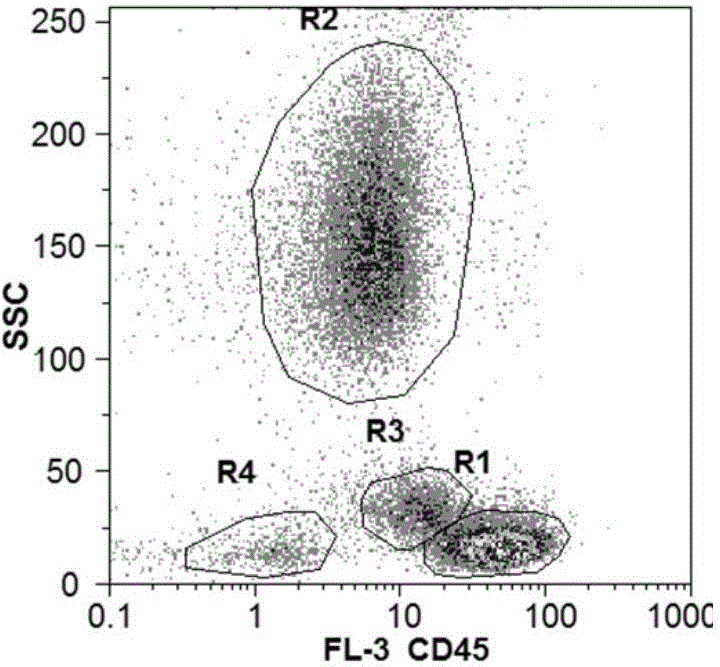
[0024] Such as Figure 1a is the projection of the experimental data in the SSC and CD45 dimensions. Manual analysis of the data was done by drawing gates to divide the cell subgroups in the scatter plot. Such as Figure 1b It is the result of cell subgroups divided by experts using FloMax software. According to the results, the sample contains four cell subgroups, and the R1-R4 regions represent lymphocyte subgroups, monocyte subgroups, granulocyte subgroups and dead cells.
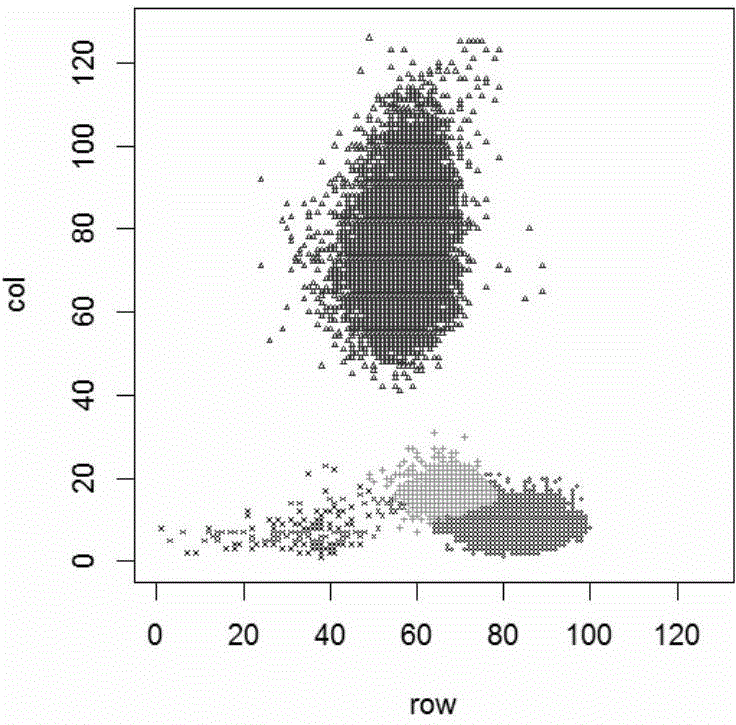
[0025] Such as figure 2 It is the result of compressing the data into a 128*128 matrix by using the method of the present invention and grouping the position points of the matrix by using the circular maximum method. Its specific implementation process is:
[0026] (1) Find the position P corresponding to the maximum value of the matrix Mat m [x m ,y m ], and apply for taxon S 1 , and P m ∈ S 1 , and let P m = 0;
[0027] (2) Find the position P of the maximum value of Mat again i [x i ,y ...
PUM
 Abstract
Description
Claims
Application Information