Retailer power purchase and sale policy optimization method considering bilateral trade
An optimization method, a retailer's technology, applied in marketing, instrumentation, data processing applications, etc.
- Summary
- Abstract
- Description
- Claims
- Application Information
AI Technical Summary
Problems solved by technology
Method used
Image
Examples
Embodiment 1
[0305] Example 1: Taking short-term planning as an example, study the electricity purchase and sale behavior of retailers considering bilateral transactions. Assuming that the planning cycle is two hours, there are two bilateral contracts to choose from, and the retailer's signature is valid at any time, and the bilateral contract curve of each contract includes two stages. Table 1 gives the detailed parameters of each contract, including contract electricity price, available capacity, etc.
[0306] Table 1 Bilateral Contract Curve Information
[0307]
[0308] Set the spot market price and user demand as four scenarios, and the probability of occurrence of each scenario is equal. Consider only one user base. Table 2 lists user demand and spot market prices for each period and scenario.
[0309] Table 2 User load demand and spot market price information
[0310]
[0311] The example contains three retailers, one of which is the research object (retailer A), and the o...
Embodiment 2
[0329] Example 2: Based on the actual situation of a certain place, the retailer's electricity purchase and sale optimization strategy considering bilateral contracts is studied. The planning cycle is one year, and the whole year is divided into 72 periods, that is, each month is divided into 6 periods. The six time periods are Monday off-peak hours, Monday peak hours, other weekday off-peak hours, other weekday peak hours, weekend off-peak hours, and weekend peak hours. The peak hours are {11, 12, 13, 14, 19, 20, 21, 22}; other periods are off-peak periods.
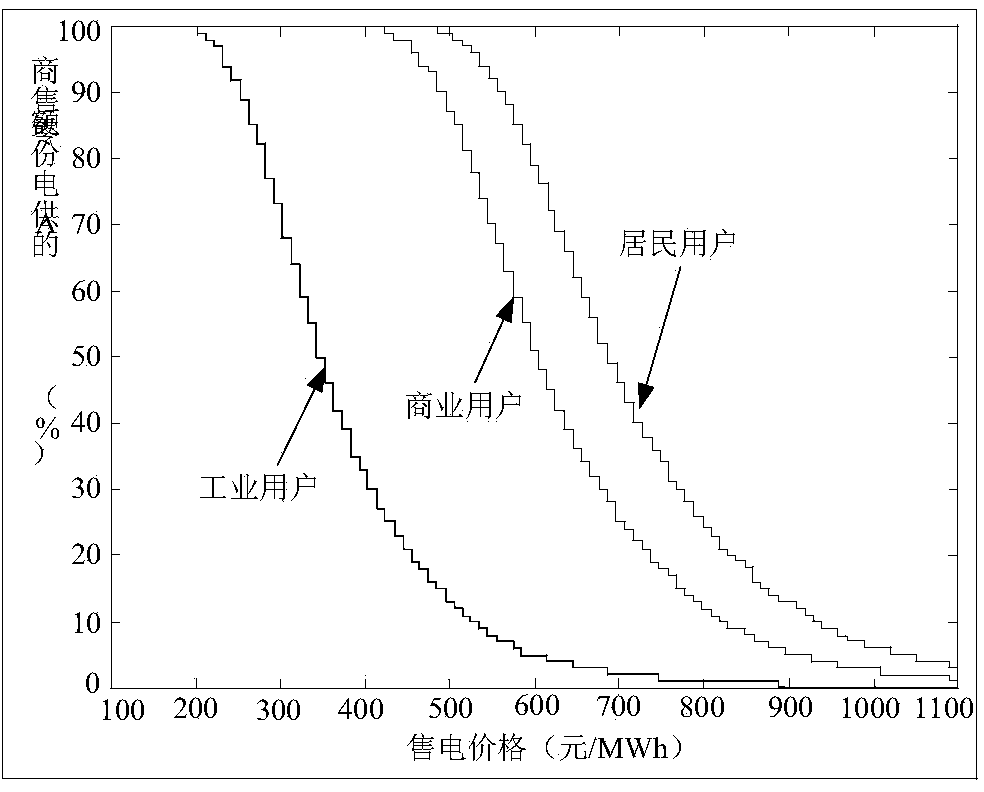
[0330] There are three user groups, namely residential users, commercial users and industrial users. Table 9 lists the characteristics of the three user groups. figure 1 is the differential electricity price of retailer A to the three user groups. The spot market price and user demand are simulated by matlab using the data of the past 5 years.
[0331] Table 9 User Group Information
[0332]
[0333] Assume that t...
PUM
 Abstract
Description
Claims
Application Information
 - R&D
- Intellectual Property
- Life Sciences
- Materials
- Tech Scout
- Unparalleled Data Quality
- Higher Quality Content
- 60% Fewer Hallucinations
Browse by: Latest US Patents, China's latest patents, Technical Efficacy Thesaurus, Application Domain, Technology Topic, Popular Technical Reports.
© 2025 PatSnap. All rights reserved.Legal|Privacy policy|Modern Slavery Act Transparency Statement|Sitemap|About US| Contact US: help@patsnap.com


