Oil well indicator diagram data analysis method

A data analysis and dynamometer technology, applied in earth-moving drilling, wellbore/well components, measurement, etc., can solve the problem of not being able to detect changes in dynamometer in time, shorten the discovery time, improve the management level, and prevent collapse. well effect

Inactive Publication Date: 2015-04-29
SHANDONG TIANGONG PETROLEUM EQUIP
View PDF7 Cites 12 Cited by
  • Summary
  • Abstract
  • Description
  • Claims
  • Application Information

AI Technical Summary

Problems solved by technology

[0003] In order to overcome the problems that existing oil well dynamometer diagram data analysis requires manual search in sequence, data comparison, and failure to discover changes in dynamometer diagram in time, the present invention provides a data analysis method for oil well dynamometer diagram

Method used


Image

  • Oil well indicator diagram data analysis method
  • Oil well indicator diagram data analysis method

Examples


Embodiment Construction

[0015] In order to make the object, technical solution and advantages of the present invention clearer, the present invention will be described in detail below in conjunction with the accompanying drawings and specific embodiments.

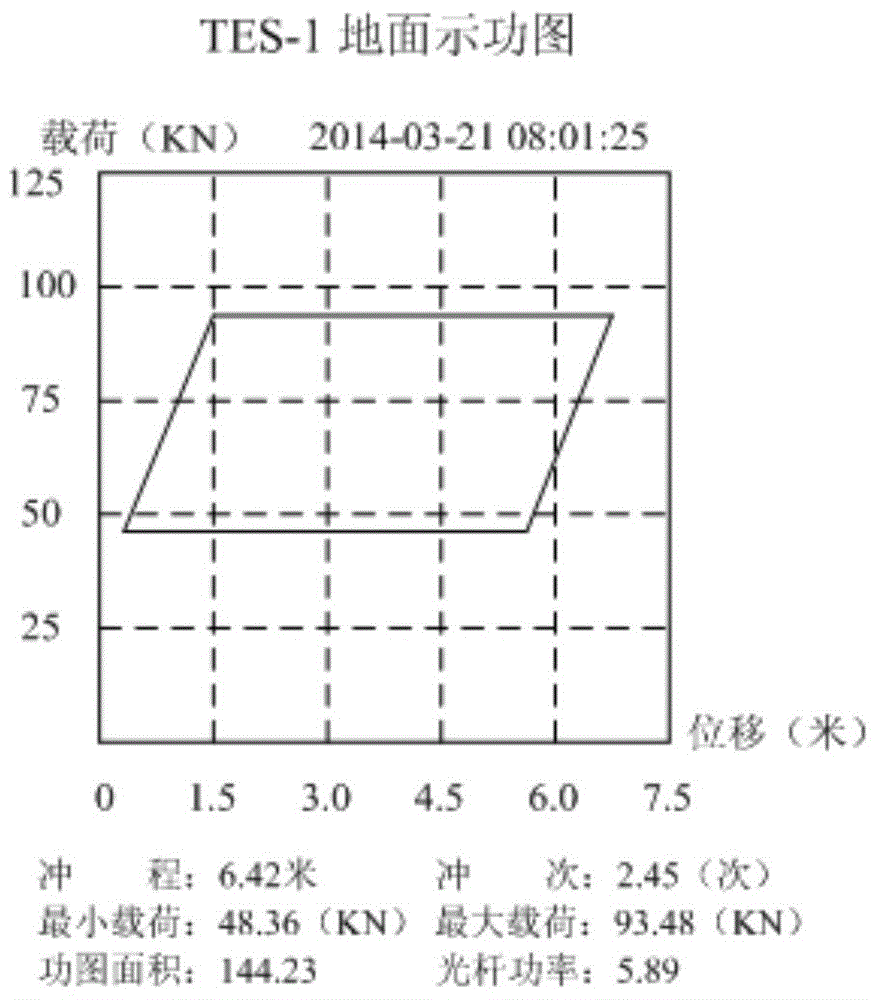
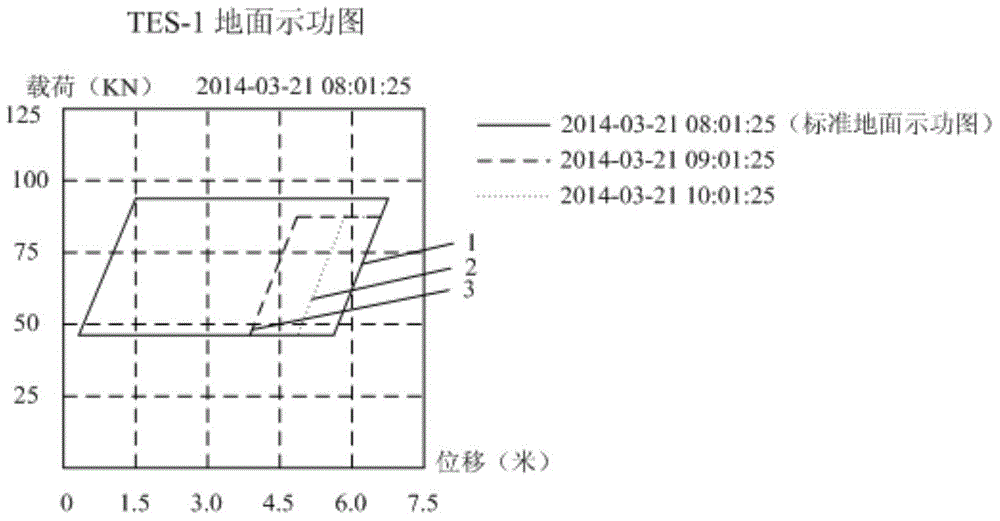
[0016] A method for data analysis of oil well dynamometer diagrams of the present invention, the dynamometer diagrams at a certain collection time point in the daily stable working state of the oil well are set as standard dynamometer diagrams, and the dynamometer diagrams at other collection time points of the oil well are set Compare the standard dynamometer diagrams of the oil wells to find out the changes in the working parameters of the oil well. In the daily working process of the oil well, the parameters of the working conditions are constantly changing. In order to better detect the changes of the working parameters of the oil well in time, the standard indicator diagram needs to be changed and adjusted according to the actual working condi...


PUM


Abstract

The invention provides an oil well indicator diagram data analysis method. The method comprises the following steps : setting an indicator diagram of an oil well at a certain collection time point under a daily steady operation state as a standard indicator diagram, comparing indicator diagrams of the oil well at other collection time points with the set standard indicator diagram, and searching oil well operating parameter change conditions. According to the oil well indicator diagram data analysis method, the indicator diagram at different collection time points are put in a same coordinate system, and different modes, such as colors and line types are adopted for labeling, and comparison is performed in time so as to discover changes generated by the indicator diagram, so that the working condition change conditions of the oil well are mastered; the labor strength of manpower is reduced; the oil well operation abnormity discovery time is shortened; the on-site problem copping response speed is improved; the oil well is prevented from more severe accidents such as well collapse and well lying and the oil well management level is improved.

Description

technical field [0001] The invention relates to a method for analyzing data of oil well operating conditions, in particular to a method for analyzing data of oil well indicator diagrams. Background technique [0002] At present, oilfields regularly go to the well site manually to collect oil well dynamometer diagrams with instruments and equipment, and then view the dynamometer diagrams at different collection time points of the well in turn to grasp the working status of the well during this time period. This method is used to analyze the existence of oil well data. The problem is: when querying the dynamometer data, it needs to be searched sequentially, and the data is compared manually, which increases the labor intensity and reduces the work efficiency; The working condition deteriorates and the maintenance cost increases. Contents of the invention [0003] In order to overcome the existing problems of manually searching and comparing data in order to detect changes i...

Claims


Application Information

Patent Timeline
Patent Type & Authority Applications(China)
IPC IPC(8): E21B47/00
CPCE21B47/00E21B47/008
Inventor 孔强孙浩轩计洪图张俊威
Owner SHANDONG TIANGONG PETROLEUM EQUIP
Why Eureka
Try Eureka