Drawing method and device for ice region distribution diagram

A distribution map and ice area technology, applied in the field of mapping, can solve the problems of less icing data records and inaccurate ice area distribution maps.

Active Publication Date: 2015-06-10
STATE GRID CORP OF CHINA +3
View PDF6 Cites 4 Cited by
  • Summary
  • Abstract
  • Description
  • Claims
  • Application Information

AI Technical Summary

Problems solved by technology

[0005] The main purpose of the present invention is to provide a method and device for drawing ice area distribution maps to solve the problem that in a specific area, due to the lack of wire icing observation stations and the measured ice data records, the resulting ice data The problem that the ice area distribution map generated by the record is inaccurate

Method used


Image

  • Drawing method and device for ice region distribution diagram
  • Drawing method and device for ice region distribution diagram
  • Drawing method and device for ice region distribution diagram

Examples


Embodiment 1

[0018] An embodiment of the present invention provides a method for drawing an ice area distribution map.

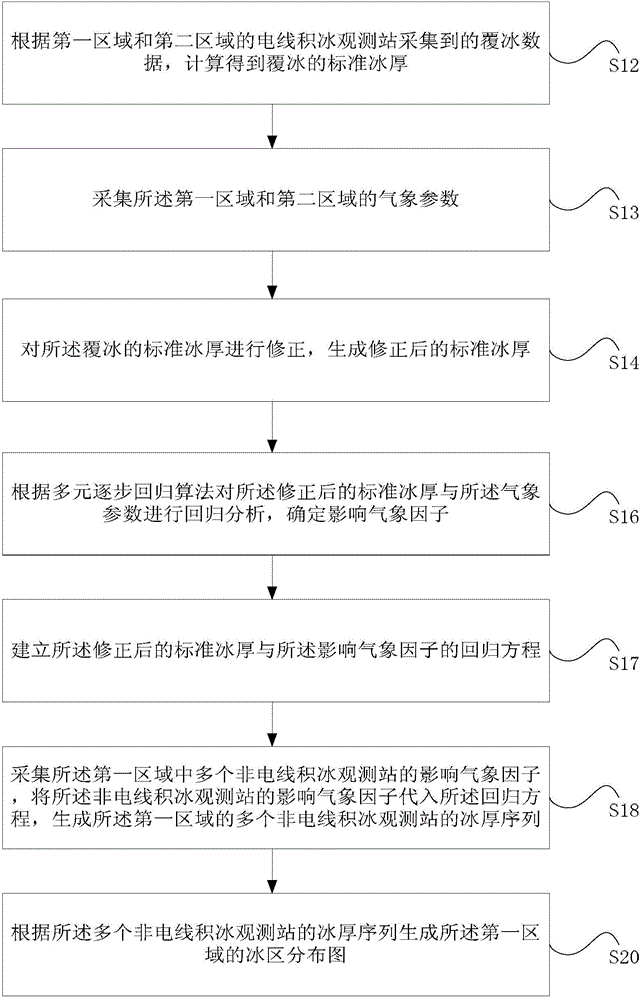
[0019] figure 1 It is a flowchart of a method for drawing an ice area distribution map according to an embodiment of the present invention. like figure 1 As shown, the method includes the following steps:

[0020] Step S12 , calculating the standard ice thickness of the icing according to the icing data collected by the wireline icing observation stations in the first area and the second area.

[0021] Specifically, the above-mentioned icing data may be wire icing data, and the above-mentioned first area may be an area containing few icing observation stations. For example, there are only two icing observation stations in Beijing. The collected wire icing data is less, that is, the ice observation sequence is short, so in this scheme, the wire icing data collected by the wire icing observation station in the second area outside the first area can be obtained.

[0022...

Embodiment 2

[0062] The embodiment also provides a device for an ice distribution map, and the device can execute the method for drawing the ice distribution map in the above-mentioned embodiment.

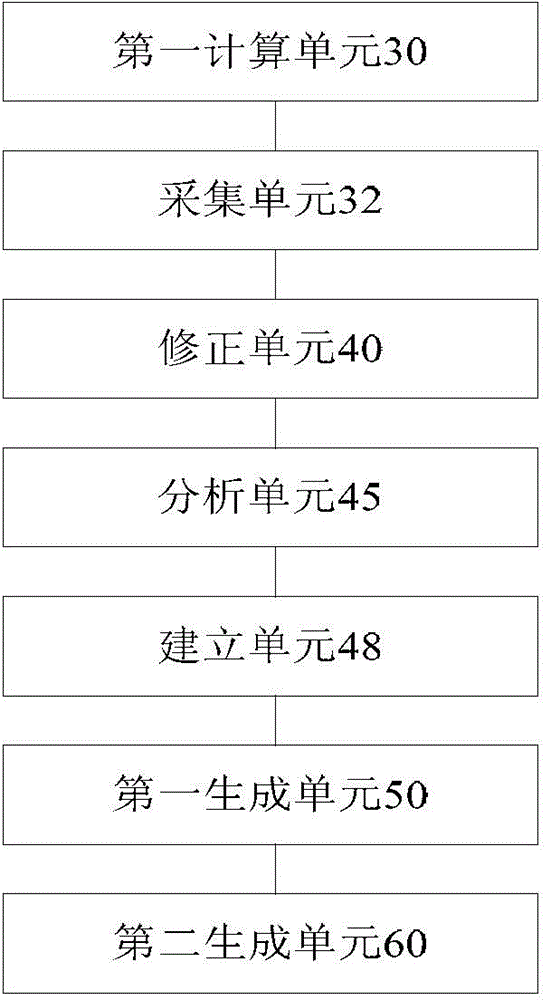
[0063] like image 3 As shown, the device may include:

[0064] The first calculation unit 30 is configured to calculate the standard ice thickness of the icing according to the icing data collected by the wireline icing observation stations in the first area and the second area.

[0065] Specifically, the above-mentioned icing data may be wire icing data, and the above-mentioned first area may be an area containing few icing observation stations. For example, there are only two icing observation stations in Beijing. The collected wire icing data is less, that is, the ice observation sequence is short, so in this scheme, the wire icing data collected by the wire icing observation station in the second area outside the first area can be obtained.

[0066] What needs to be explained here is tha...


PUM


Abstract

The invention discloses a drawing method and device for an ice region distribution diagram. The method comprises steps as follows: the standard ice thickness of icing is calculated according to icing data collected by wire icing observation stations of a first region and a second region; meteorological parameters of the first region and the second region are collected; the standard ice thickness of icing is corrected; the corrected standard ice thickness and the meteorological parameters are subjected to regression analysis, and meteorological impact factors are determined; a regression equation of the corrected standard ice thickness and the meteorological impact factors is established; meteorological impact factors of a plurality of non-wire-icing observation stations in the first region are collected, the meteorological impact factors of the non-wire-icing observation stations are substituted into the regression equation to generate an ice thickness sequence of the plurality of non-wire-icing observation stations in the first region; the ice region distribution diagram of the first region is generated. Therefore, the problem of inaccuracy of the ice region distribution diagram generated according to the icing data record due to fewer wire icing observation stations and less measured icing data record in the specific region is solved.

Description

technical field [0001] The invention relates to the field of drawing, in particular to a method and device for drawing an ice area distribution map. Background technique [0002] The ice area distribution map is the basis for preventing ice and snow disasters in the power grid. Relevant departments can use the ice level of different regions in the ice area distribution as the basis for anti-icing design of new and expanded power transmission and transformation projects. Generally speaking, the existing mapping The method of ice area distribution map is to collect a large amount of wire icing data observed by the icing observation station, calculate the icing thickness of the wire according to the large amount of wire icing data, and then remove the top according to the sequence formed by the above-mentioned ice thickness. The ice level of the region, and then form the ice distribution map. [0003] What needs to be explained here is that since there are relatively few ice a...

Claims


Application Information

Patent Timeline
Patent Type & Authority Applications(China)
IPC IPC(8): G06F17/50
Inventor 周恺张祎果王谦叶宽李春生
Owner STATE GRID CORP OF CHINA
Why Eureka
Try Eureka