Visualization method and system for growing time series data

A time series and data technology, applied in other database browsing/visualization, other database retrieval and other directions, can solve the problems of increasing the identifiability of early time data, increasing space utilization, etc., to improve display effect and efficiency, and increase space utilization. rate, display the effect of high efficiency

Active Publication Date: 2019-07-16
BEIJING TECHNOLOGY AND BUSINESS UNIVERSITY
View PDF4 Cites 0 Cited by
  • Summary
  • Abstract
  • Description
  • Claims
  • Application Information

AI Technical Summary

Problems solved by technology

[0006] The main purpose of this application is to provide a visualization method and system for growth-type time series data to solve the problem of displaying growth-type time-series data in the form of a themed river map in the process of visualizing growth-type time-series data The technical problem of converting the thematic river map in the form of Cartesian coordinates into a circle in a two-dimensional plane, thereby increasing the recognizability of the previous time data (visual graphic image clarity) while increasing the space utilization

Method used


Image

  • Visualization method and system for growing time series data
  • Visualization method and system for growing time series data
  • Visualization method and system for growing time series data

Examples


Embodiment Construction
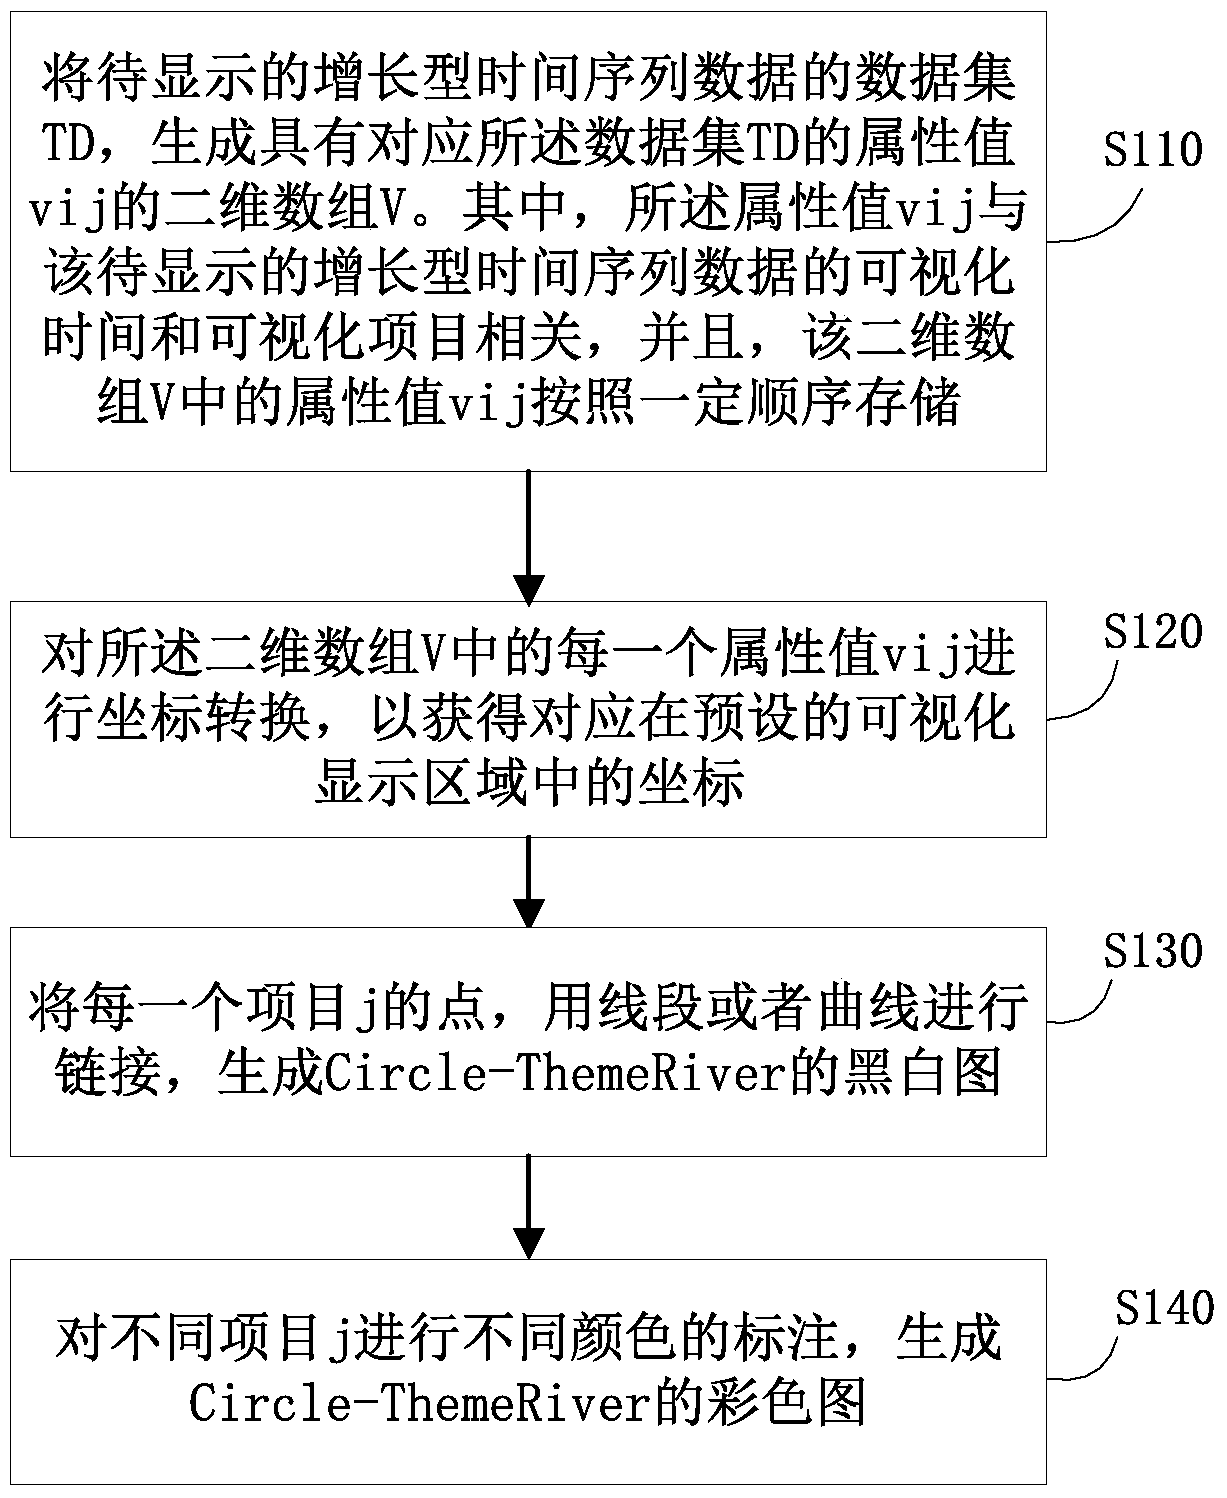
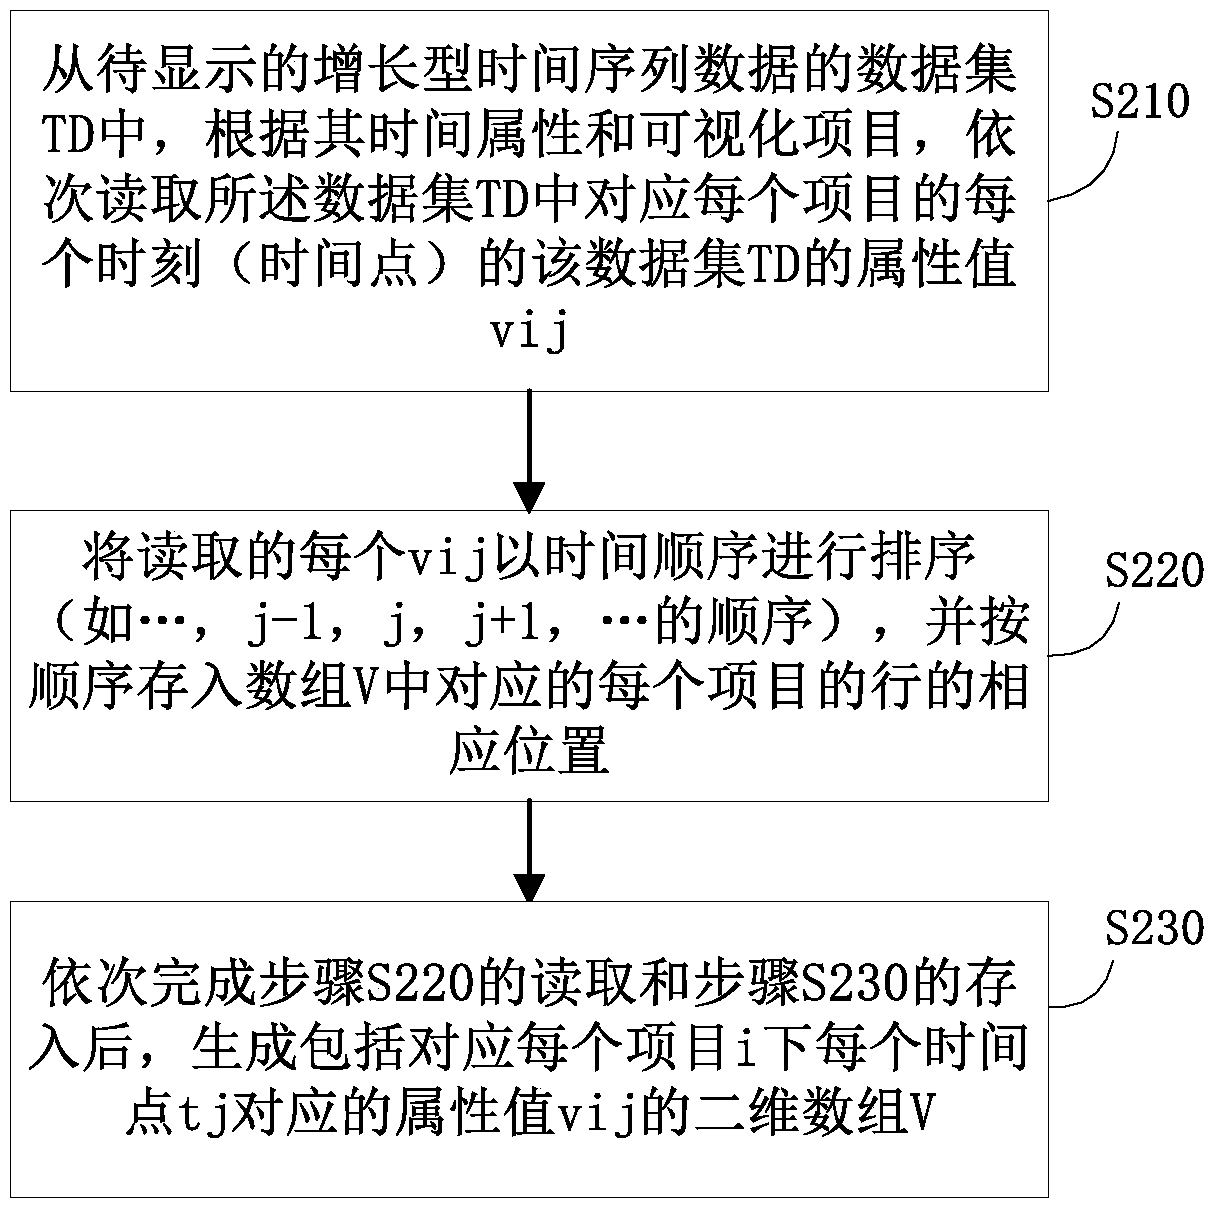
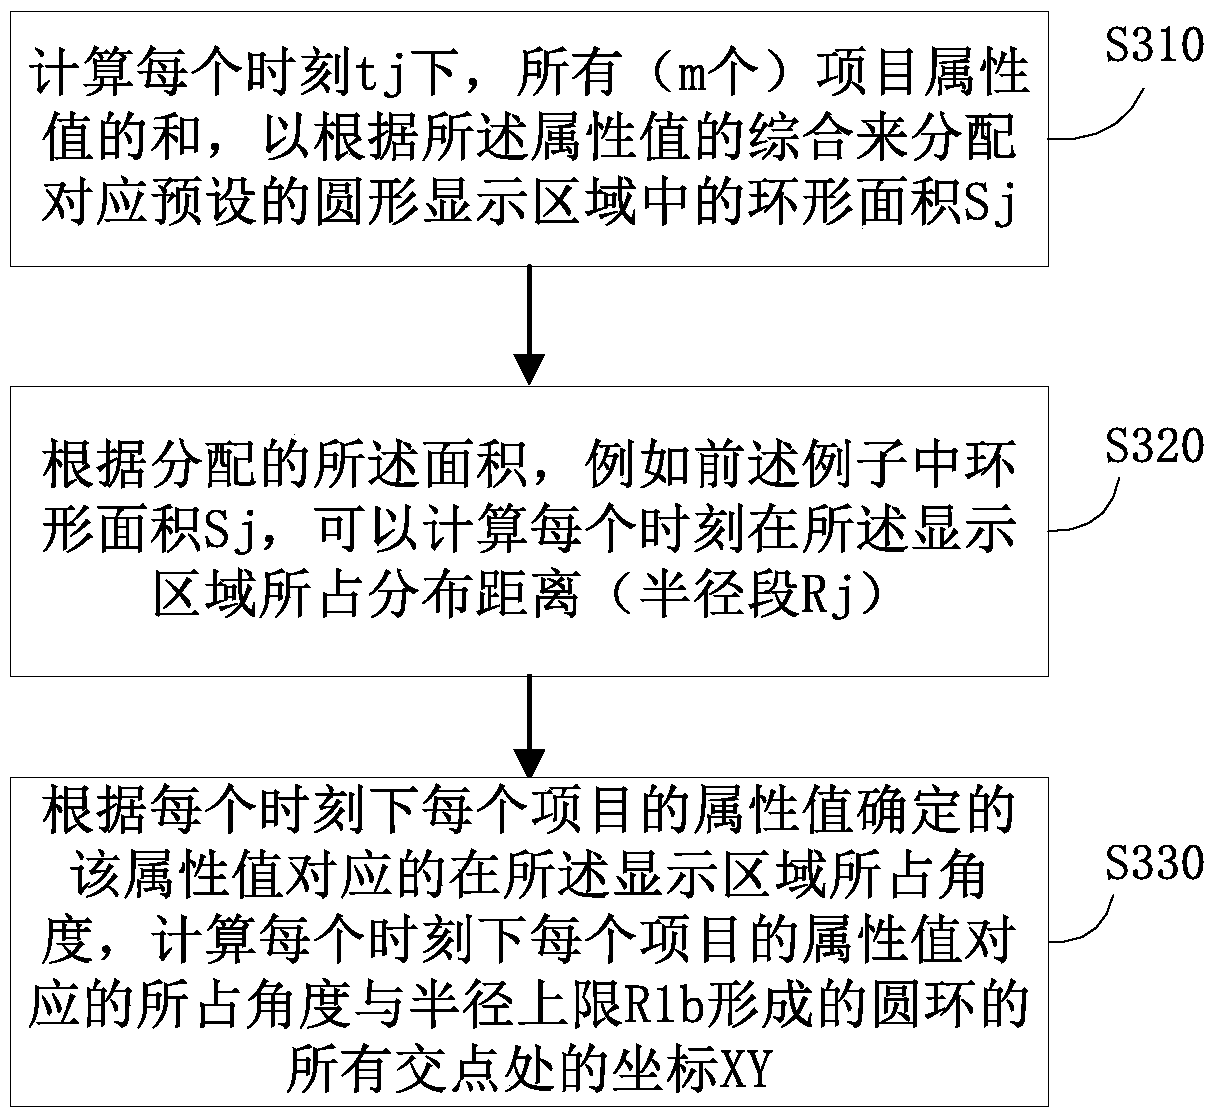
[0023] The main idea of ​​this application is to visualize Circle-ThemeRiver for growth-type time series data, first construct a two-dimensional array structure storage mode for its data set TD according to the visualized time and project characteristics; preset a circular display area, The moment corresponding to the attribute value in the two-dimensional array is converted into a radius of different lengths in the circular display area for representation (display or display), and the sum of all item attribute values ​​at the corresponding moment is converted into the form of a ring area for representation; Realize the linking methods of straight line segments and cubic spline interpolation respectively to form a visualized Circle-ThemeRiver with a circle as the display area. In this way, it overcomes the shortcomings of the existing visual ThemeRiver for growing data due to the continuous increase of screen pixels or data over time, the small data value of the previous data l...


PUM


Abstract

The invention discloses a visualization method and system for growth type time series data. The visualization method includes that generating a data set of growth type time series data to be displayed into a two-dimensional array with attribute values vij, wherein the attribute values vij are corresponding to the data set and stored according to a certain sequence; converting each attribute value vij in the two-dimensional array to obtain corresponding coordinates in a preset visually display region; using a line segment or curve to link the coordinate points of each project j to generate a black and white picture of Circle-ThemeRiver; using different colors to mark different projects j to generate a color picture of Circle-ThemeRiver. According to the scheme, through using a theme river picture mode to display the growth type time series data in a two-dimensional plane and converting a Cartesian coordinate type theme river picture into round, the space use rate is increased, and the early time data identification is increased.

Description

technical field [0001] The present application relates to the field of information visualization processing, in particular to a visualization method and system for growing time series data. Background technique [0002] The current data growth rate has exceeded Moore's Law, and big data is an important topic on the Internet today. Everything that can be recorded can be converted into data. In the endlessly increasing data, there are countless opportunities hidden. How to find valuable relationships and valuable data features in chaotic data is an important and difficult point in the field of data analysis. Visualization technology can convert data into graphical images and display different characteristics of data from different levels with interactive means, so as to better help people analyze data. Now visualization technology has been applied to various fields such as economy, culture and politics, solving the problem that in some cases, it is difficult to effectively ...

Claims


Application Information

Patent Timeline
Patent Type & Authority Patents(China)
IPC IPC(8): G06F16/904
Inventor 刘瑞军侯堃陈谊
Owner BEIJING TECHNOLOGY AND BUSINESS UNIVERSITY
Why Eureka
Try Eureka