Anomaly detection method based on cumulative sum control chart and applied to satellite power supply system

A technology for satellite power supply and anomaly detection, applied in electrical digital data processing, special data processing applications, instruments, etc., can solve problems such as inability to detect minor faults, early warning, and wide thresholds, saving computing time and accuracy. high effect

Active Publication Date: 2015-12-02
HARBIN INST OF TECH +1
View PDF2 Cites 7 Cited by
  • Summary
  • Abstract
  • Description
  • Claims
  • Application Information

AI Technical Summary

Problems solved by technology

[0005] In order to solve the problems of the existing satellite power system abnormality detection, such as the threshold value is too wide, can not detect ...

Method used


Image

  • Anomaly detection method based on cumulative sum control chart and applied to satellite power supply system
  • Anomaly detection method based on cumulative sum control chart and applied to satellite power supply system
  • Anomaly detection method based on cumulative sum control chart and applied to satellite power supply system

Examples


specific Embodiment approach 1

[0020] An abnormal detection method for a satellite power system based on cumulative sum control charts, including the following steps:

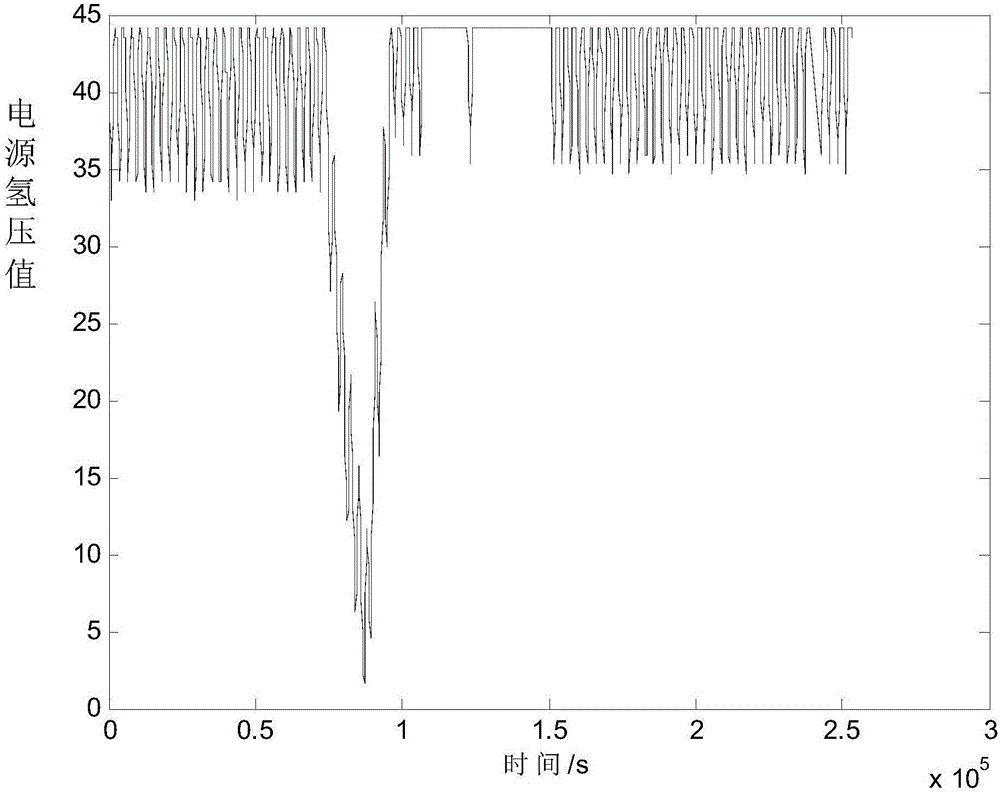
[0021] Step 1. Obtain the historical data of the normal operation of the nickel-hydrogen battery satellite power supply for a period of time, select the hydrogen pressure value of the power supply as an evaluation parameter, and perform pre-processing (including shaving and smoothing) on ​​the hydrogen pressure value. The hydrogen pressure values ​​are divided into m groups, and the average value p of each group of hydrogen pressure values ​​is calculated j , j=1,2,...m;

[0022] Step 2, calculate the statistical characteristics of the hydrogen pressure value of the power supply, that is, calculate the mean value p described in step 1 j The mean and variance of ;

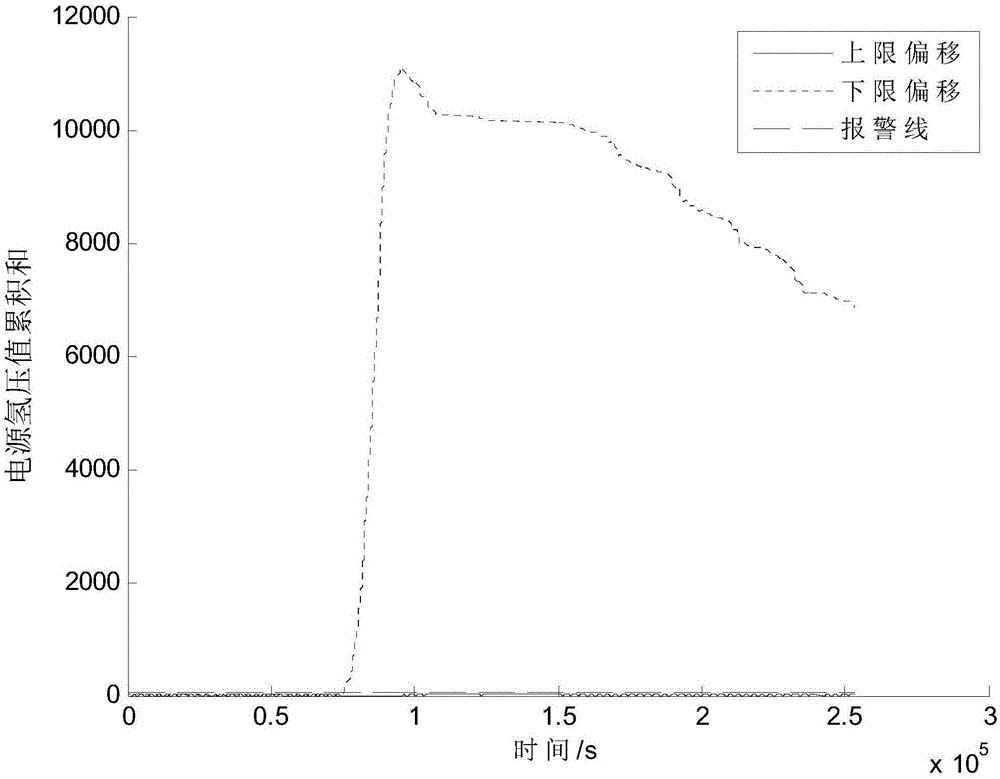
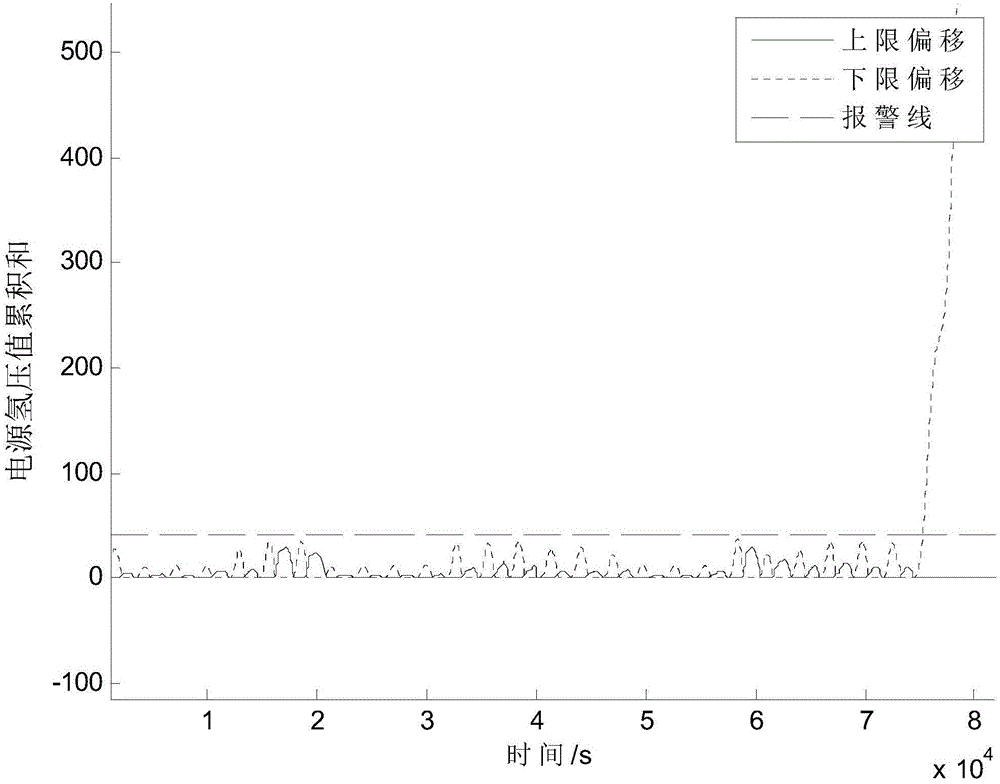
[0023] Step 3. Determine the tolerance and threshold value of the accumulation and control chart according to the statistical characteristics of the hydrogen pressure value duri...

specific Embodiment approach 2

[0027] As described in step 1 of this embodiment, divide the pretreated hydrogen pressure values ​​into m groups and calculate the average value p of each group of hydrogen pressure values j The steps are as follows:

[0028] The hydrogen pressure value of the power supply is selected as a characteristic parameter of satellite anomaly detection. The hydrogen pressure and the charge are linearly related to a certain extent. When the satellite power supply is working normally, the hydrogen pressure value fluctuates steadily. If the power supply fails, then This fluctuation will deviate from normal; and satellite telemetry data is usually at the second level, and calculating the average value over a period of time is conducive to data smoothing.

[0029] According to the collection law of satellite telemetry data, the acquired historical data is composed of several sampling points, and the continuous n hydrogen pressure value data points are regarded as a group, and there are m g...

specific Embodiment approach 3

[0033] The average value p described in the calculation step 1 described in the step 2 of the present embodiment j The steps for the mean and variance of are as follows:

[0034] Considering the satellite power system due to slight changes in the working environment, the state fluctuations of the power system itself, and the influence of measurement random errors, calculate the statistical characteristics of the hydrogen pressure value of the power supply, that is, the mean value p mentioned in the calculation step 1 j The mean and variance of ;

[0035] Calculate the mean p j mean value of P 0 :

[0036] p 0 = Σ j = 1 m p j / m

[0037] Calculate the mean p j The variance σ of 0 :

[0038] σ 0 = ...


PUM


Abstract

The invention provides an anomaly detection method based on a cumulative sum control chart and applied to a satellite power supply system, relates to the field of power supply system fault diagnosis, and aims to solve the problems that a threshold value is wider, small faults cannot be detected and warned early and the like for conventional anomaly detection of the satellite power supply system. The method comprises the following steps: historical data of normal operation of an NI-MH battery type satellite power supply in a time period is acquired, and the hydrogen pressure value of the power supply is selected as an evaluation parameter; the hydrogen pressure value is divided into m groups, and the average value pj of each group of hydrogen pressure values is calculated; the statistical properties of the hydrogen pressure values of the power supply are calculated, and the allowed deviator and the threshold value of the cumulative sum control chart are determined; the average value pi of hydrogen pressure values of a to-be-detected satellite power supply is calculated; the average value pi of the hydrogen pressure values is taken as input of a cumulative sum function, and an output value is drawn in the cumulative sum control chart; whether the cumulative sums S+(i) and S-(i) corresponding to the hydrogen pressure values of the to-be-detected satellite power supply exceed the threshold value of the cumulative sum control chart is judged, and the current working state of the power supply system is judged. The method is applicable to the field of fault diagnosis for an NI-MH battery type satellite power supply system.

Description

technical field [0001] The invention relates to the field of power system fault diagnosis. Background technique [0002] The power supply system is the core system of the satellite. The satellite enters and exits the shadow of the earth along with the charging and discharging of the battery and the solar battery array. When the solar battery array can meet the power supply, the power of the satellite is provided by the solar battery array, and the battery is charged at this time; When the power supply of the solar cell array is insufficient, it will be powered by the battery; when it enters the shadow of the earth, it will be completely powered by the battery. If the power supply of the battery is insufficient at this time, the satellite will not work normally. In serious cases, it will even lose control and become a "death star". [0003] At present, satellite batteries use nickel-metal hydride batteries. The common faults of nickel-hydrogen batteries mainly include battery...

Claims


Application Information

Patent Timeline
IPC IPC(8): G06F19/00
Inventor 李玉庆樊恒海王日新张海龙程瑶徐敏强杨天社
Owner HARBIN INST OF TECH
Why Eureka
Try Eureka