Anomaly Detection Method of Satellite Power System Based on Cumulative Sum Control Chart
A technology for satellite power supply and anomaly detection, which is used in electrical digital data processing, special data processing applications, instruments, etc. It can solve problems such as wide thresholds, inability to detect minor faults and early warning, and achieve high accuracy and save computing. effect of time
- Summary
- Abstract
- Description
- Claims
- Application Information
AI Technical Summary
Problems solved by technology
Method used
Image
Examples
specific Embodiment approach 1
[0020] An abnormal detection method for a satellite power system based on cumulative sum control charts, including the following steps:
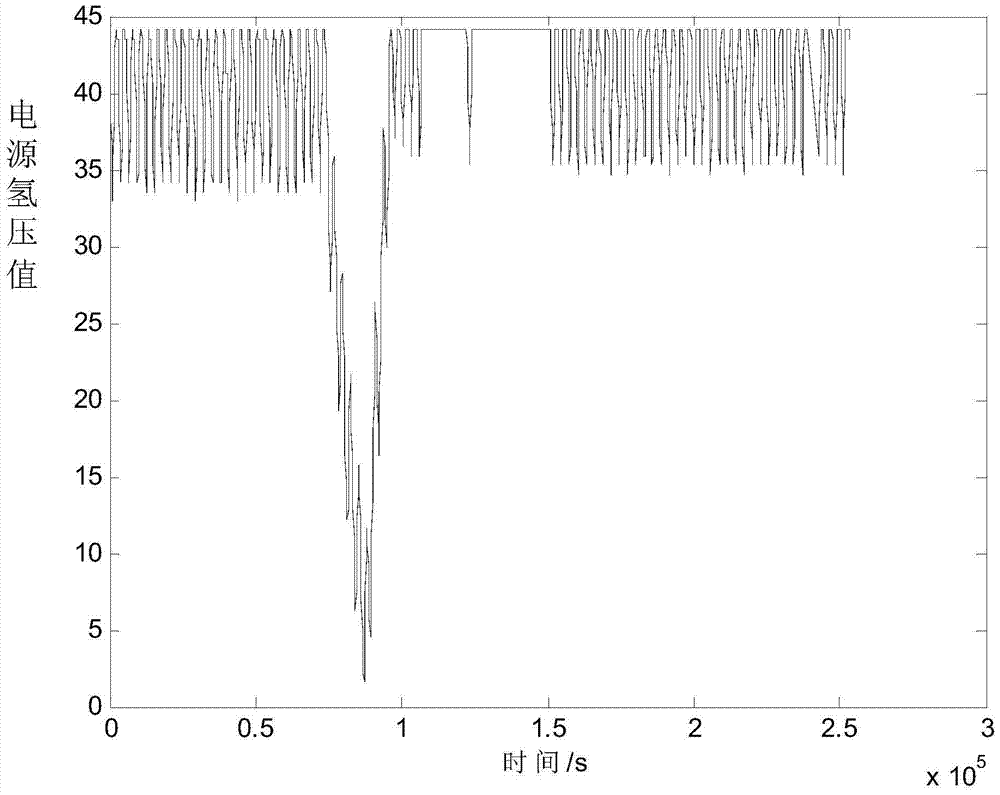
[0021] Step 1. Obtain the historical data of the normal operation of the nickel-hydrogen battery satellite power supply for a period of time, select the hydrogen pressure value of the power supply as an evaluation parameter, and perform pre-processing (including shaving and smoothing) on the hydrogen pressure value. The hydrogen pressure values are divided into m groups, and the average value p of each group of hydrogen pressure values is calculated j , j=1,2,...m;
[0022] Step 2, calculate the statistical characteristics of the hydrogen pressure value of the power supply, that is, calculate the mean value p described in step 1 j The mean and variance of ;
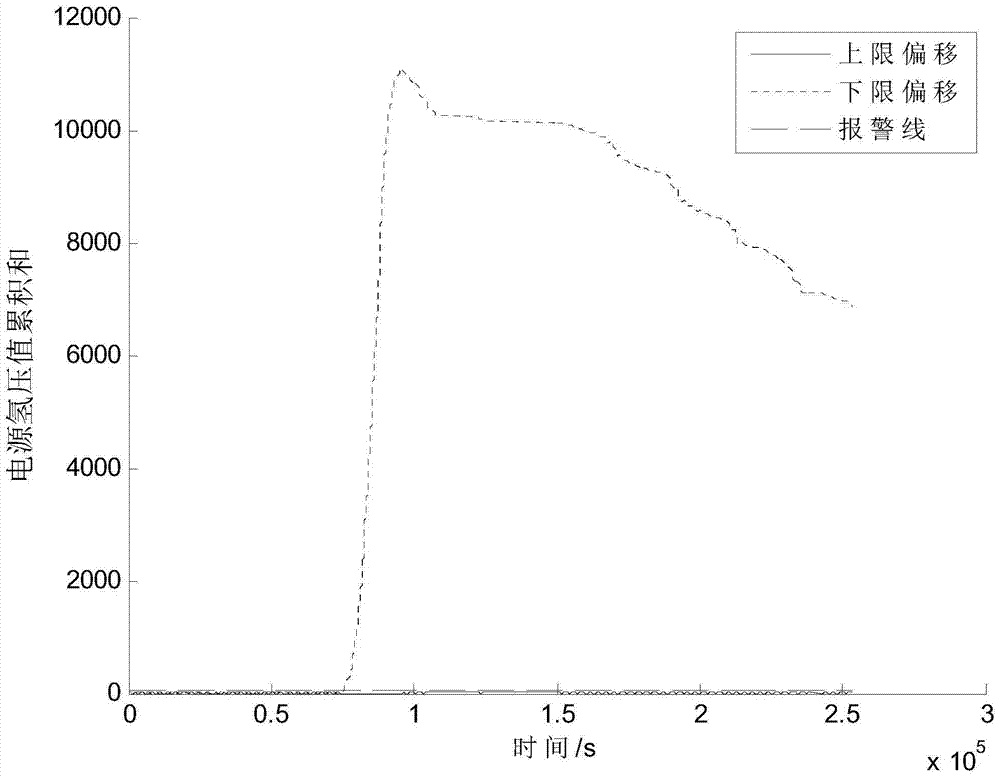
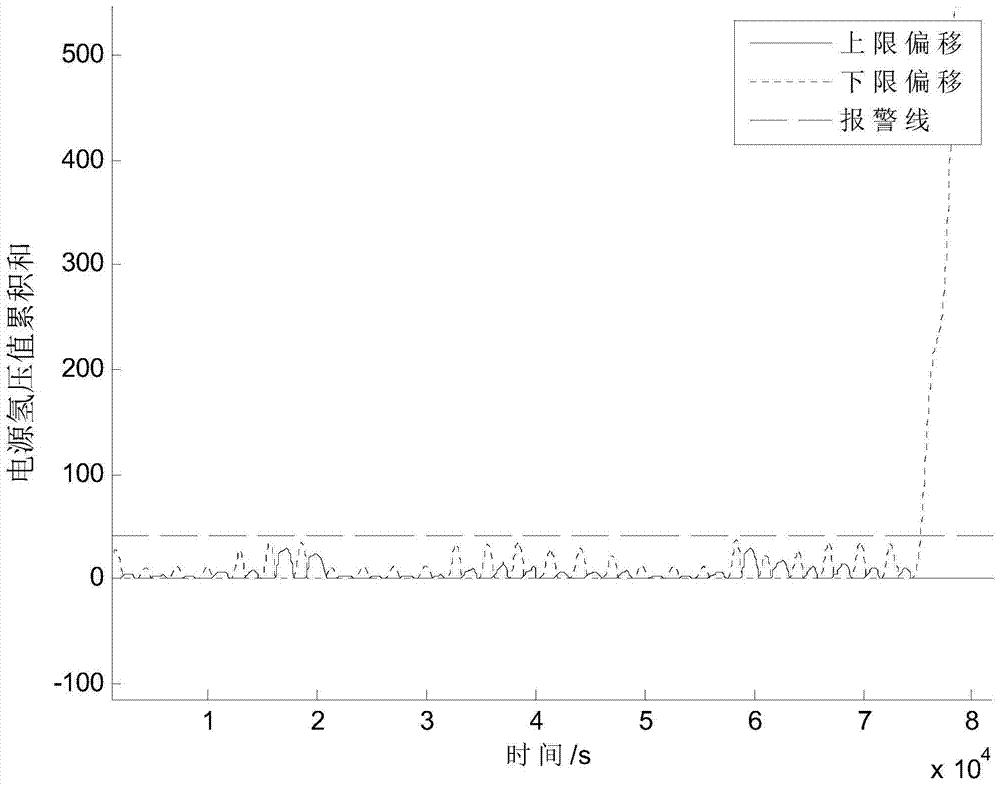
[0023] Step 3. Determine the tolerance and threshold value of the accumulation and control chart according to the statistical characteristics of the hydrogen pressure value duri...
specific Embodiment approach 2
[0027] As described in step 1 of this embodiment, divide the pretreated hydrogen pressure values into m groups and calculate the average value p of each group of hydrogen pressure values j The steps are as follows:
[0028] The hydrogen pressure value of the power supply is selected as a characteristic parameter of satellite anomaly detection. The hydrogen pressure and the charge are linearly related to a certain extent. When the satellite power supply is working normally, the hydrogen pressure value fluctuates steadily. If the power supply fails, then This fluctuation will deviate from normal; and satellite telemetry data is usually at the second level, and calculating the average value over a period of time is conducive to data smoothing.
[0029] According to the collection law of satellite telemetry data, the acquired historical data is composed of several sampling points, and the continuous n hydrogen pressure value data points are regarded as a group, and there are m g...
specific Embodiment approach 3
[0033] The average value p described in the calculation step 1 described in the step 2 of the present embodiment j The steps for the mean and variance of are as follows:
[0034] Considering the satellite power system due to slight changes in the working environment, the state fluctuations of the power system itself, and the influence of measurement random errors, calculate the statistical characteristics of the hydrogen pressure value of the power supply, that is, the mean value p mentioned in the calculation step 1 j The mean and variance of ;
[0035] Calculate the mean p j mean value of P 0 :
[0036]
[0037] Calculate the mean p j The variance σ of 0 :
[0038]
[0039] Other steps and parameters are the same as those in Embodiment 1 or 2.
PUM
 Abstract
Description
Claims
Application Information
 - R&D
- Intellectual Property
- Life Sciences
- Materials
- Tech Scout
- Unparalleled Data Quality
- Higher Quality Content
- 60% Fewer Hallucinations
Browse by: Latest US Patents, China's latest patents, Technical Efficacy Thesaurus, Application Domain, Technology Topic, Popular Technical Reports.
© 2025 PatSnap. All rights reserved.Legal|Privacy policy|Modern Slavery Act Transparency Statement|Sitemap|About US| Contact US: help@patsnap.com


