Unlock instant, AI-driven research and patent intelligence for your innovation.
Time-varying tree graph layout method and application for time-varying and hierarchical data
What is Al technical title?
Al technical title is built by PatSnap Al team. It summarizes the technical point description of the patent document.
A technology of hierarchical data and layout methods, applied in the field of information visualization, can solve problems such as unrealizable, time-consuming, and describing nodes, and achieve good results
Active Publication Date: 2016-02-24
BEIJING TECHNOLOGY AND BUSINESS UNIVERSITY
View PDF3 Cites 10 Cited by
Summary
Abstract
Description
Claims
Application Information
AI Technical Summary
This helps you quickly interpret patents by identifying the three key elements:
Problems solved by technology
Method used
Benefits of technology
Problems solved by technology
However, for the visualization of time-varying hierarchical data (data with both hierarchical and time-dimensional attributes), if the existing treemap algorithm is used to track the same nodes in the layout, it still takes a lot of time and cannot be realized. Accurately and quickly describe the changes of nodes while preserving the hierarchy of the tree diagram
Method used
Image
Click on the blue label to locate the original text in one second.
Reading with bidirectional positioning of images and text.
Examples
Embodiment I
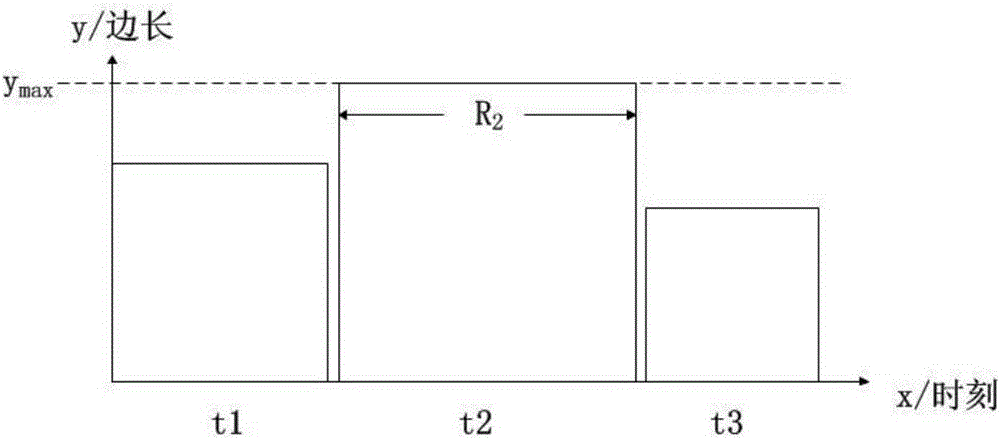
[0046] The data set DS to be visualized in this embodiment is data A1{1,1,1,1,1,1,1,1,1}, A2{3,3,4,1,1,1,1,1 ,1}}, the set of A3{1,1,1,1,2,1,3,2,4} corresponds to the weight change and distribution of the same tree structure at T1, T2 and T3 respectively case, the sum of the node values are 9, 16 and 16 respectively.
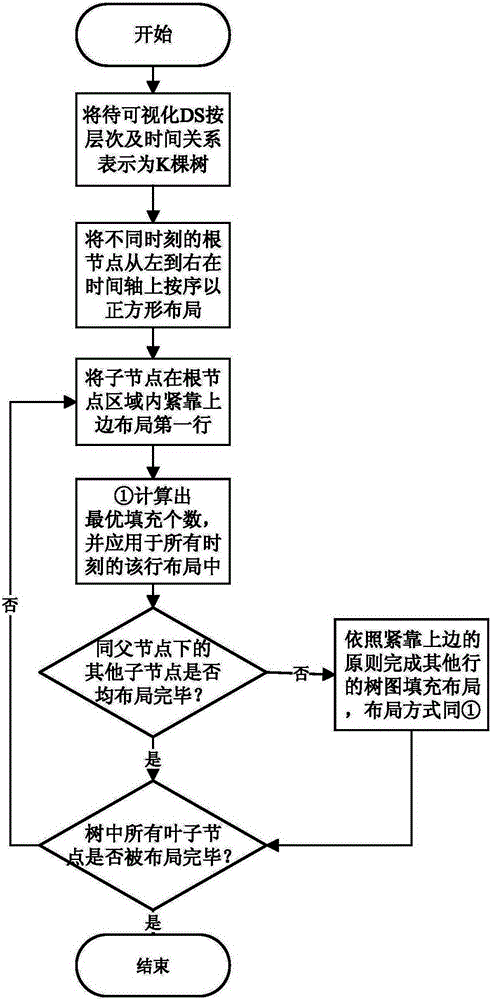
[0047] Using the time-varying tree diagram layout method for time-varying hierarchical data proposed by the present invention, the above-mentioned visualization data set DS is visualized, and the specific operation steps are:
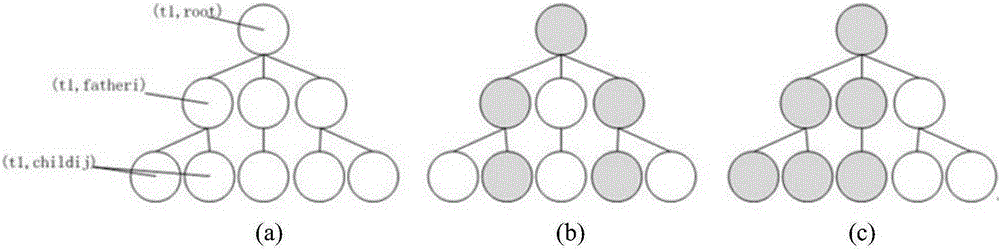
[0048] A. Represent the data set DS to be visualized as K trees according to the hierarchy and time relationship;
[0049] The number expressed as trees is the same as the number of times when a node is compared before and after the change, that is, how many times there are are expressed as several trees.
[0050] Such as figure 2 As shown, it is expressed as the number of trees K=3, the root nodes are (t1, root), (t2, root) and (t3,...
Embodiment II
[0073] This embodiment illustrates the application of the visualization method provided by the present invention in the pesticide residue detection result data as an example. The data set DS to be visualized in this embodiment is the pesticide residue detection data of agricultural products in Beijing from February to March. This data is simulated data based on real data, including 477 records of pesticide residues in fruits and vegetables. 1233 items, only part of the data is listed here as follows:
[0074]
[0075]
[0076]
[0077]
[0078] Using the time-varying tree diagram layout method for time-varying hierarchical data proposed by the present invention, the above-mentioned data set DS to be displayed is visualized, and the specific operation steps are:
[0079] A. Represent the data set DS to be visualized as two trees according to the hierarchy and time relationship;
[0080] In this embodiment, since only two time points (February and March) are involve...
PUM
Abstract
The invention discloses a time-varying tree graph layout method for time-varying and hierarchical data. The time-varying tree graph layout method comprises the steps of representing a data set DS into K trees based on a hierarchy and time relation; performing arrangement and layout on root nodes (tk, root) of trees or sub trees in different moments on a timer shaft in sequence; performing layout for the first line in a corresponding region of child nodes of (tk, root) by adopting a line layout mode; repeating to execute the layout until all the child nodes under a father node are subjected to layout; and finally finishing the time-varying tree graph layout for the to-be-displayed overall data set DS. The time-varying tree graph layout method provided by the invention is applied to the display and analysis of time-varying and hierarchical pesticide residues data; the original layout region in each moment is set to be square; the tree graph filling layout is finished by adopting a line layout mode; and the generated tree graph can display both of the hierarchical characteristic and time attribute of the pesticide residues data, so that the time-varying tree graph layout method is quite good in the visualization effect.
Description
technical field [0001] The invention belongs to the field of information visualization, and specifically relates to a time-varying tree diagram layout method and application for time-varying hierarchical data. Background technique [0002] In the context of the big data era, how to find the rules from massive data through effective visual analysis methods, so as to help users make decisions is a hot topic in the field of big data today. [0003] Hierarchical data has always been a key research object in the field of visualization. The classic hierarchical data visualization algorithms include node-link, tree diagram, and radial ring, among which the tree diagram method has been used in various fields such as physiological analysis, picture display, and economic status analysis. applied in. The tree graph layout algorithm was first proposed by Johnson et al. in 1993. Aiming at the shortcomings of node coverage and low space utilization in the node link method, a filling layo...
Claims
Application Information
Patent Timeline
Application Date:The date an application was filed.
Publication Date:The date a patent or application was officially published.
First Publication Date:The earliest publication date of a patent with the same application number.
Issue Date:Publication date of the patent grant document.
PCT Entry Date:The Entry date of PCT National Phase.
Estimated Expiry Date:The statutory expiry date of a patent right according to the Patent Law, and it is the longest term of protection that the patent right can achieve without the termination of the patent right due to other reasons(Term extension factor has been taken into account ).
Invalid Date:Actual expiry date is based on effective date or publication date of legal transaction data of invalid patent.
