Method and device for implementing data visualization

An implementation method and data technology, applied in the direction of electrical digital data processing, special data processing applications, instruments, etc., can solve problems such as the inability to guarantee the ability of front-end developers to reconstruct abstraction, javascript flooding, waste of coding costs, learning costs and rework costs, etc. , to achieve the effect of improving R&D efficiency and front-end performance

Active Publication Date: 2016-04-20
ALIPAY (HANGZHOU) INFORMATION TECH CO LTD
View PDF4 Cites 37 Cited by
  • Summary
  • Abstract
  • Description
  • Claims
  • Application Information

AI Technical Summary

Problems solved by technology

If these links are allowed to be resolved by the developers themselves, it will often lead to the flood of javascript with different styles in each product code (we cannot guarantee that every front-end developer has a high refactoring abstraction ability), once the common logic is not precipitated and reused , the subsequent maintenance and expansion work will waste a lot of coding costs, learning costs, and rework costs

Method used


Image

  • Method and device for implementing data visualization
  • Method and device for implementing data visualization
  • Method and device for implementing data visualization

Examples


Embodiment Construction

[0074] The present invention will be described in detail below in conjunction with various embodiments shown in the drawings. However, these embodiments do not limit the present invention, and any structural, method, or functional changes easily made by those skilled in the art based on these embodiments are included in the protection scope of the present invention.

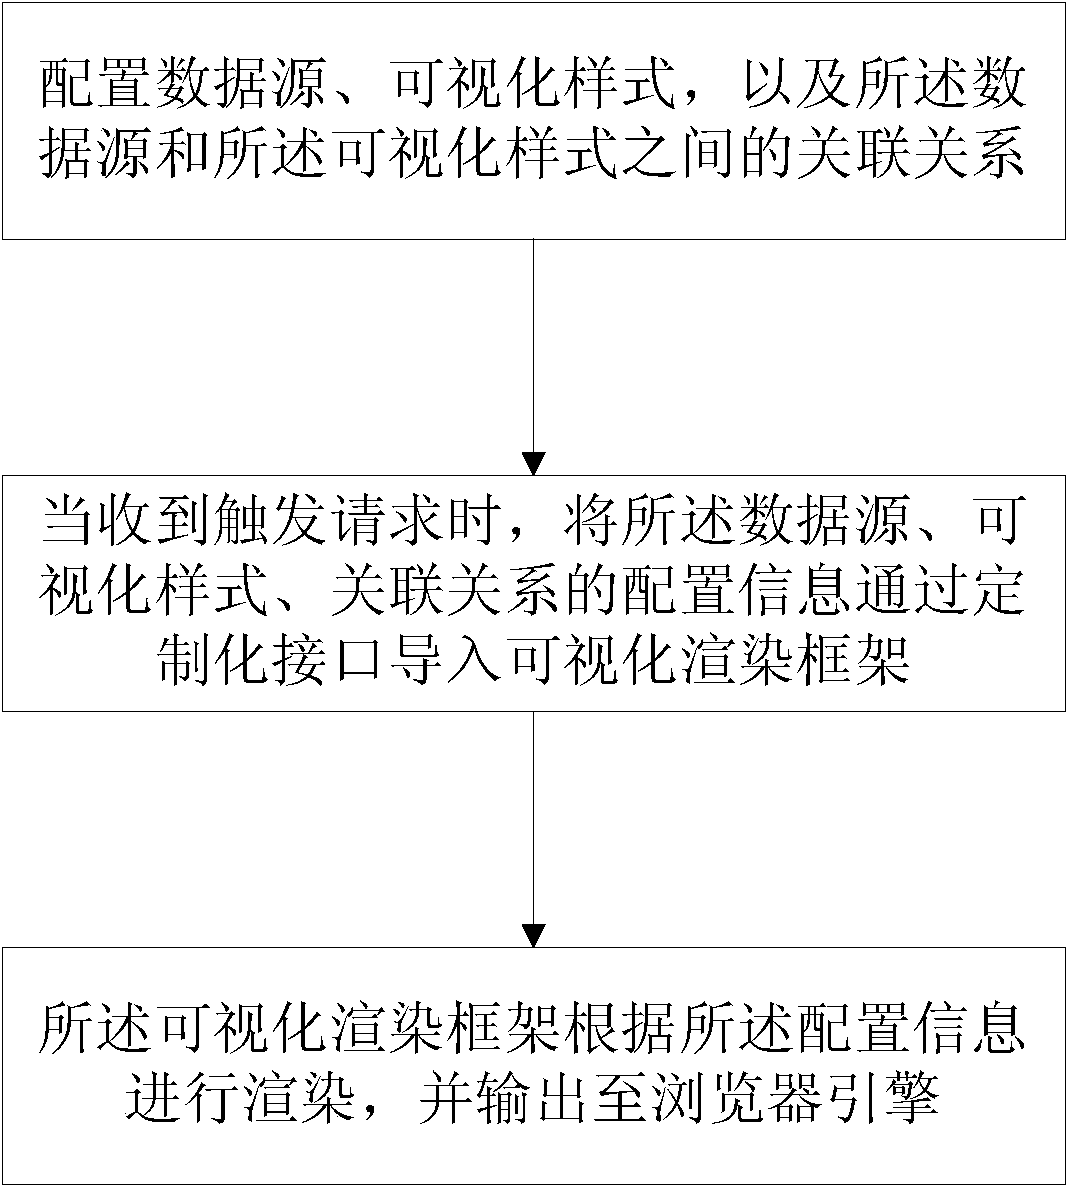
[0075] Such as figure 1 As shown, one embodiment of the present invention provides a method for realizing data visualization, which includes:

[0076] Configure data sources, visualization styles, and the relationship between data sources and visualization styles;

[0077] In the field of data analysis, users often face a variety of data sources. For example, when the data warehouse produces BI reports, it may be necessary to obtain not only the data cleaned by ETL in the DB (such as the number of transactions of a certain commodity), but also the data of log analysis (such as the UV of a certain commodity brow...


PUM


Abstract

The invention provides a method and device for implementing data visualization. The method comprises the steps that a data source, a visualization format and a correlation between the data source and the visualization format are configured; when a trigger request is received, configuration information of the data source, the visualization format and the correlation is led into a visualization rendering framework via a customized interface; and visualization rendering framework carries out rendering according to the configuration information, and the information is output to a browser engine. The method and device provided by the invention have the beneficial effects that the visualization rendering framework as well as the data source, the visualization format and the correlation thereof can be encapsulated independently; a user only needs to configure the data source, the visualization format and the correlation thereof so as to lead the information into the visualization rendering framework for rendering; and research and development efficiency is increased, and front-end performance is improved.

Description

technical field [0001] The invention relates to a method and device for realizing data visualization, in particular to a method and device for realizing front-end data visualization. Background technique [0002] With the advancement of technology, big data analysis is becoming more and more popular. In addition to the problems of massive data calculation and storage, there is another important link that affects product development efficiency and user experience, that is, data visualization. However, even if there are many optional front-end report technologies such as EXT and GoogleLineChart, they can only be used as tools, and there is no scalable front-end IOC development framework, which cannot effectively reduce R&D costs. [0003] Among the front-end report technologies, the common ones include Ext, GoogleLineChart, HighChart and so on. These techniques are usually rendering-heavy and frame-heavy, and can only be used as tools. Each of them stipulates its own data st...

Claims


Application Information

Patent Timeline
Patent Type & Authority Applications(China)
IPC IPC(8): G06F17/30
CPCG06F16/00
Inventor 储晓颖
Owner ALIPAY (HANGZHOU) INFORMATION TECH CO LTD
Why Eureka
Try Eureka