Real-time data multi-curve display method for operation facility

A real-time data and multi-curve technology, applied in the field of curve display, can solve the problems of insufficient intuitive display, inability to realize direct comparison, and insufficient intuitive comparison of data or curves, so as to achieve the effect of convenient comparison operation, convenient comparison, and improved accuracy

Inactive Publication Date: 2016-05-11
BEIJING JINKONG DATA TECH
View PDF3 Cites 4 Cited by
  • Summary
  • Abstract
  • Description
  • Claims
  • Application Information

AI Technical Summary

Problems solved by technology

At present, the display of real-time data is mainly divided into report display and curve display. Among them, the display of the data change trend in the report is not intuitive enough; the curve display is mostly a single curve and a single ordinate, and the comparison between data or curves is not intuitive enough and cannot be realized. direct comparison

Method used


Image

  • Real-time data multi-curve display method for operation facility
  • Real-time data multi-curve display method for operation facility

Examples


Embodiment 1

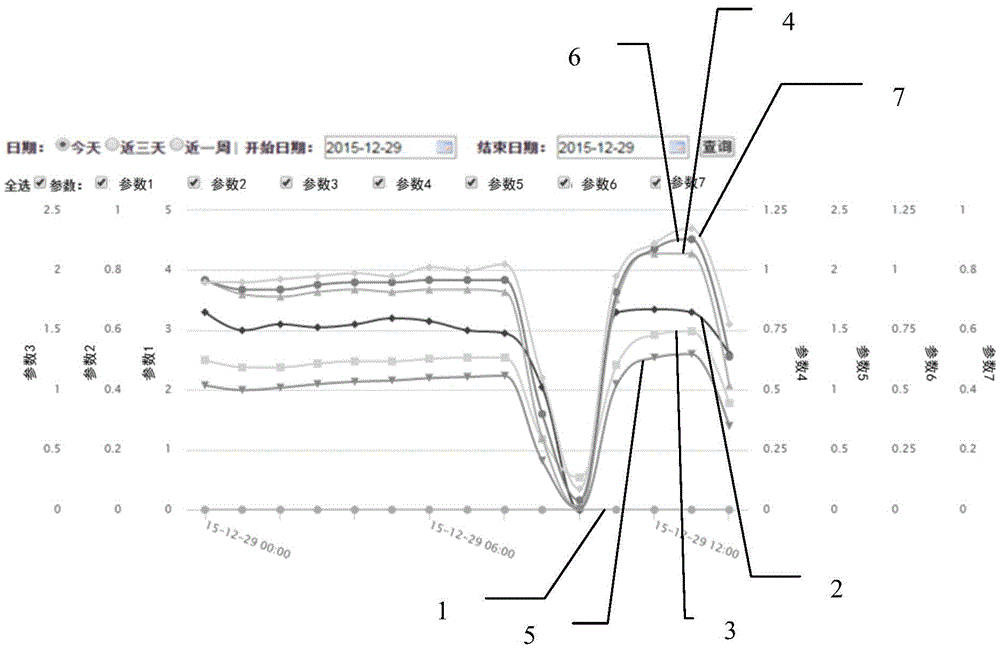
[0046] A multi-curve display method for real-time data of operating facilities, such as figure 1 shown, including the following steps:

[0047] Step 1. Real-time monitoring of the production and operation data of the operating facilities, and collecting and storing them in the database. The time option selects today, and the parameter option selects parameter 1, parameter 2, parameter 3, parameter 4, parameter 5, parameter 6 and parameter 7.

[0048] Step 2: Retrieving 7 sets of production operation data to be displayed from the database, that is, 7 parameters, and matching them with multiple data attributes in the preset curve control. When at least one piece of production operation data in any set of production operation data cannot match all the data attributes in the curve control, the data attributes of the curve control are customized and extended according to the attributes of the production operation data, and the corresponding The data attribute of the data is added...

Embodiment 2

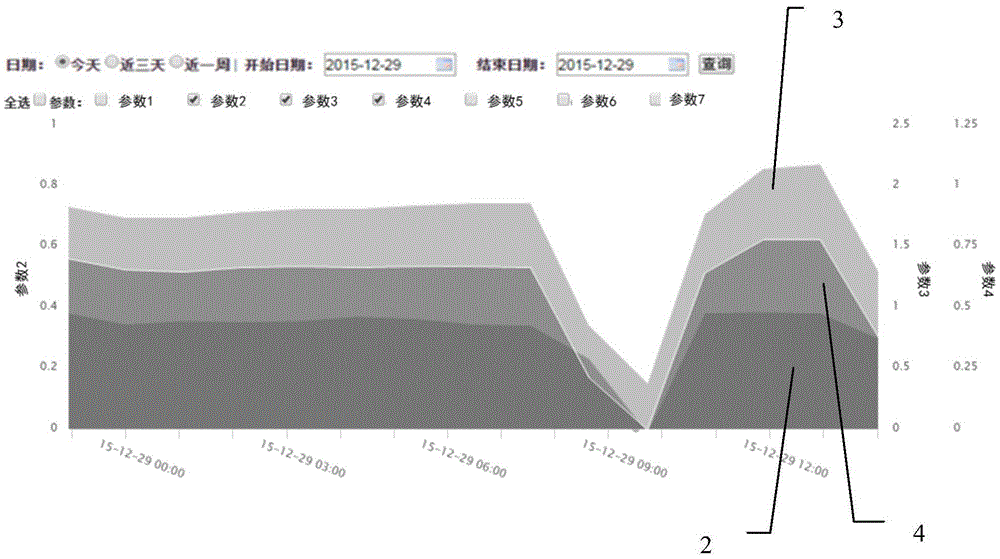
[0051] A multi-curve display method for real-time data of operating facilities, such as figure 2 shown, including the following steps:

[0052] Step 1. Real-time monitoring of the production and operation data of the operating facilities, and collecting and storing them in the database. Select today as the time option, and select parameter 2, parameter 3, and parameter 4 as the parameter option.

[0053] Step 2. Three sets of production operation data to be displayed, that is, three parameters, are retrieved from the database, and matched with multiple data attributes in the preset curve control. When at least one piece of production operation data in any set of production operation data cannot match all the data attributes in the curve control, the data attributes of the curve control are customized and extended according to the attributes of the production operation data, and the corresponding The data attribute of the data is added to the curve control, and the matching ...


PUM


Abstract

The invention relates to a curve display method, in particular to a real-time data multi-curve display method for an operation facility. The real-time data multi-curve display method comprises the following steps: monitoring production operation data of the operation facility in real time, and acquiring and further storing the production operation data in a database; calling a plurality groups of production operation data to be displayed, matching the production operation data with a plurality of data attributes in a pre-configured a curve control; when at least one production operation data of any one group of production operation data is not matched with all the data attributes in the curve control, performing user-defined expansion on the data attributes of the curve control according to the attributes of the production operation data, and completing matching of the data attributes with the production operation data; performing circular traversing on each group of production operation data, adding a corresponding groups of longitudinal coordinates according to setup of the curve control, and then carrying out multi-curve displaying simultaneously. The invention provides a method for demonstrating multiple curves simultaneously, and longitudinal coordinate display values can be correspondingly adjusted according to change of data in time.

Description

technical field [0001] The invention relates to a curve display method. More specifically, the present invention relates to a multi-curve display method for real-time data of operating facilities. Background technique [0002] The trend of the era of big data is becoming more and more significant, and it is very important for the collection and analysis of data. At present, the display of real-time data is mainly divided into report display and curve display. Among them, the display of the data trend in the report is not intuitive enough; the display of the curve is mostly a single curve and a single vertical coordinate, and the comparison between data or curves is not intuitive enough and cannot be realized. direct comparison. Especially for the environmental protection industry, multiple data are highly correlated, and multiple sets of data need to be displayed at the same time. Contents of the invention [0003] It is an object of the present invention to solve at le...

Claims


Application Information

Patent Timeline
IPC IPC(8): G06F17/30
CPCG06F16/9038
Inventor 张帅刚唐丽娜孙莹莹王泽杨斌任艳真
Owner BEIJING JINKONG DATA TECH
Why Eureka
Try Eureka