Patient medication compliance judging method
A patient and drug technology, applied in the field of judging patients' medication compliance, can solve problems such as toxic side effects, discrete data that cannot see the overall trend of users, and cannot be displayed, and achieve an effect that is easy to compare
- Summary
- Abstract
- Description
- Claims
- Application Information
AI Technical Summary
Problems solved by technology
Method used
Image
Examples
Embodiment 1
[0035] Medication Adherence Scale:
[0036] User 1 takes medicine once a day, and the ideal time for taking medicine is t i =8:00
[0037] Number of levels in Medication Adherence Scale = 3
[0038] D=(-0.5,0.5) hours corresponding to grade T=3 compliance
[0039] D=(-2,-0.5), (0.5,2) hours corresponding to grade T=2 compliance
[0040] Time period for level T = 1 compliance is = other values
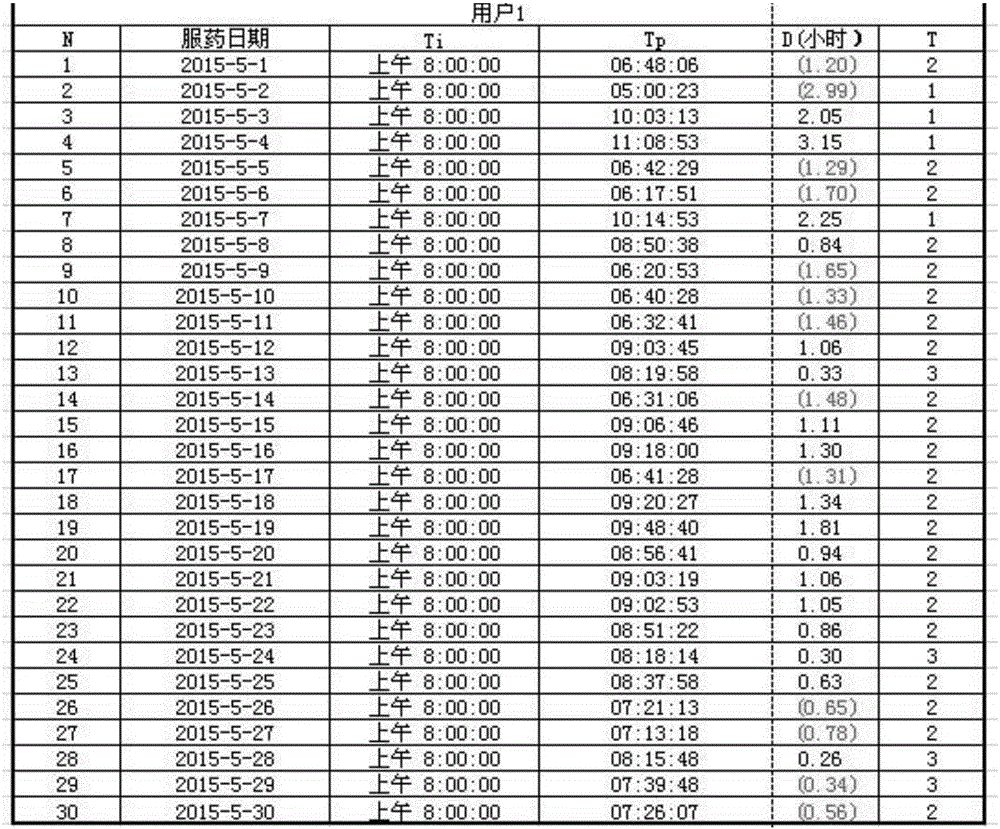
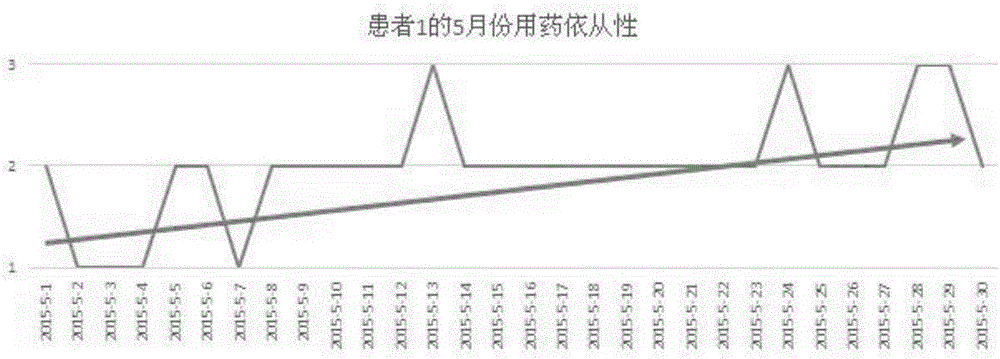
[0041] Collect the user's actual medication time t in a fixed period of time every day from the smart medication device p , calculate medication compliance D=t p -t i , get the value of D and then find out the corresponding level T from the drug compliance level table, get as follows figure 1 data shown, then according to the figure 1 drawn as figure 2 In the user 1 compliance table shown, the user 1's compliance can be visually observed through the graph, and it can be seen from the table that the user 1's compliance is an increasing trend, which means that the user 1's compl...
Embodiment 2
[0043] Medication Adherence Scale:
[0044] User 1 and User 2 take medicine once a day, and the ideal time for taking medicine is t i =8:00
[0045] Number of levels in Medication Adherence Scale = 3
[0046] D=(-0.5,0.5) hours corresponding to grade T=3 compliance
[0047] D=(-2,-0.5), (0.5,2) hours corresponding to grade T=2 compliance
[0048] Time period for level T = 1 compliance is = other values
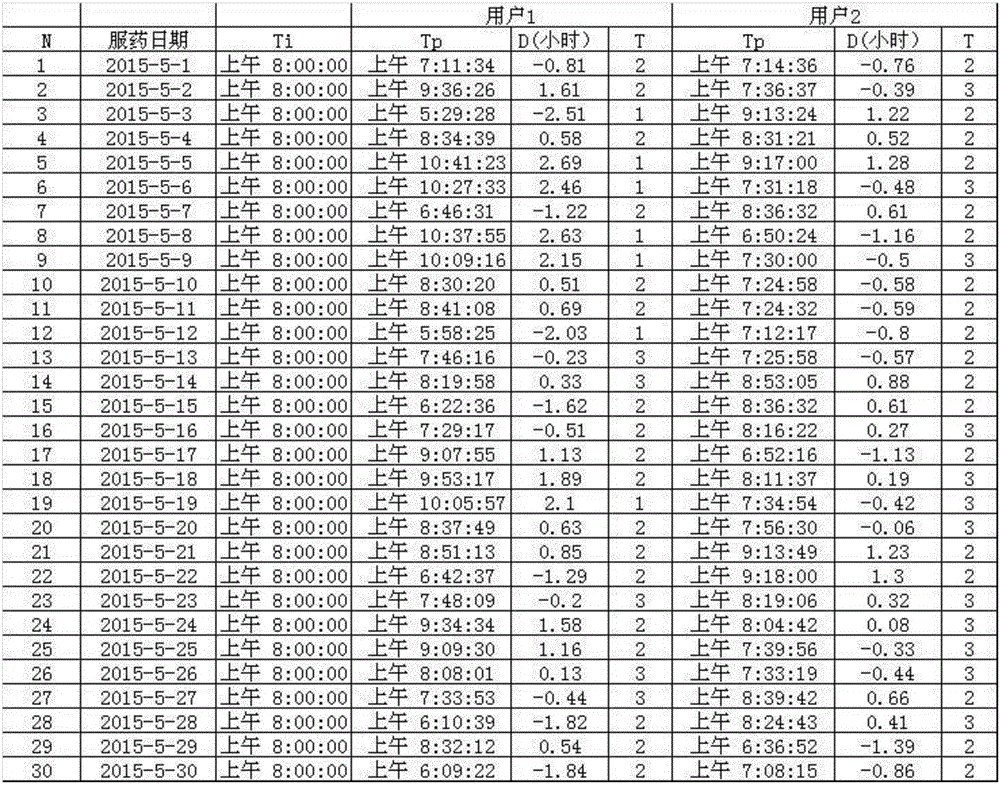
[0049] Collect the actual medication time t of user 1 and user 2 in a fixed time period every day from the smart medication device p , calculate medication compliance D=t p -t i , get the value of D and then find out the corresponding level T from the drug compliance level table, get as follows image 3 data shown, then according to the image 3 drawn as Figure 4 The comparison table of user 1 and user 2 compliance is shown, in which: the dotted line is the compliance of user 2, and the straight line is the compliance of user 1; the average compliance of user 1 is ob...
PUM
 Abstract
Description
Claims
Application Information
 - R&D
- Intellectual Property
- Life Sciences
- Materials
- Tech Scout
- Unparalleled Data Quality
- Higher Quality Content
- 60% Fewer Hallucinations
Browse by: Latest US Patents, China's latest patents, Technical Efficacy Thesaurus, Application Domain, Technology Topic, Popular Technical Reports.
© 2025 PatSnap. All rights reserved.Legal|Privacy policy|Modern Slavery Act Transparency Statement|Sitemap|About US| Contact US: help@patsnap.com


