Noise source visualized data accumulation display method, data processing device and acoustic camera system

A technology of data accumulation and display method, which is applied in the direction of determining the direction or offset system, measuring device, signal processing, etc., and can solve the problems of buried and non-displayed noise characteristics of the analysis object

Active Publication Date: 2016-11-16
萨姆株式会社
View PDF20 Cites 4 Cited by
  • Summary
  • Abstract
  • Description
  • Claims
  • Application Information

AI Technical Summary

Problems solved by technology

[0006] When using a trigger method that simply uses the sound pressure level, the noise source that becomes the measurement and analysis object is triggered when the background noise caused by the surrounding noise increases at the moment when no noise occurs, and the noise characteristics of the analysis object are suppressed by unnecessary noise (background). Noise) buried and not displayed, the present invention aims to provide a noise source visualization data accumulation display method and acoustic camera system to solve this problem

Method used


Image

  • Noise source visualized data accumulation display method, data processing device and acoustic camera system
  • Noise source visualized data accumulation display method, data processing device and acoustic camera system
  • Noise source visualized data accumulation display method, data processing device and acoustic camera system

Examples


Embodiment Construction

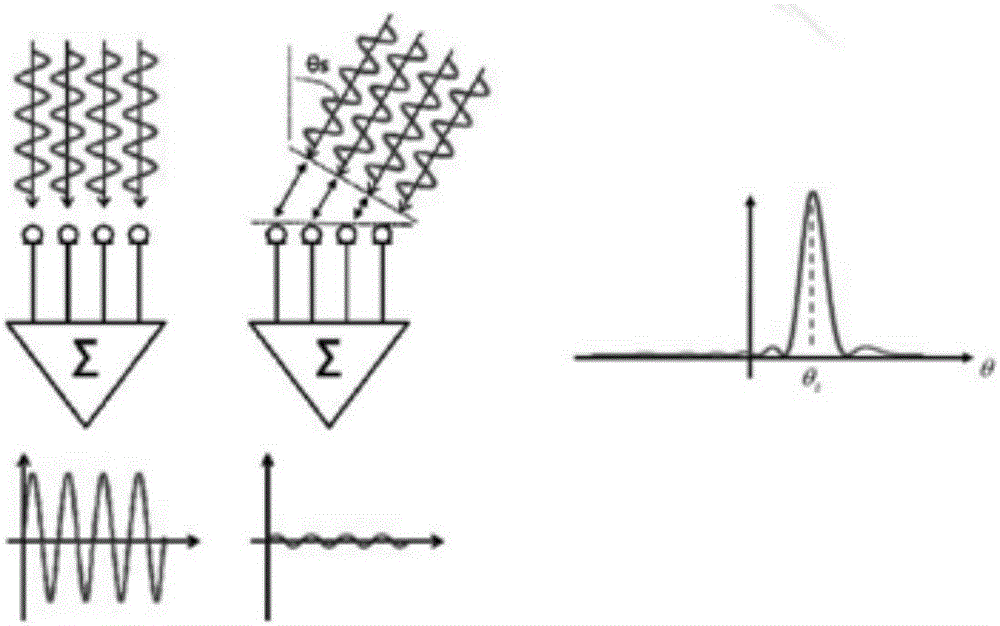
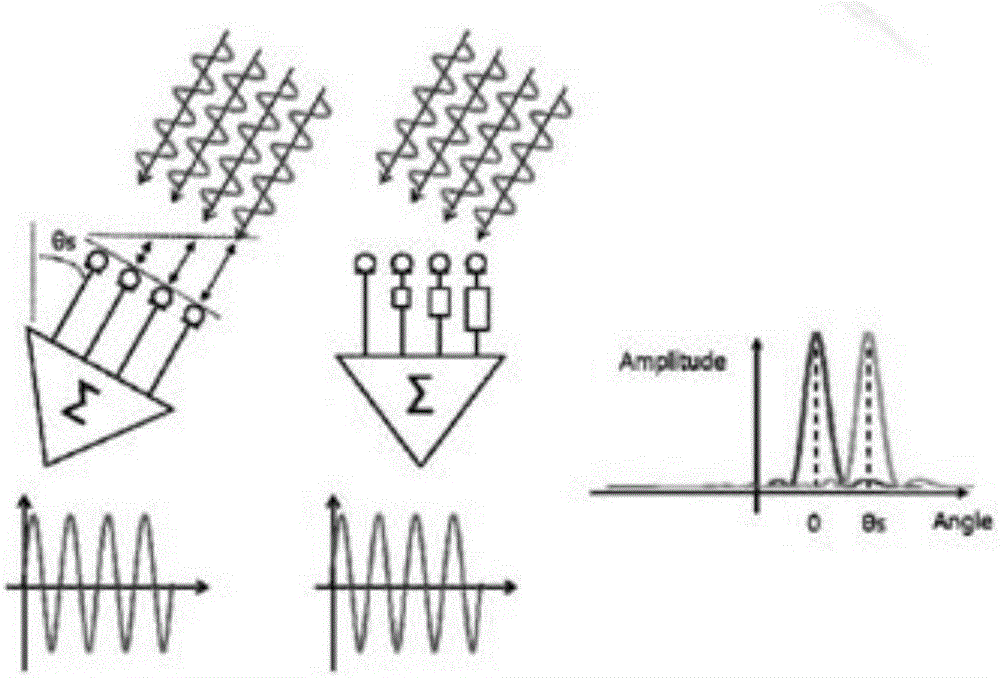
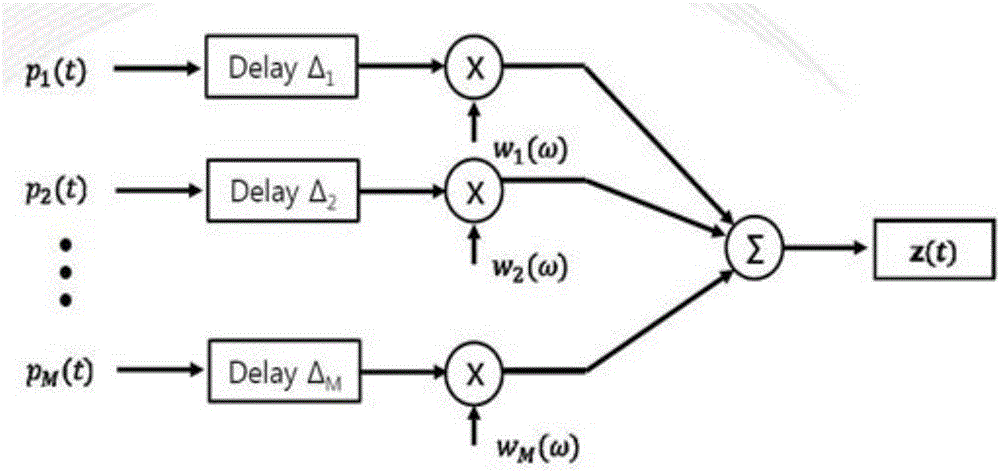
[0032] Figure 1a , Figure 1b , Figure 1c It is a diagram illustrating the concept of beamforming. The beamforming method can be described by the following equation. yi(t) is the signal measured by the i-th microphone, and z(t) is the beam output. Among the signals measured by the M microphones, given the time delay in the direction of the virtual sound source, after multiplying the weighted value by the sensor, and adding the signal, the beam power can be obtained. If the actual sound source is in the same direction as the virtual sound source, the signal is amplified. In this way, the location of the noise source can be estimated. The beam power can be expressed numerically as follows.

[0033] b ( t ) = Σ j p m ( t - Δt ...


PUM


Abstract

The invention relates to a noise source visualized data accumulation display method,comprising a step S10 of providing a sound and video signal collecting means 100; an initial signal collecting step S20; an initial analyzing step S30; an initial developing step S40; an accumulating signal collecting step S50; an accumulating signal analyzing step S60; and an accumulating displaying step S70, wherein in the display unit 50, the accumulated sound data are displayed on an image in which the initial sound data and the image data are superimposed on each other.

Description

technical field [0001] The invention relates to a noise source visualization data accumulation display method and an acoustic camera system. Background technique [0002] Acoustic cameras are cutting-edge measurement equipment that visualizes sound, and are new technology equipment required in various fields such as multimedia information communication equipment, home appliances, automobiles, and construction. [0003] Microphone Array Beamformer (Microphone Array Beamformer), as one of the methods to find out the location of the noise source, is to use multiple microphone sensors to measure the sound waves generated by the noise source, and through its signal processing, the distribution of the noise source can be visualized like a photo. . The method used is to reconstruct the signal generated at a specific sending position according to the characteristics of the signal received by each microphone, measure its sound pressure, graph the measured sound pressure level as a s...

Claims


Application Information

Patent Timeline
Patent Type & Authority Applications(China)
IPC IPC(8): G01H11/06G10L21/0216
CPCG01H11/06G10L21/0216G10L2021/02166G01S3/808G10L21/10H04R1/406H04R3/005H04R2430/23B81B2201/0292G01H3/125G03B41/06H04R1/1083H04R2201/003G01S7/52044
Inventor 金荣基
Owner 萨姆株式会社
Why Eureka
Try Eureka