
Method for displaying three-dimensional scatter diagram in browser and system thereof

A scatter diagram and browser technology, applied in 3D image processing, instrumentation, image data processing, etc., can solve problems such as inconvenient control operation, inaccurate display, and memory occupation, so as to save computing performance and rendering performance , a wide range of effects

Active Publication Date: 2017-07-21
CHENGDU SEFON SOFTWARE CO LTD
View PDF4 Cites 4 Cited by
  • Summary
  • Abstract
  • Description
  • Claims
  • Application Information

AI Technical Summary

Problems solved by technology

[0003] Generally, the three-dimensional scatter diagram is mainly drawn by chart tools or flash, and cannot be generated in real time through dynamic data in a system based on BS mode, the display is inaccurate, and the reusability is poor
[0004] The technology for displaying 3D scatterplots in BS mode is generally based on WebGL, but there is currently no systematic way to display 3D scatterplots in this way, especially when there are many points, it will take up most of the memory and cause the page to freeze , and the control operation is inconvenient

Method used


Image

  • Method for displaying three-dimensional scatter diagram in browser and system thereof
  • Method for displaying three-dimensional scatter diagram in browser and system thereof
  • Method for displaying three-dimensional scatter diagram in browser and system thereof

Examples


Embodiment Construction

[0043] The technical solution of the present invention will be further described in detail below in conjunction with the accompanying drawings, but the protection scope of the present invention is not limited to the following description.

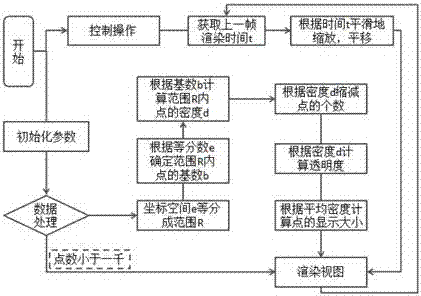
[0044] Such as figure 1 As shown, a method for displaying a three-dimensional scatter plot in a browser specifically includes the following steps:

[0045] S001 generates a three-dimensional coordinate space:

[0046] S101 Initialize the three-dimensional coordinate space, including the background color of the three-dimensional space, and coordinate system parameters (coordinate axes and grid surfaces). There is no length standard in three-dimensional space, first set a standard length L=200, and generate a three-dimensional coordinate space according to this standard and data:

[0047] S102: Determine whether the data provides the background color data of the entire three-dimensional space, if yes, use the color provided by the data, oth...


PUM


Abstract

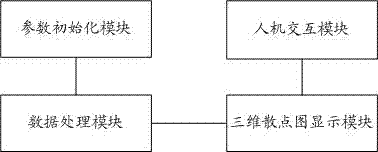
The invention discloses a method for displaying a three-dimensional scatter diagram in a browser and a system thereof, and relates to the field of three-dimensional scatter diagram display. The method for displaying the three-dimensional scatter diagram in the browser comprises the following steps that parameters are initialized, including coordinate system parameters, three-dimensional space background color, coordinate axes, reference line and other information; a series processing is performed on the received data; the processed data are rendered in a given container by using the WebGL technology; and the control operation of the view scene. The system for displaying the three-dimensional scatter diagram in the browser comprises a parameter initialization module, a data processing module, a three-dimensional scatter diagram display module and a human-computer interaction module. The method and the system are based on the browser and wide in the range of application; the performance is optimized according to the change of the visual angle; the performance is optimized according to the density of points; the data are dynamically displayed; the computing pressure of the server is low; and the interactivity is high.

Description

technical field [0001] The invention relates to the field of three-dimensional scattergram display, in particular to a method and system for displaying a three-dimensional scattergram in a browser. Background technique [0002] The three-dimensional scatterplot mainly studies the relationship between variables in a three-dimensional space determined by three variables, and is usually used to display and compare numerical values, such as scientific data, statistical data, and engineering data. It can intuitively reflect the quantitative correlation trend and degree of density among variables. [0003] Generally, the three-dimensional scatter diagram is mainly drawn by chart tools or flash, and cannot be generated in real time through dynamic data in a system based on BS mode, the display is inaccurate, and the reusability is poor. [0004] The technology for displaying 3D scatterplots in BS mode is generally based on WebGL, but there is currently no systematic way to display...

Claims


Application Information

Patent Timeline
Patent Type & Authority Applications(China)
IPC IPC(8): G06T15/00G06F3/0481G06F3/0484
CPCG06F3/04815G06F3/04845G06T15/00
Inventor 蓝科王纯斌周普缪宇
Owner CHENGDU SEFON SOFTWARE CO LTD
Learn More